3828
ADC histogram analysis of rectal cancer patients for early detection of therapeutic efficacy of neoadjuvant radio-chemotherapy: initial results.1Department of Radiology - Medical Physics, University Medical Center, Freiburg, Germany, 2Klinik für Radiologie, Klinikum St. Georg, Leipzig, Germany
Synopsis
Successful monitoring of neoadjuvant radiochemo therapy will allow early selection of responder and non-responder. Beside conventional morphological MRI additional functional MRI in combination with advanced analysis strategies like histogram analysis of ADC values are promising. Initial results of an ongoing clinical study are presented.
Introduction
Neoadjuvant radiochemo therapy is integral part of a standard therapy plan for patients with advanced rectum carcinoma. A quarter of the patients show complete response. However a significant share of patients, up to 50%, shows no response at all. Patient selection for suitable treatment paths is challenging [1]. This raises the need of an early indicator to identify potential non responder to allow an early therapy change, which is in the interest of the patient as well as the health care system. While morphological magnetic resonance imaging (MRI) is part of the therapy monitoring, its extension with functional MRI like diffusion weighted MRI (DWI-MRI) and dynamic contrast enhanced MRI (DCE-MRI) may help to gain this information. It was shown that diffusion weighted MRI may detect treatment-induced changes in tumor cell membrane integrity well before any volumetric decrease [2].
In a retrospective study a histogram metrics approach was presented by Cui et al [3]. Here we present the intermediate analysis of DWI-MRI data of an ongoing study.
Methods
Between August 2015 and August 2017, 29 patients with locally advanced rectal cancer were enrolled in this ongoing study. They all underwent neoadjuvant radiochemo therapy. The patients got MRI scans before, 48hours, 2, 4 and 12 weeks after treatment initiation. Additional to standard morphological MRI scans the protocol included diffusion weighted MRI and dynamic contrast enhanced MRI scans.
All MRI scans were acquired on a 3-T Siemens Trio MRI system (Erlangen, Germany) using body and spine array coils. Contours were manually drawn over tumors as delineated on T2-weighted, T1-weighted or contrast enhanced image. Intermediate analysis was carried out for DWI-MRI data by pixelwise calculation of apparent diffusion coefficient (ADC) values. To account for heterogeneity of the lesions not only mean ADC values were calculated, but the values of individual pixel were plotted in histograms and the variance were calculated. Corresponding position were shown by ADC overlay plots on the anatomical MRI. Classification of patients was done according to their pathological response.
Results
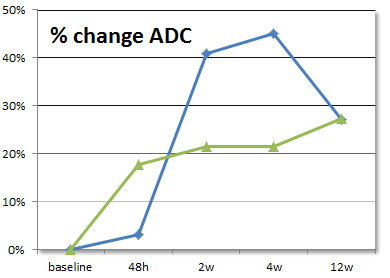
The non-responder group showed no up to moderate increase of ADC values. A significant increase of mean ADC values at the course of treatment was seen in the responder group (Figure 3). ADC histograms showed correspondingly a shift of the ADC value distribution towards higher values during therapy as well as a broadening at week 2 and 4. This is displayed in Figure 1 and 2.Discussion
In this intermediate analysis DWI-MRI data of patients with rectal cancer were analyzed. Since neoadjuvant radio-chemotherapy will change tumor microcirculation changes which will influence the outcome of DWI-MRI as well as DCE-MRI. For DWI-MRI in general this was shown earlier [4], to which our results regarding the increased percentage changes of ADC values in responders are in line. Colored parameter maps as in Figure 1 additionally give an impression on the individual structure of the lesion. Histogram characteristics reflect the individual changes which might not expressed by a single number like the mean ADC value.Conclusion
Histogram analysis of ADC values has predictive potential for pathological response after neoadjuvant radio-chemotherapy. Combining histogram metrics with the results of DCE-MRI data may increase the predictive value further. To confirm this hypothesis the final analysis of the study including all patients will help.Acknowledgements
This study was supported by the ‘Deutsche Krebshilfe’; Funding code 110724.References
1. Allalx ME et al., Ann Surg On col 2013;20:2921-2928.
2. Schepkin VD et al. Magn Reson Imaging. 2006 April ; 24(3): 273–278.
3. Cui Y et al. Proc. Intl. Soc. Mag. Reson. Med. 25 (2017) #3410.
4. Barbaro, B. et al. Int. J of Rad. Oncology*Biology*Physics 2012 June; 83, 594–599.
Figures