3825
Diffusion weighted MRI simplifies therapy monitoring in TRAMP mice1Department of Circulation and Medical Imaging, Norwegian University of Science and Technology, Trondheim, Norway, 2Department of Cancer Research and Molecular Medicine, Norwegian University of Science and Technology, Trondheim, Norway, 3Clinic of Surgery, St. Olavs Hospital, Trondheim, Norway, 4Department of Neuroimaging, King's College London, London, United Kingdom, 5Department of Radiology, Department of Radiology, Trondheim, Norway, 6Department of Laboratory Medicine, Women’s and Children’s Health, Norwegian University of Science and Technology, Trondheim, Norway
Synopsis
Transgenic mouse models of prostate cancer have advantages over xenograft tumor models as the cancer arises spontaneously and can be studied in immunocompetent mice, thus being highly biologically relevant. However, in vivo monitoring of cancer progression and treatment response is challenging and most studies rely on prostate volume measurements. Here we show that diffusion weighted imaging is a helpful tool for assessing response to chemotherapy in transgenic adenocarcinoma of the mouse prostate (TRAMP) mice.
INTRODUCTION
Transgenic mouse models of prostate cancer have advantages over xenograft tumor models as the cancer arises spontaneously and can be studied in immunocompetent mice, thus being more biologically relevant. In vivo assessment of treatment response is more complicated in these tumor models, however, as they often present as prostatic intraepithelial neoplasia (PIN) or well differentiated cancer, which is difficult to distinguish from non-cancerous prostate using imaging modalities like MRI or ultrasound. In vivo treatment response assessment in Transgenic Adenocarcinoma of the Mouse Prostate (TRAMP) mice has previously been performed based on prostate volume measurements with MRI1,2 and DCE-MRI2. However, poor image contrast between prostate and seminal vesicles can make volume computation challenging1,3 and DCE-MRI may be limited to drugs that target angiogenesis. Diffusion-weighted imaging (DWI) has been shown to be sensitive to treatment induced cellular changes4. The aim of this study was to test whether DWI can aid in the assessment of treatment response to chemotherapy in TRAMP mice.METHODS
TRAMP mice were recruited to the study at an age of 25-28 weeks and randomly assigned to two treatment groups: (i) vehicle (0.14% (V/V) ethanol in PBS, n=7) or (ii) docetaxel (3mg/kg, one dose, n=7). The mice were imaged using MRI on days 0, 7, 21 and 28 and treatment was given intraperitoneally after imaging on day 0. MRI was performed on a 7T Bruker Biospec with an 86mm volume resonator for RF transmission and a quadrature mouse heart surface coil for reception. T2w images were acquired using a RARE spin-echo sequence: TEeff=36ms, TR=5500ms, RARE-factor=8, averages=10, matrix size= 256x192, slice thickness=0.33mm, in plane resolution=0.1x0.1mm2. ROIs of the prostate (ventral, lateral and dorsal lobes) were drawn manually on the T2w images using OsiriX (Pixmeo SARL, Switzerland) (Figure 1) from which total prostate volumes were calculated. DWI was performed using a multi-shot EPI sequence: TE=28.5ms, TR=3000ms, averages=4, matrix size=128x128, slice thickness=0.99mm, in plane resolution 0.2x0.2mm2, and b-values=0, 100, 200, 400, 800 s/mm2 along three orthogonal gradient orientations. Maps of the apparent diffusion coefficient (ADC) were calculated for the whole prostate in MatLab (MathWorks, Natick, MA) using a mono-exponential fit. Statistical differences between treated and control groups were assessed using an independent sample two-tailed t-test (p<0.05). Upon sacrifice, the GU tract (prostate, seminal vesicles, bladder) was formalin-fixed for assessing cell proliferation using Ki-67 staining.RESULTS
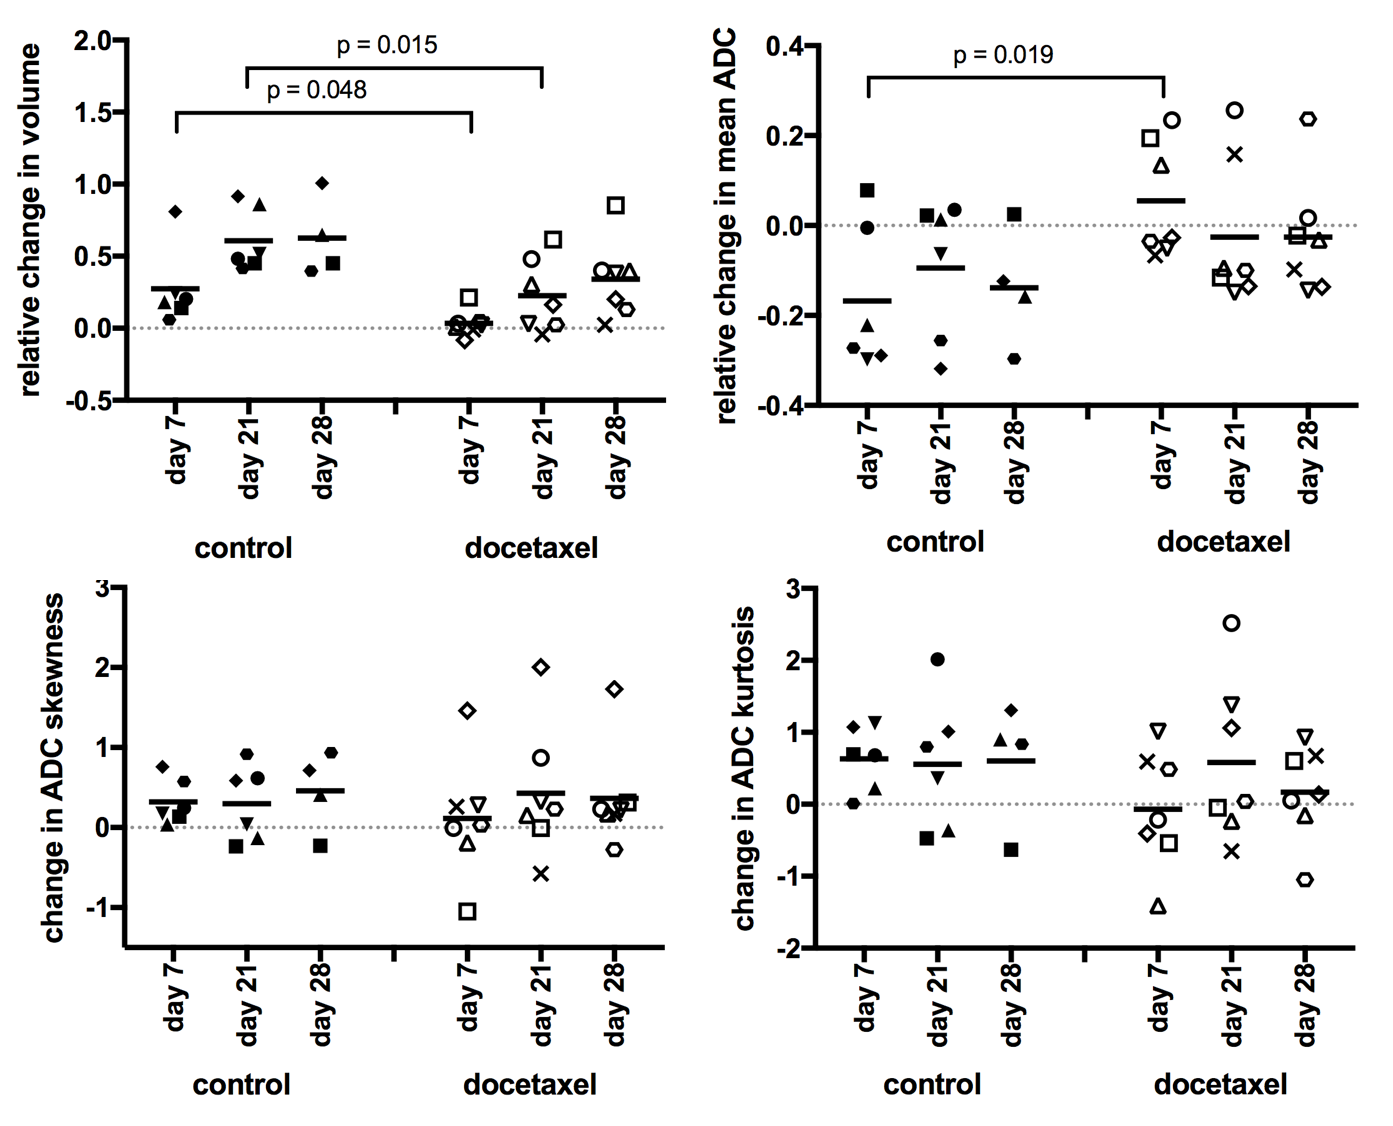
For control mice, prostates grew continuously over time, mean ADC values decreased initially, and ADC skewness and kurtosis increased initially (Figures 2,3). In the treated mice, response to docetaxel can be described in three phases:
i) Response phase (day 0 to 7): Prostate growth stagnated and ADC parameters were on average unchanged, resulting in a significant difference in ADC change between control and treated tumors (Figure 2). Some mice showed an increase in ADC as illustrated by the histogram in Figure 3.
ii) Regrowth phase (day 7 to 21): Prostates started growing again, mean ADC decreased and ADC skewness began to increase. Only the relative prostate volumes to day 0 remained significantly reduced compared to the control group (Figure 2).
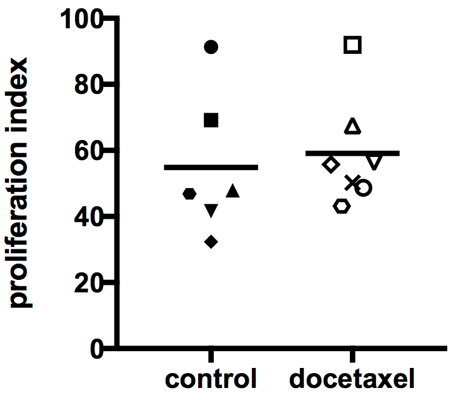
iii) Normalized phase (day 21 to day 28): Volume and ADC data indicated that no treatment effect was measurable by day 28. Histology did not reveal differences in cell proliferation between treated and control tumors at day 28 after treatment (Figure 4).
DISCUSSION
DWI has previously been used to monitor cancer progression in TRAMP mice3. Here, we showed that it can also be useful for therapy monitoring in TRAMP mice. The irregular shape of the mouse prostate, as well as difficulties in distinguishing prostate from seminal vesicle make prostate volume ROIs both difficult to draw reproducibly and dependent on the operator. DWI has superior image contrast between seminal vesicles and prostate than T2w images. Delineation of the tissues and therefore drawing of ROIs is easier and may be less operator dependent for DWI. In addition, acquisition and analysis of DW data is relatively fast, while accurate definition of prostate ROIs for volume measurements can be time-consuming.CONCLUSION AND FUTURE PERSPECTIVES
DWI is a helpful tool for assessing response to chemotherapy in TRAMP mice. We will further investigate if the same results can be achieved by looking at just one slice of the prostate, as this could provide a reproducible, simple approach and significantly reduce time required for analysis.Acknowledgements
MRI was performed at the MR Core Facility, Norwegian University of Science and Technology (NTNU), animal care was maintained at the Comparative Medicine Core Facility (CoMed), NTNU, and histology was performed at the Cellular and Molecular Imaging Core Facility (CMIC), NTNU. CoMed , CMIC and GCF are funded by the Faculty of Medicine at NTNU and Central Norway Regional Health Authority. We thank Nils Hagen for maintenance of the TRAMP colony.References
1. Arbab AS, Shankar A, Varma NR, et al. MRI to assess chemoprevention in transgenic adenocarcinoma of mouse prostate (TRAMP). BMC Med Imaging. 2011;11:21.2. Raina K, Ravichandran K, Rajamanickam S, et al. Inositol hexaphosphate inhibits tumor growth, vascularity, and metabolism in TRAMP mice: a multiparametric magnetic resonance study. Cancer Prev Res. 2013;6(1):40-50.
3. Hill DK, Kim E, Teruel JR, et al. Diffusion-weighted MRI for early detection and characterization of prostate cancer in the transgenic adenocarcinoma of the mouse prostate model. J Magn Reson Imaging. 2016;43(5):1207-1217.
4. Thoeny HC, Ross BD. Predicting and monitoring cancer treatment response with diffusion-weighted MRI. J Magn Reson Imaging. 2010;32(1):2-16.
Figures