3824
Differentiation of Normal and Radioresistant DU145 Tumour Xenografts in Mice Using CEST MRI1Sunnybrook Research Institute, Toronto, ON, Canada, 2University of Toronto, Toronto, ON, Canada, 3Sunnybrook Health Sciences Centre, Toronto, ON, Canada, 4Medical University of Lublin, Lublin, Poland
Synopsis
The differentiation of normal and radioresistant tumour potentially allows the tailoring of cancer treatment to the patient. DU145 prostate cancer cells from normal and radioresistant cell lines were injected in mouse hind limb and allowed to grow into tumours. The tumours were imaged within 48 h before and after x-ray therapy using CEST. The magnetization transfer ratio (MTR) was compared between tumours grown from each cell line and at both time points. The MTR was significantly different at a frequency offset of –3.3 ppm at both time points. T1 and T2 values were not found to be significantly different.
Introduction
The differentiation of normal and radioresistant tumour will allow the tailoring of cancer treatment to the patient. CEST is sensitive to the concentration and exchange rate of certain chemical groups in dissolved proteins, which is a potential indicator of cell metabolism. Tumours arising from a radioresistant cell line have reduced metabolism compared to normal (parental) ones1 and, thus, are expected to have altered composition, which may be detectable by CEST.Methods
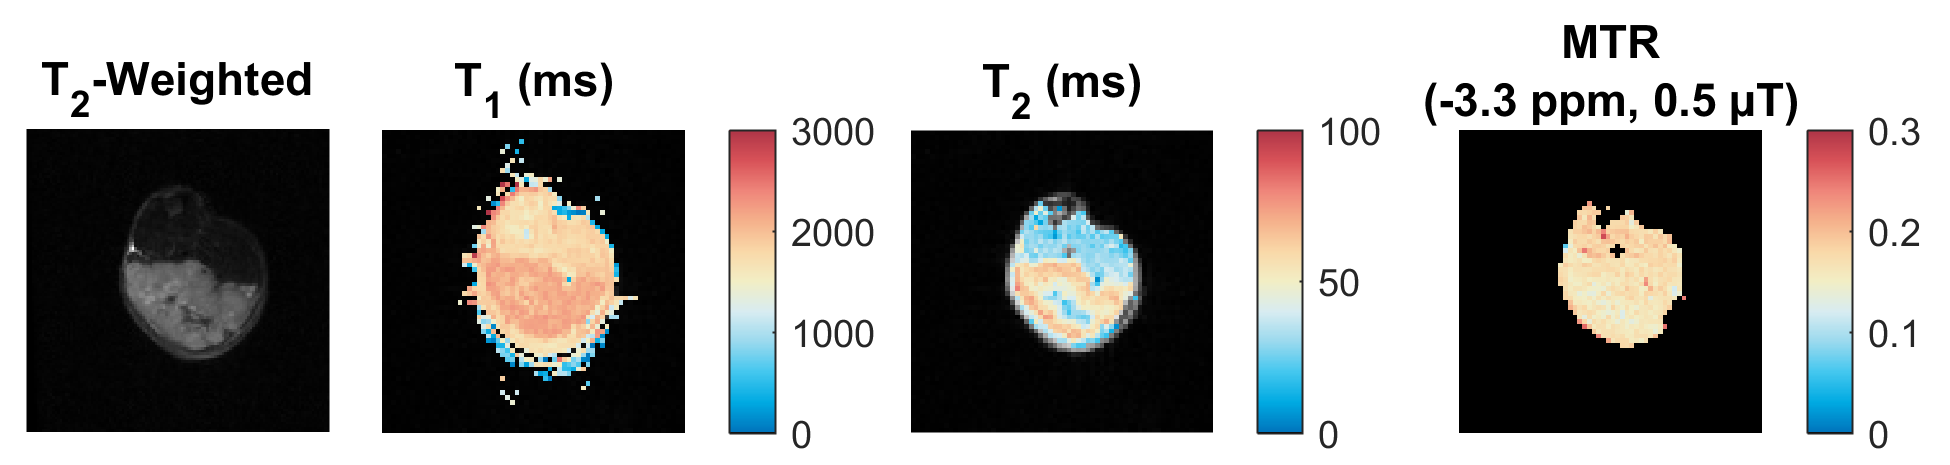
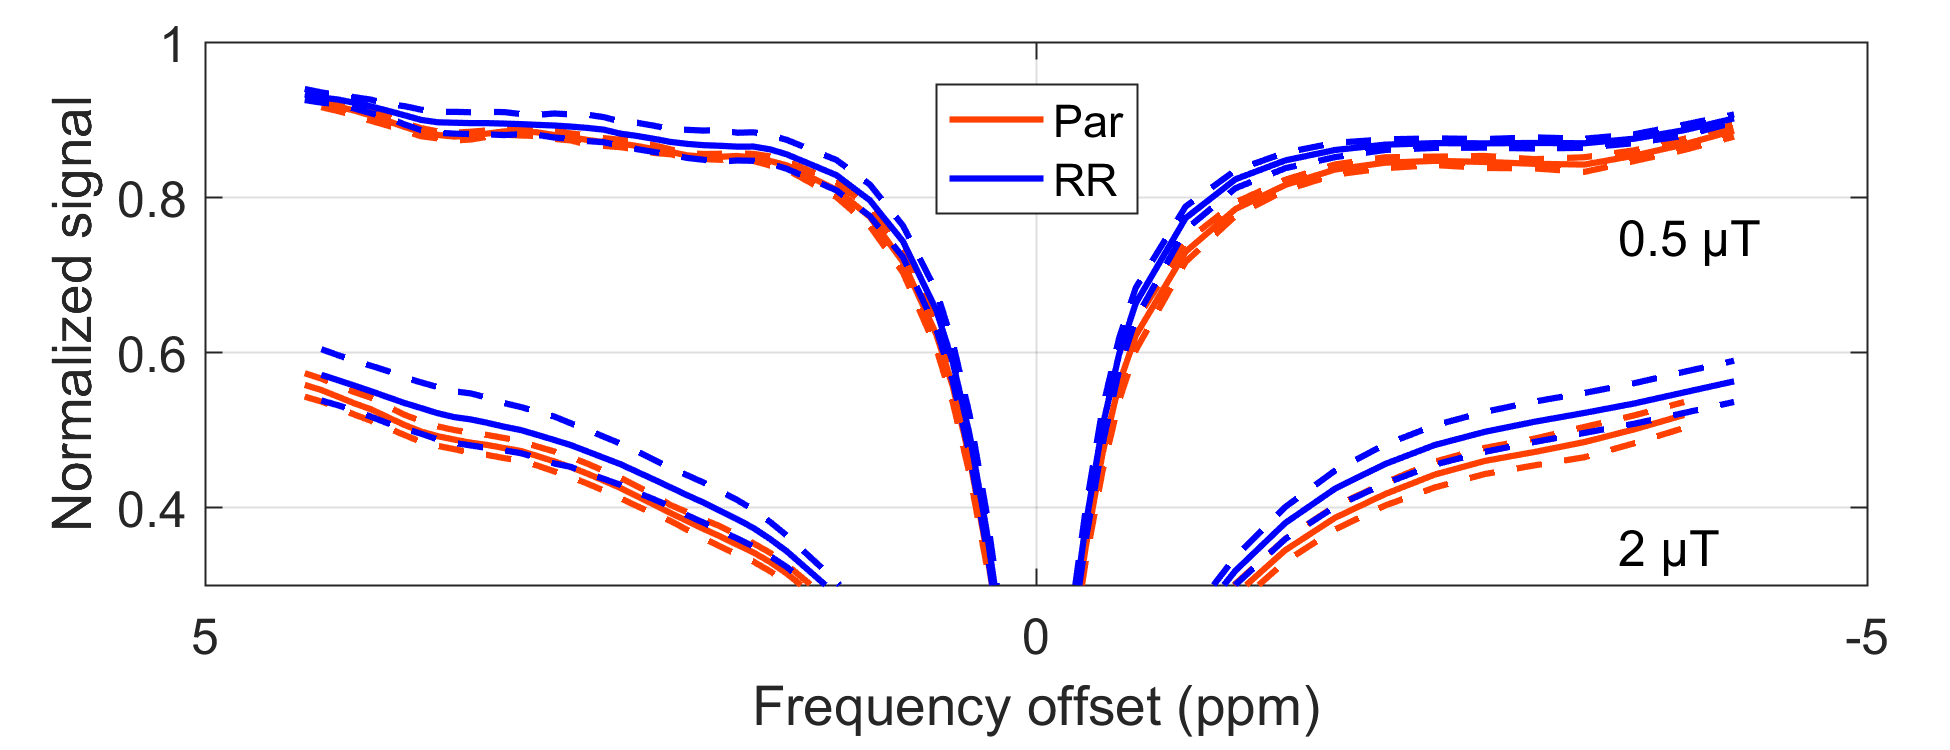
DU145 prostate cancer cells from parental (Par) and radioresistant (RR) cell lines were injected in the right hind limbs of mice and allowed to grow into tumours (nPar = 8, nRR = 8) . All tumours were scanned at 7 T (BioSpec 70/30 USR, Bruker BioSpin, Billerica, MA). Z-spectra composed of single slice images were acquired using magnetization transfer-prepared (block saturation pulse; saturation time per k-space line = 490 ms) FLASH (TR = 500 ms, TE = 3 ms, FA = 30°, FOV = 20 mm × 20 mm × 1 mm, matrix = 64 × 64). WASSR2 spectra at saturation B1 = 0.1 μT were acquired between ±0.5 ppm and CEST-sensitive spectra at B1 = 0.5 and 2 µT, between ±5 ppm. A T1 map was calculated from inversion recovery RARE scans (TR = 10,000 ms and TI = 30, 110, 390, 1400, 5000 ms). A T2 map was calculated from the T1 map and WASSR spectra. Tumour voxels were defined as those with T1 < 2000 ms (to exclude pooled blood) and T2 ≥ 45 ms (to exclude muscle) selected for analysis. Rician noise bias and B0 correction was applied to the tumour ROIs and the mean magnetization transfer ratio (MTR, i.e., 1 – normalized Z-spectrum signal) across an ROI was calculated. MTR between parental and radioresistant tumours were compared using a t-test. All analysis was performed in MATLAB (The MathWorks, Natick, MA).Results
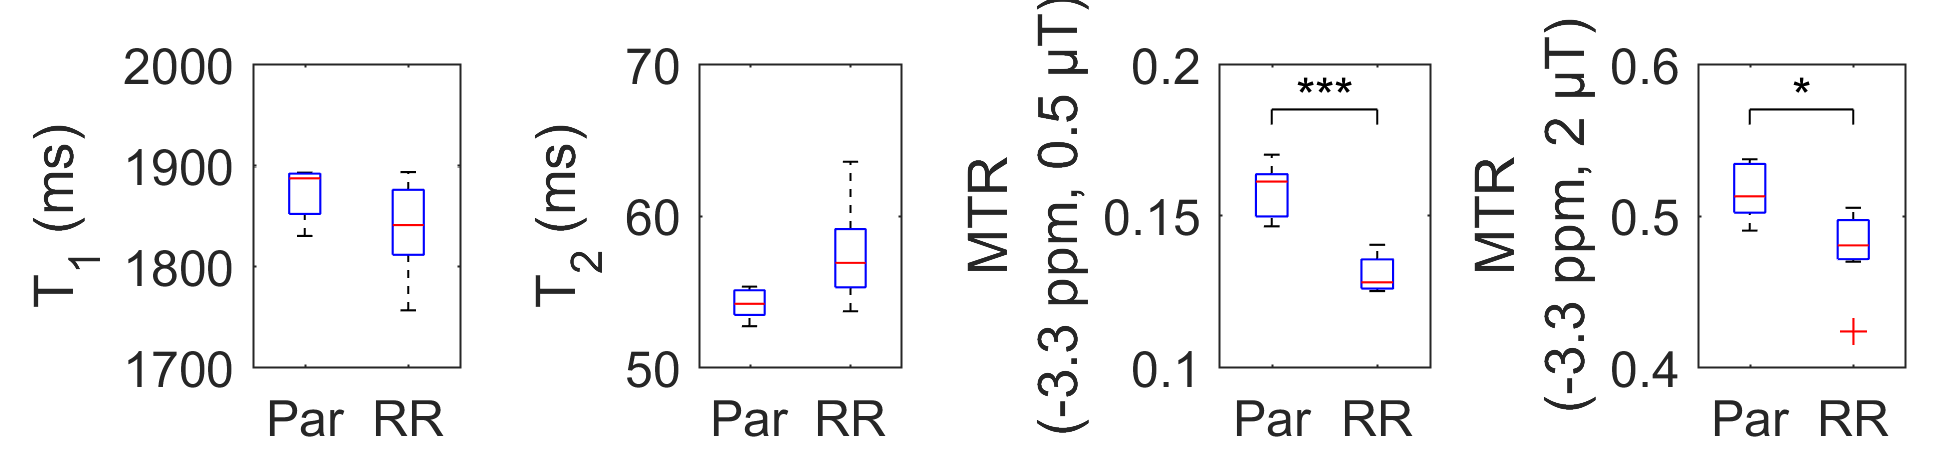
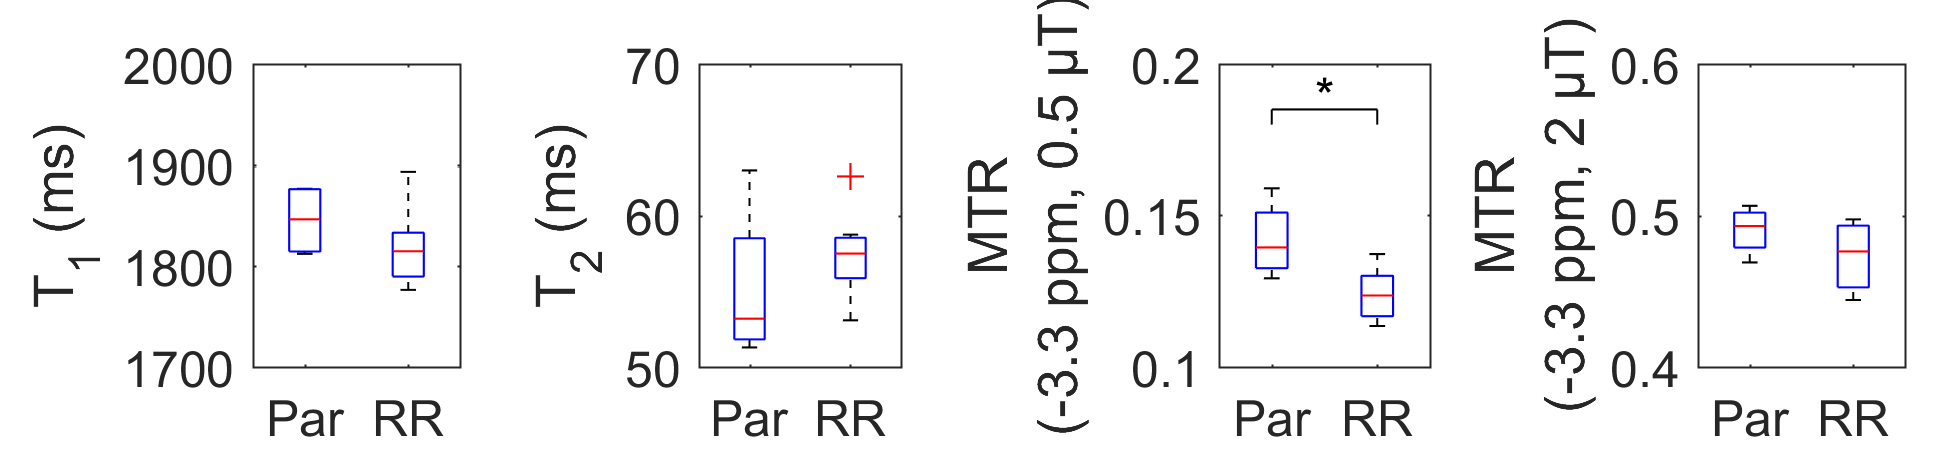
The high-resolution T2-weighted scan shows dark muscle and bright tumour (Fig. 1). Within the tumour, there are brighter areas, which our criteria classify as tumour and darker areas as blood pools. Three mice from the RR group were outliers and excluded from the analysis; their MTRs were much lower (i.e., normalized signal much higher) then both Par and the remaining RR mice. Statistical comparison of MTR between Par and RR groups showed significant differences at a frequency offset of –3.3 ppm at both time points, but T1 and T2 values were found to be not significantly different (Fig. 3 and 4). MTR at frequency offsets of 3.5 and 2.0 ppm were also compared and found to have some differences in the pre-treatment group (not shown). The voxels attributed to blood pools (with T1 > 2000 ms) had no difference in Z-spectra between tumour types (also not shown).Discussion
The MTR difference (at –3.3 ppm and B1 = 0.5 µT) is hypothesized to arise from a change in aliphatic protons, which participate in the relayed nuclear Overhauser effect, and/or the magnetization transfer (MT) contrast from semisolid macromolecules. Fitting to the Bloch-McConnell equations (which model exchanging magnetization between water, CEST, and semisolid MT pools), which will be done in future work, should elucidate this. Histological analysis will hopefully reveal the composition of the three outliers in the Parental cell line tumour group for better tissue segmentation.Conclusion
The MTR at –3.3 ppm and B1 = 0.5 µT is significantly different between parental and radioresistant DU145 prostate tumour xenografts, and are driven neither by water T1 nor T2 effects.Acknowledgements
The authors thank Margaret Koletar for technical assistance and the Terry Fox Research Institute (project number 1034) and Prostate Cancer Canada (Movember Discovery Grant) for financial support.References
1. Fotouhi Ghiam A, Taeb S, Huang X, et al. Long non-coding RNA urothelial carcinoma associated 1 (UCA1) mediates radiation response in prostate cancer. Oncotarget. 2017;8(3):4668-4689.
2. Kim M, Gillen J, Landman B, et al. Water saturation shift referencing (WASSR) for chemical exchange saturation transfer (CEST) experiments. Magn Reson Med. 2009;61(6):1441-1450.
Figures