3823
High b value (2000 s/mm2) Diffusion-weighted Imaging in Prostate Cancer Detection: Comparison between Zoomed Field of View (iZOOM) with a Two Dimensional Radiofrequency Pulse (2D-RF) Echo Planar Imaging (EPI) Sequence and Conventional ss-EPI DWI at 3.0 T1Department of Radiology, Peking University First Hospital, Beijing, China, 2Integrated solution center, Philips (China) Investment Co., Ltd, Shanghai, China
Synopsis
This study aims to evaluate diagnostic efficacy of high b value (2000s/mm2) zoomed field of view (iZOOM) with a 2D-RF EPI sequence, compared with conventional ss-EPI (CONV) diffusion-weighted imaging (DWI) for peripheral zone (PZ) prostate cancer (PCa) detection at 3.0 T. Prostate Imaging Reporting and Data System version 2 (PI-RADS v2) were used as evaluation tool and the TRUS-guided systematic plus targeted biopsies was considered as reference standard. It demonstrated iZOOM could provide excellent visual conspicuity as well as a better diagnostic performance compared with CONV DWI in PZ, especially in the small lesions and the lesions abutting the capsule.
Introduction
DWI is a dominant sequence of mpMRI for prostate cancer (PCa) evaluation. But sometimes it suffers geometry distortion and artifacts which would affect the imaging quality and diagnostic performance, especially at 3.0 T. The zoomed field of view (iZOOM) DWI is one of the techniques that designed to solve the problem and the clinical feasibility with high b value has been confirmed preliminarily.
Purpose
To compare iZOOM DWI to conventional DWI (CONV) for prostate magnetic resonance imaging in terms of PCa detection/conspicuity and diagnostic efficacy combined with high b value (2000 s/mm2).
Methods
Patients: Approved by IRB, 57 consecutive patients (median age, 65; range, 31-84 years; median PSA, 9.25; range, 0.52-27 ng/ml) underwent both iZOOM and CONV DWI due to clinical suspicious of PCa. Finally, 26 patients with pathologically proven PCa were enrolled in this study.
MRI protocol: All images were acquired using a 3.0 T MR imager (Philips Achieva TX, the Netherlands) with a 32-channel cardiac coil. MR examinations were done including a combination of two functional MRI techniques (Axial DWI with high b value of 2000 s/mm2 and dynamic contrast enhanced (DCE) imaging). Axial, coronal, and sagittal T2-weighted imaging were also performed but not assessed as part of this study.
Tumor detection/conspicuity analysis: Two radiologists reviewed all images separately. In the cranio-caudal direction, the prostate PZ was divided into six regions, (i.e., base, midgland and apex bilaterally). Totally 156 regions of 26 enrolled patients were analyzed. Tumor detection/conspicuity was rated on a five-point scale based on the different signal intensity (SI) between lesions and surrounding healthy prostate tissues (scale 1-5, where 1 represents maximal visual conspicuity).
Diagnostic efficacy analysis: With the aim of region-specific comparison among the two DWI sequences, another two experienced radiologists reviewed all tested prostate gland images and scored on a five point scale using PI-RADS v2 in consensus. Lesions with scores of PIRADS 1-3 would point to benign, while greater than PIRADS 3 scores were regarded as the malignant ones. Reference standard: It was judged by TRUS-guided systematic plus targeted biopsies (12-33 needle cores), which were performed within 3 months after MRI examination. Regions were be considered as PCa if a positive biopsy exists, otherwise would be regarded as no PCa (biopsy negative). For PCa, the regions were further classified as clinically significant cancer (CS PCa, i.e., Gleason score≥7, including 3+4 and 4+3) and non clinically significant cancer (NCS PCa, i.e., Gleason scores<7). Alignment of the DWI data and pathologic evaluation were determined in consultation between an experienced urologist and another radiologist.
Statistical analysis: The statistical analyses were performed using statistical software (SPSS 18.0 and MedCalc 15.8). The paired Wilcoxon signed rank test (alpha=0.05) was used for lesion conspicuity evaluation. Corroboration of readers was achieved by kappa coefficient. Spearman’s rank correlation tests were used to describe the direction of association between PIRADS score and biopsy finding of PCa and CS PCa. Receiver operating characteristic (ROC) curves were used to assess the diagnostic efficiency of the two DWI sequences. Sensitivity, specificity and area under curve (AUC) with 95% confidence intervals (CIs) were calculated for diagnostic accuracy.
Results
Table 1 summarized the tumor detection/conspicuity for the two DWI sequences. Inter-reader agreement: the kappa values were substantial based on the tumor conspicuity scores between reader 1 and reader 2 (CONV DWI 0.75; iZOOM DWI 0.79). iZOOM DWI showed a higher sensitivity for detection of tumor lesions (PCa: 36/43 vs. 23/43, P=0.001; CS PCa: 34/40 vs. 23/40, P=0.003), while no significant difference occurred between the iZOOM and CONV DWI sequences (PCa: 109/113 vs. 111/113, P=0.480; CS PCa: 110/116 vs. 114/116, P=0.134). The iZOOM demonstrated better diagnostic efficacy with higher AUCs than CONV DWI (PCa: 0.93 vs. 0.81, P=0.004; CS PCa: 0.93 vs. 0.84, P=0.018) (Figure 1). And, more remarkable, despite the 80.77% (126/156) regions assigned the same PIRADS scores between the sequences, among the rest 19.23% (30/156) regions, 16 regions (14 CS PCa, 2 NCS PCa) showed upgrade of PIRADS 1-4 (CONV) to 4-5 (iZOOM), whereas 3 regions (no PCa) showed downgrade of PIRADS 2-3 (CONV) to 1 (iZOOM)(Table 2). The detailed location of lesions and reasons for the difference in gradation were ascertained and listed in Table 3. Discussion-conclusions: This study demonstrated iZOOM DWI could not only offer improved image quality of PCa as previous research confirmed,2,3 but also provide excellent visual conspicuity and a better diagnostic performance compared with CONV DWI sequence in PZ, especially in the small lesions and the lesions abutting the capsule.
Acknowledgements
No acknowledgement found.References
1. Weinreb JC, Barentsz JO, Choyke PL et al (2016) PI-RADS Prostate Imaging - Reporting and Data System: 2015, Version 2. Eur Urol 69:16-40.
2. Korn N, Kurhanewicz J, Banerjee S, et al. Reduced-FOV excitation decreases susceptibility artifact indiffusion-weighted MRI with endorectal coil for prostate cancer detection. Magn Reson Imaging. 2015;33(1):56-62.
3. Finsterbusch J. Improving the performance of diffusion-weighted inner field-of-view echo-planarimaging based on 2D-selective radiofrequency excitations by tilting the excitation plane. JMRI. 2012; 35(4):984-992.
Figures
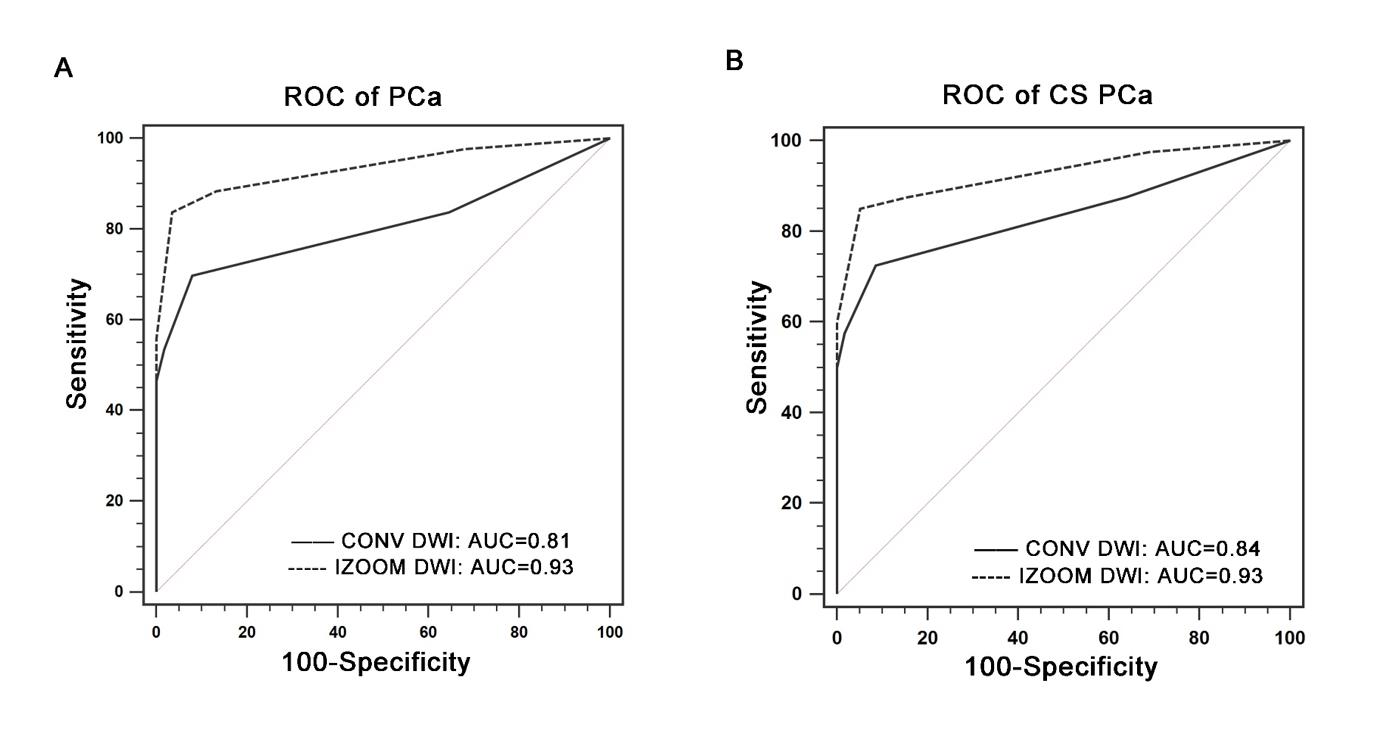
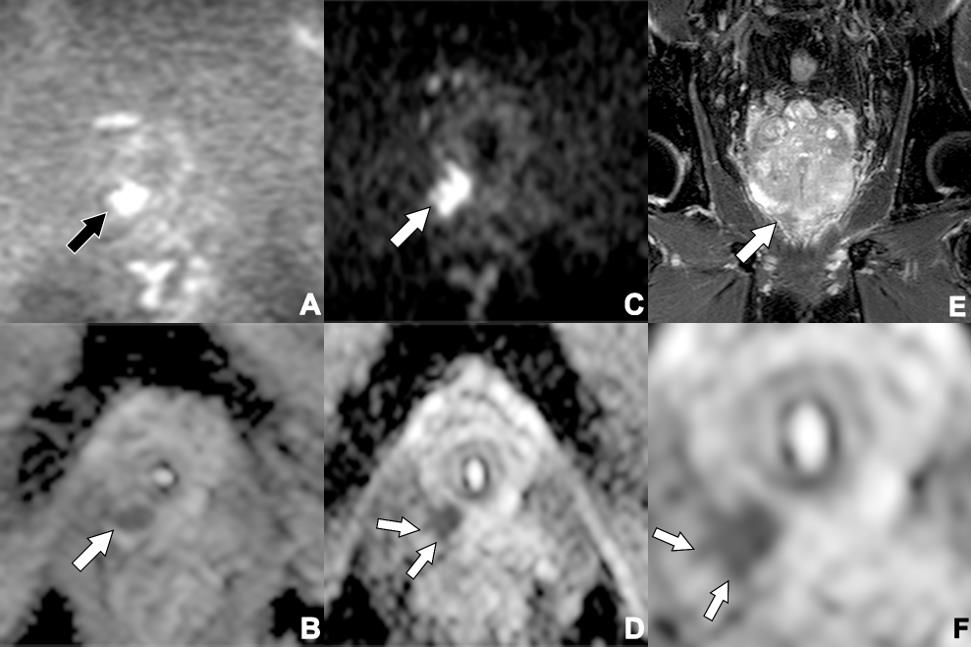

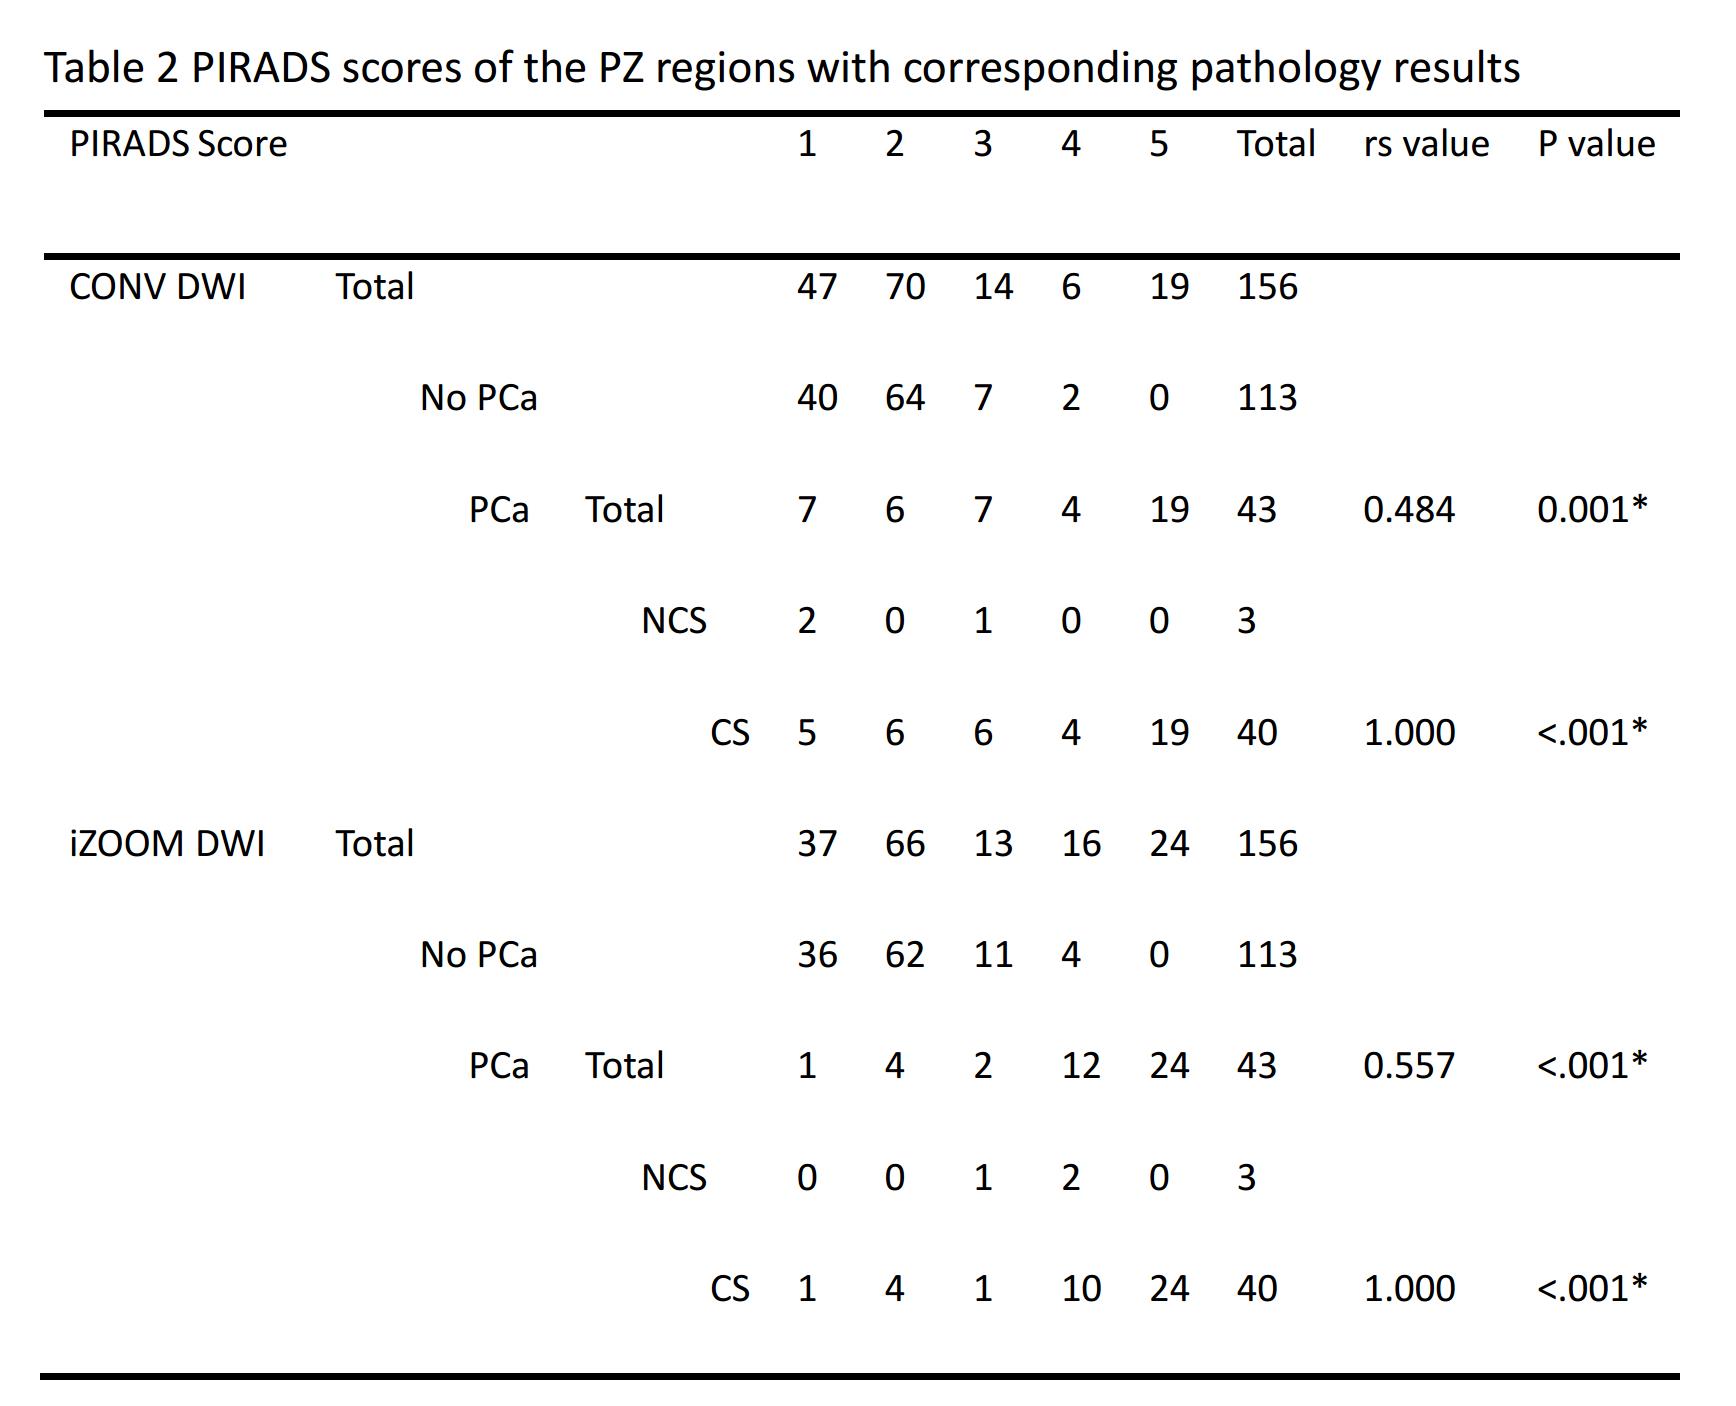
Table 2: PIRADS scores of the PZ regions with corresponding pathology results
CS = clinically significant prostate cancer, NCS = no clinically significant prostate cancer. There was significant correlation between PIRADS scores and the presence of PCa and CS PCa (all P<.001). *=Statistically significant.
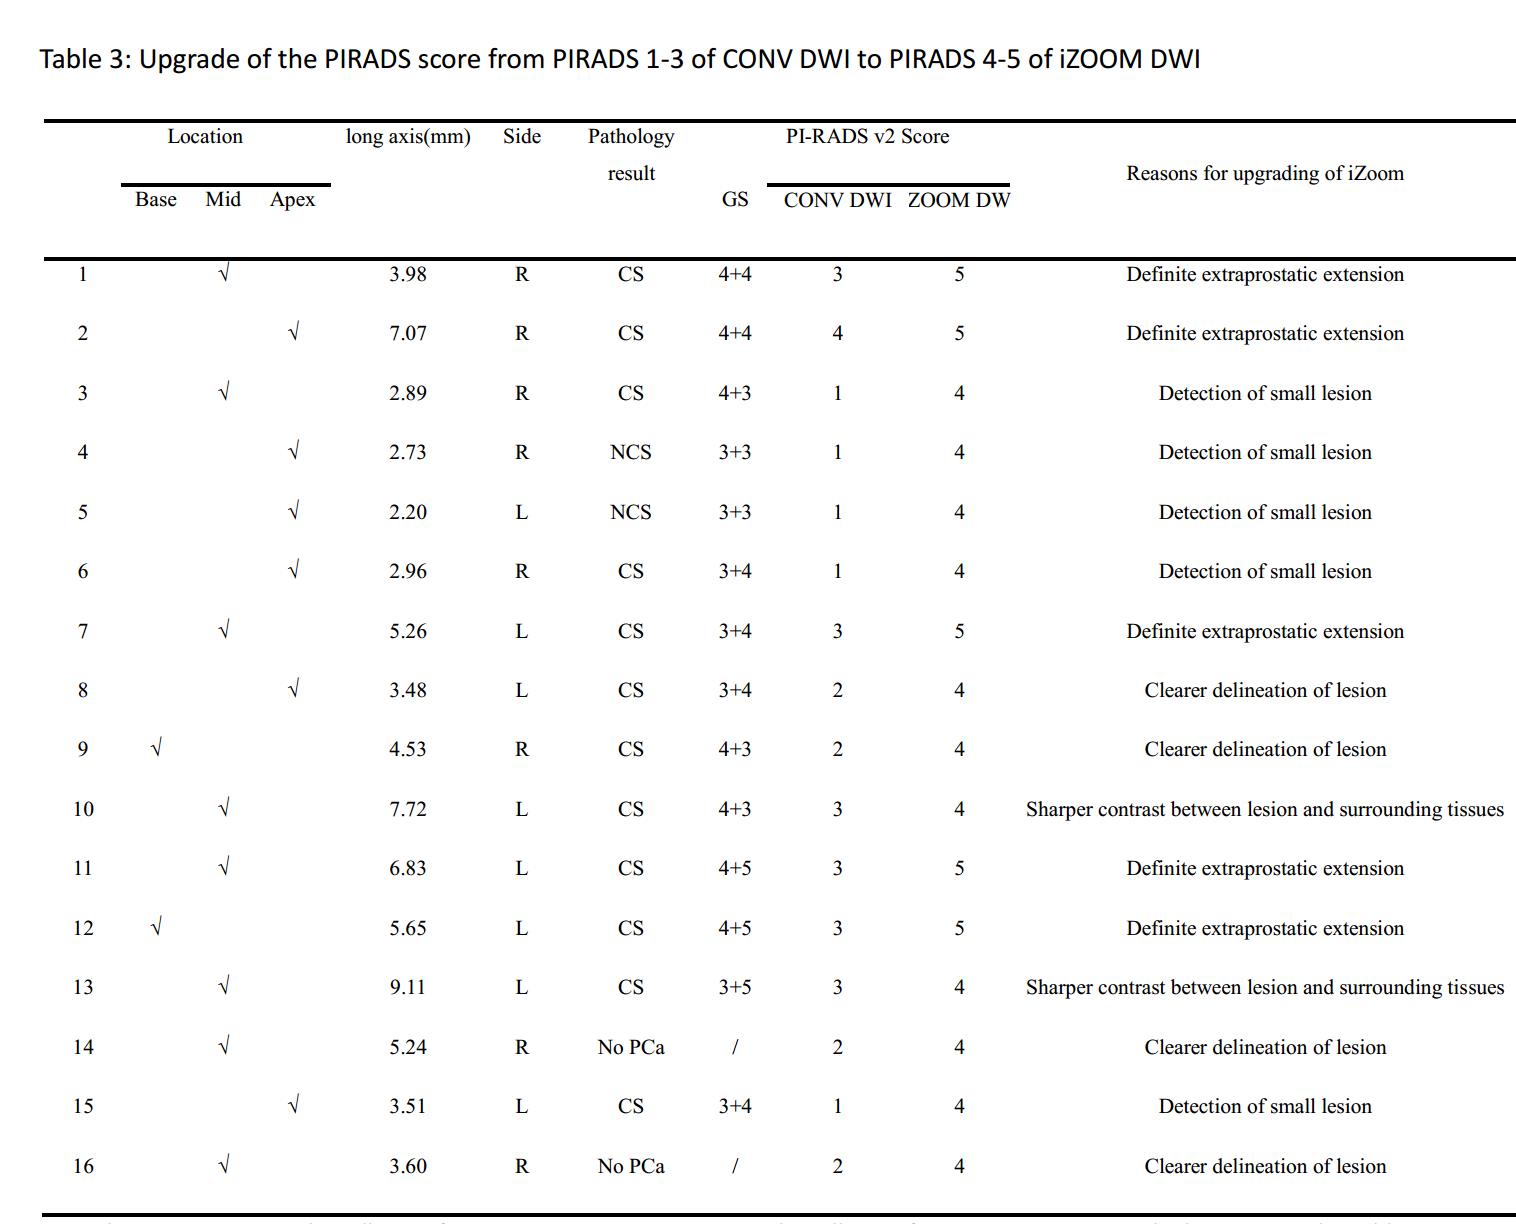
Table 3: Upgrade of the PIRADS score from PIRADS 1-3 of CONV DWI to PIRADS 4-5 of iZOOM DWI
GS = Gleason Score, CS = clinically significant prostate cancer, NCS = no clinically significant prostate cancer. The long axes in this table represented typical slice which showed the best difference between the CONV DWI and iZOOM DWI, and the actual greatest dimension of lesion might be measured in other layers.