3822
The effect of flow suppression on BOLD MRI of lung tumor1Radiology, UT Southwestern Medical Center, Dallas, TX, United States, 2Hamon Center for Therapeutic Oncology Research, UT Southwestern Medical Center, Dallas, TX, United States, 3Radiation Oncology, UT Southwestern Medical Center, Dallas, TX, United States, 4Clinical Science, UT Southwestern Medical Center, Dallas, TX, United States, 5Pathology, UT Southwestern Medical Center, Dallas, TX, United States, 6Surgery, UT Southwestern Medical Center, Dallas, TX, United States
Synopsis
Blood oxygen level dependent (BOLD) MRI is used to provide information on tumor oxygenation. However, the measurements are susceptible to blood flow changes, which often occur during hyperoxic gas challenge. This study investigated the extent of flow sensitivity by comparing BOLD measurements with and without flow suppression using two orthotopic lung xenograft tumor models. Flow suppression was found to affect multiple measurements including ΔSI(%) and R2*. The range of discrepancy was smaller in R2* than the ΔSI(%). High similarity was found in spatial patterns. ROI and spatial pattern analysis showed higher sensitivity to flow in A549 tumors than H460 tumors.
Introduction
Blood oxygen level dependent (BOLD) contrast MRI based on the concentration of deoxyhemoglobin is used to provide information on tumor oxygenation. An intervention, such as hyperoxic gas challenge, is frequently used to perturb the biological system to obtain more information [1]. Such intervention, especially oxygen breathing, may also induce changes in blood flow, which is known to affect the BOLD signal [2]. The extent to which BOLD is sensitive to potential flow changes has not been quantified in lung cancer models. In this study, we compared the BOLD measurements with and without flow suppression (fs) in two orthotopic lung xenograft tumor models.Methods
H460 and A549 human lung cancer cells were surgically implanted in the right lung of nude rats (H460: n=20; A549: n=18). MRI was performed at 4.7 T. Animal body temperature and respiration were monitored and used as an external trigger with a small animal physiological monitoring system throughout the experiment [3]. BOLD MRI (multi-echo gradient echo; TR = 150 ms, ten echo times from 2 to 29 ms, flip angle = 20°) was acquired with the intervention of an oxygen breathing challenge (from air to 100% O2). Five sets of maps were acquired during air breathing and eight sets during oxygen breathing. Images were acquired in sagittal plane. BOLD was acquired with ECG triggering to reduce motion artifacts. Spatial saturation bands were placed on each side of the imaging plane for flow suppression (fs). Semi quantitative BOLD measurement, ΔSI(%) and quantitative BOLD measurements, R2*(air), R2*(O2) and ΔR2* were obtained on ROI and voxel-by-voxel basis. Discrepancy of measurements with and without fs was quantified with Bland-Altman Analysis (differences were taken as non-fs minus fs) to obtain the average discrepancy and limits of agreement.Results and Discussion
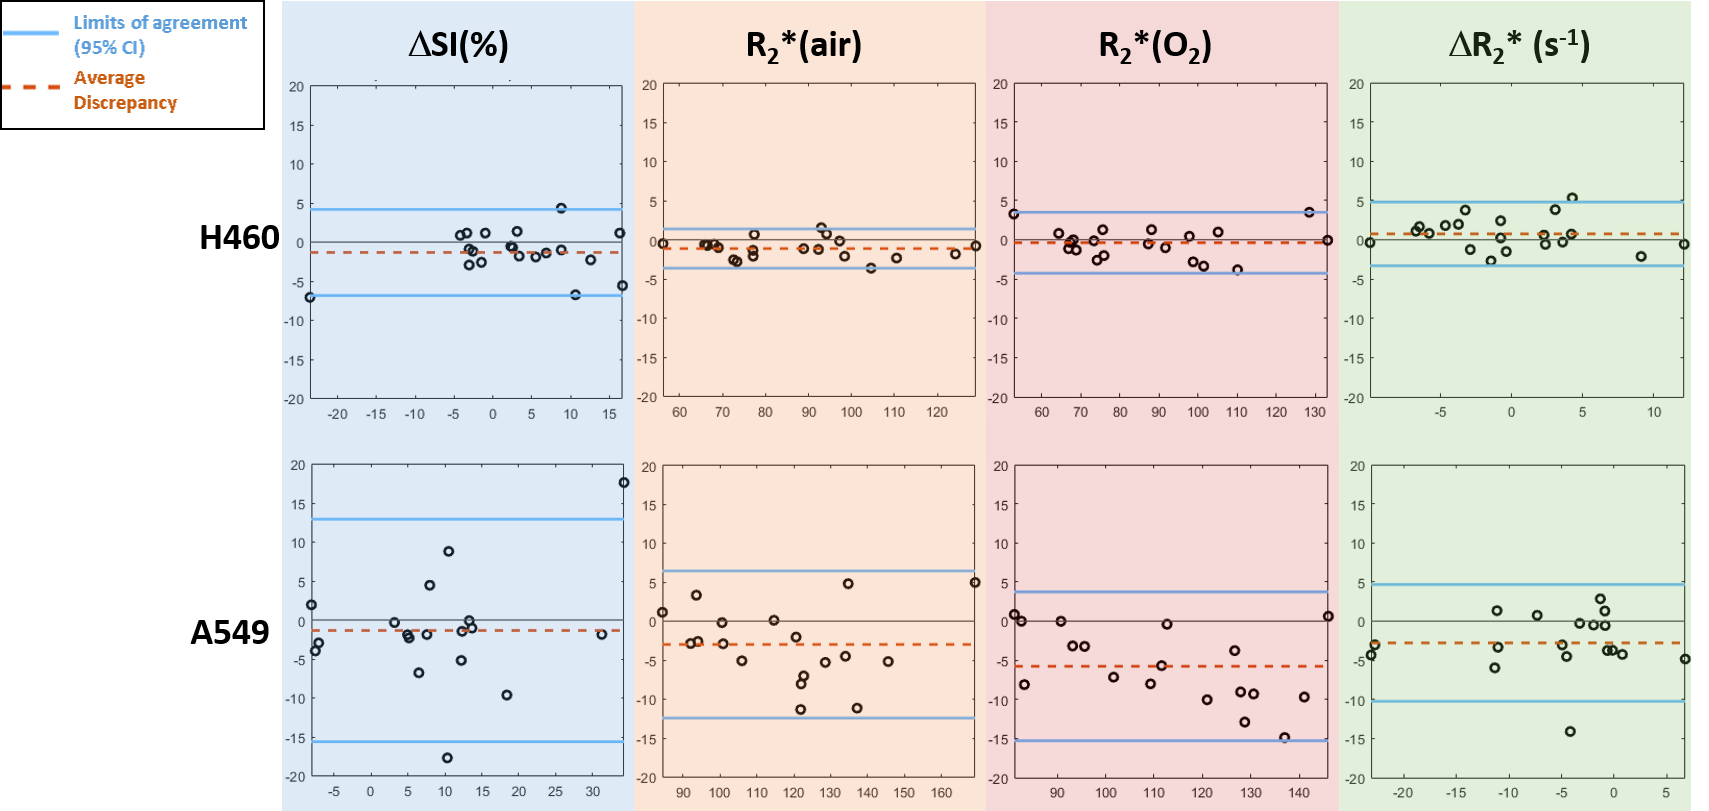
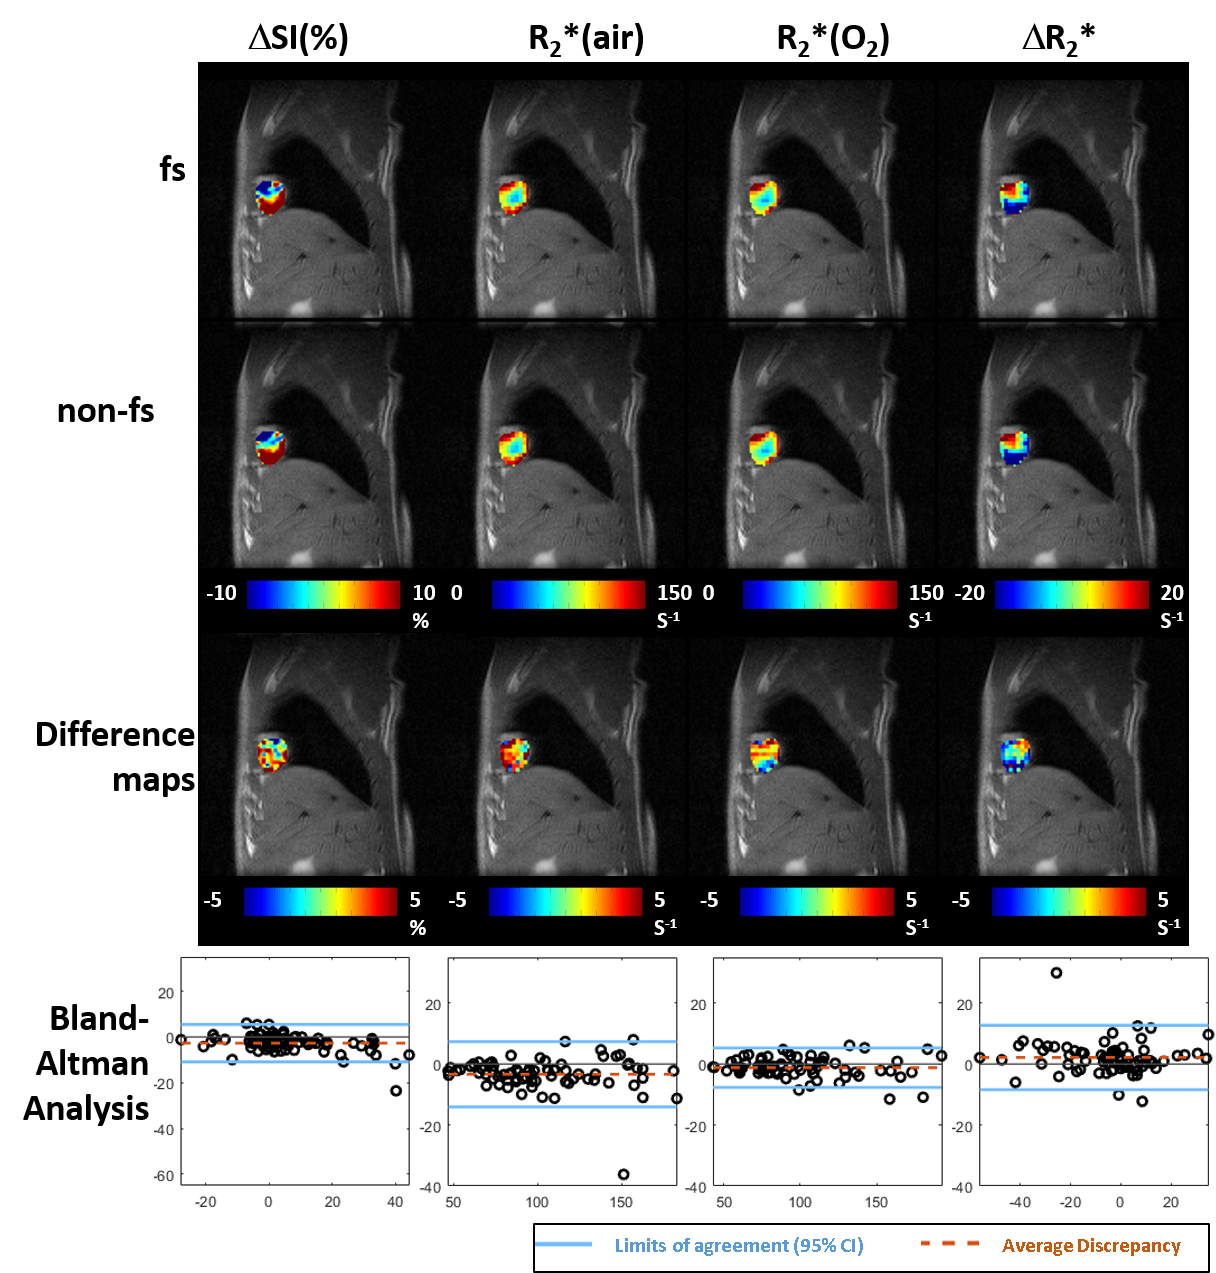
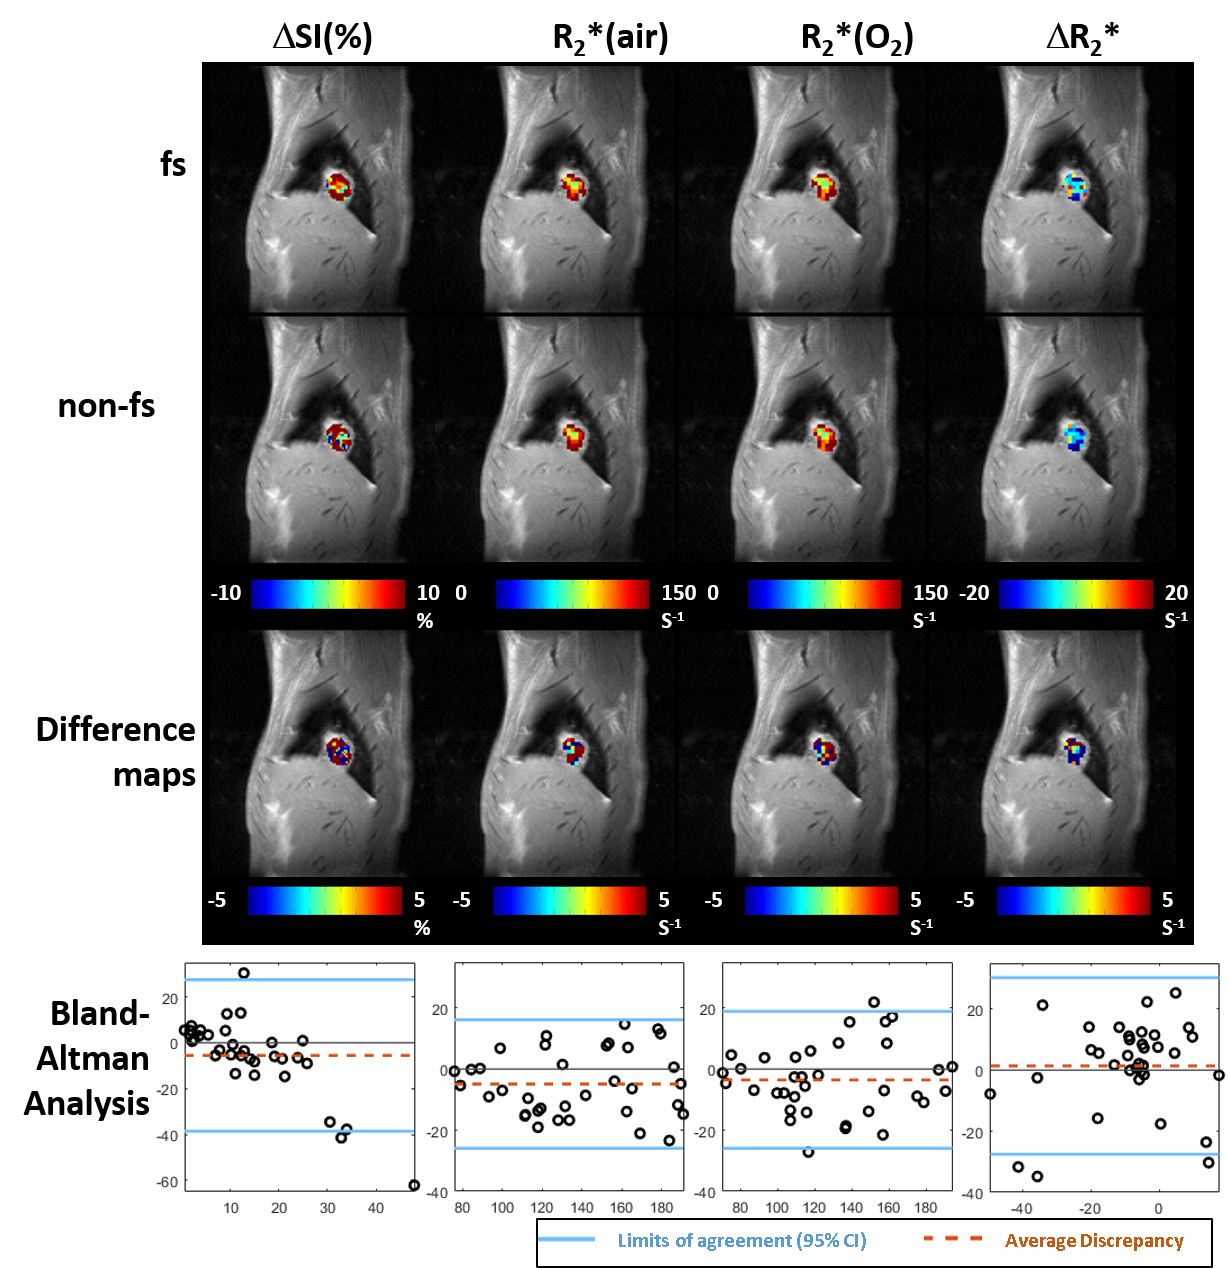
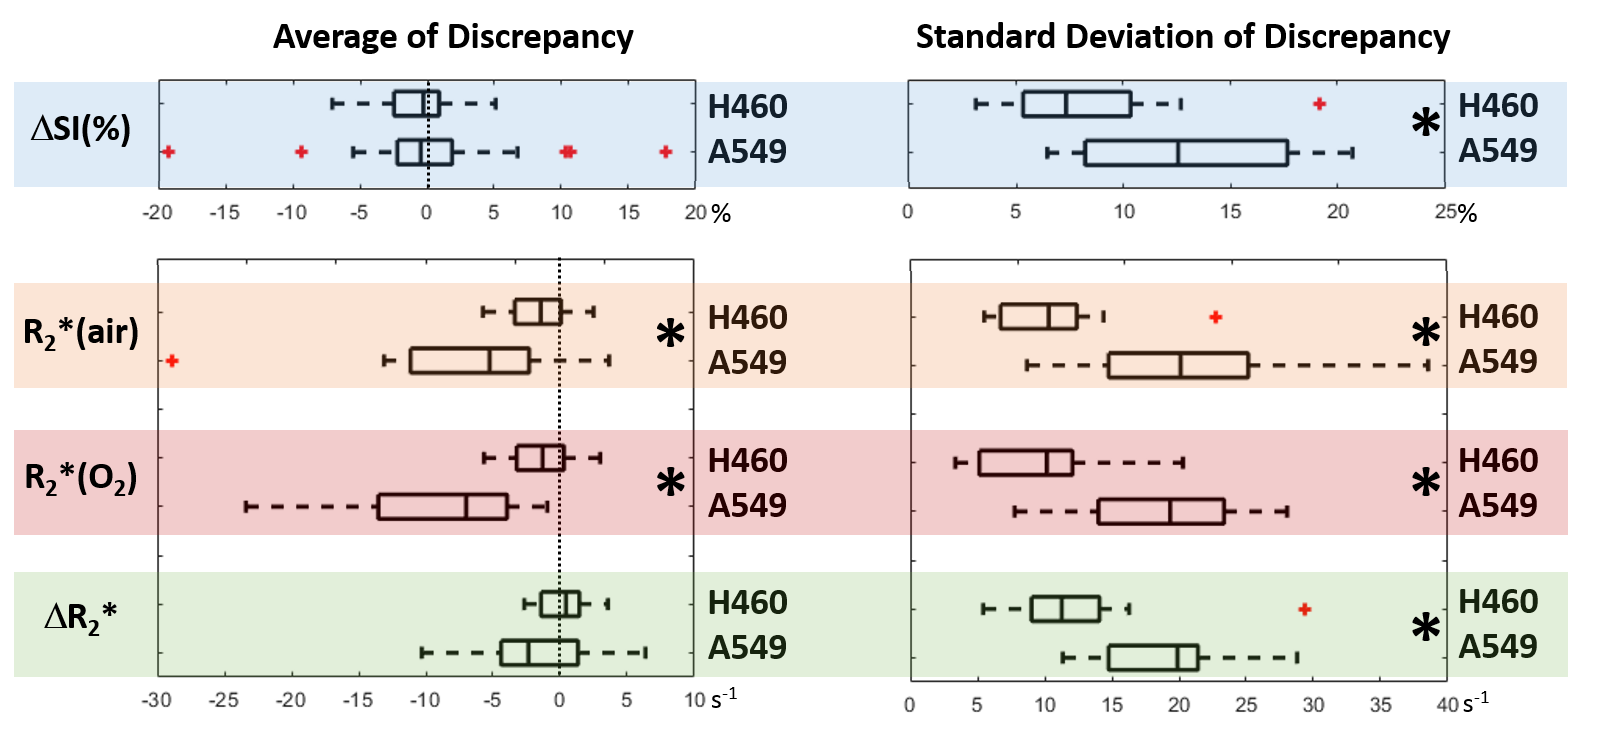
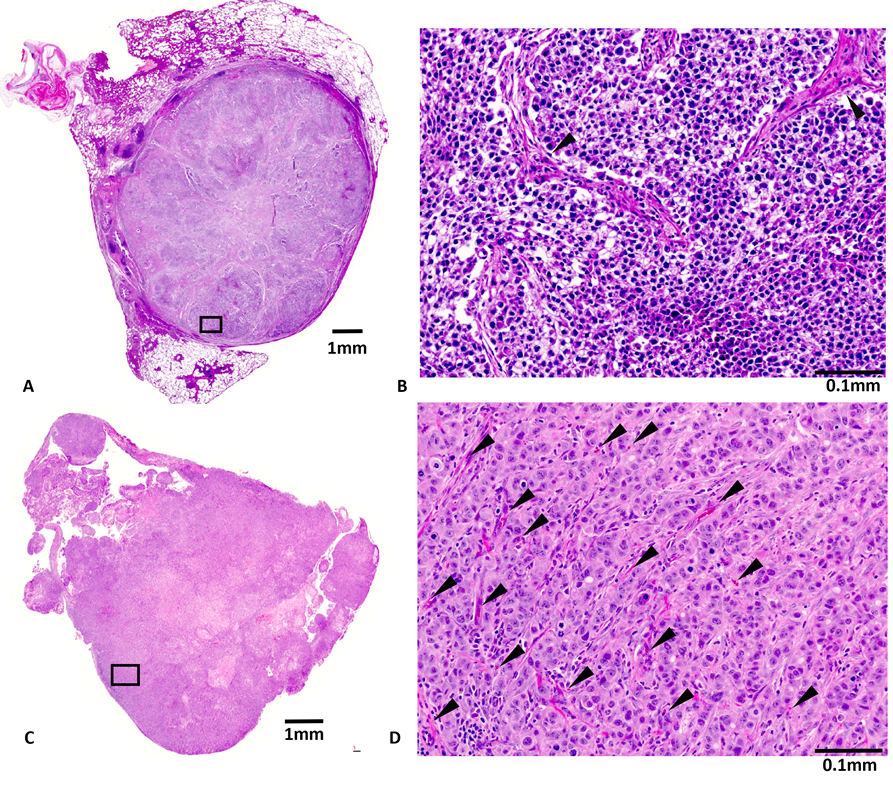
A549 tumors showed improved oxygenation in response to oxygen breathing challenge in more cases (83%) than H460 (55%), suggested by positive BOLD ΔSI (%) and negative ΔR2* (R2*(O2) - R2*(air)) regardless of the fs settings. Fs affected multiple measurements, in particular, R2* values were smaller with fs compared to without fs in both tumor types during air or oxygen breathing (p<0.05 in R2*(air) in H460, R2*(air) and R2*(O2) in A549). Figure 1 shows Bland-Altman Analyses of mean ROI values of H460 (n=20) and A549 (n=18) tumors. These results suggest that the sensitivity of BOLD measurement to flow is tumor model dependent. Specifically, average discrepancy (dotted orange line) indicates greater differences between the measurements of fs and non-fs in A549 than H460. The limits of agreement (solid blue line; defined at 95% confidence interval) were also greater in A549 than H460, suggesting a higher sensitivity to flow effects in A549 than in H460. Notably, the limits of agreement in the semi quantitative ΔSI(%) were in the range of 5 to 10% which showed a non-negligible flow-related bias comparing the measurements. On the other hand, the limits of agreement in the quantitative measurements (R2*(air), R2*(O2) and ΔR2*) were in the range of 5 s-1, which is a much smaller bias compared to the range of measurement. In addition to mean values from ROIs, voxel-by-voxel comparison of BOLD parametric maps with and without fs was also performed to quantify the discrepancy in spatial patterns in each individual tumor. Distinct intratumoral heterogeneity was observed in all parametric maps, and high similarity was found in most cases when comparing maps with and without fs, especially in quantitative R2* maps during air and oxygen breathing, as well as the ΔR2* (Figs. 2 and 3). Bland-Altman analysis revealed larger average discrepancy and wider limits of agreement in spatial patterns of A549 compared to H460 tumors (Figs. 2 and 3). The same observations were found when summarizing the Bland-Altman Analyses of spatial patterns in all H460 (n=20) and A549 (n=18) tumors (Fig. 4). Higher spatial discrepancy was found in the A549 group compared to H460 group. All four BOLD parameters showed larger average and standard deviation of discrepancy in A549 than H460 tumors. The differences were statistically significant in most comparisons (marked with *). Examination of the H&E revealed extensive avascular areas in H460 (Fig. 5 A&B), while A549 was very well vascularized (Fig. 5 C&D).Conclusion
Flow suppression affects BOLD measurements including semi quantitative ΔSI(%) and quantitative R2*. The range of discrepancy was smaller in quantitative measurements than the semi-quantitative ΔSI. High similarity was found in spatial patterns when comparing maps with and without flow-suppression. ROI and spatial pattern analysis showed higher sensitivity to flow in A549 than H460 tumors, which was in agreement with the histology results.Acknowledgements
We are grateful for the support of Drs. Masaya Takahashi, Shanrong Zhang and Zhongwei Zhang and James Campbell and Jeni Gerberich. The study was supported by funds from the Cancer Prevention and Research Institute of Texas (CPRIT MIRA RP120670-P3 and P4) and infrastructure supported by 1P30 CA142543 and EB015908.References
1. Hallac, R.R., et al., Magn. Reson. Med., 71, 1863-1873 (2014).
2. Howe, F.A., et al., Magn. Reson. Imaging, 17, 1307-1318 (1999).
3. Kubo, S., et al., Magn. Reson. Med., 56, 698-703 (2006).
Figures