3820
Whole Body Magnetic Resonance Imaging in Paediatric Hodgkin’s Lymphoma; The Application of Quantitative Parameters for Nodal Staging1Centre for Medical Imaging, University College London, London, United Kingdom, 2Institute of Nuclear Medicine, University College London Hospital, London, United Kingdom
Synopsis
Nodal disease on whole-body MRI (WB-MRI) is mainly assessed using size criteria that could misclassify sub-centimeter lymphomatous nodes. In this study we investigated the comparative performance of anatomical WB-MRI derived nodal-size and signal-intensity; and whole-body diffusion-weighted-imaging (WB-DWI) nodal-size and apparent-diffusion-coefficient (ADC) measurements for determination of nodal-disease status. We showed that diseased nodes had significantly lower ADCs than benign nodes. We also noticed that for nodes deemed negative for disease based on size criteria (measuring 5-9 mm) ADC was significantly lower for FDG PET-CT -positive compared to FDG PET-CT -negative nodes. We also note that the performance of ADC was not greater than simple size measurement and concluded that there were no added advantage for quantitative measurements to simple size criteria on WB-MRI.
Introduction
18Flourine flouro-deoxyglucose positron-emission-tomography fused computed-tomography (18F-FDG PET-CT) scan remains gold-standard imaging for staging of paediatric Hodgkin’s lymphoma (HL) despite the associated radiation risks [1,2]. Currently, the classification of nodal status in paediatric HL relies upon size measurement on CT and/or increased FDG uptake on 18F-FDG PET. Anatomical whole-body MRI (WB-MRI) offers an alternative non-ionising technique [3] that can be supplemented by diffusion-weighted-imaging (DWI) assessing cellularity as a surrogate for metabolic activity [4]. Unlike 18F-FDG PET-CT, nodal disease status on WB-MRI is mainly assessed by size criteria alone that could misclassify sub-centimeter lymphomatous nodes [3]. In this study we investigated the comparative performance of anatomical WB-MRI derived nodal-size and signal-intensity; and whole-body DWI’s (WB-DWI) nodal-size and apparent-diffusion-coefficient (ADC) measurements for determination of nodal-disease status.Material and Methods
Thirty-seven (male/female: 16/21: mean age 16.1y; range 12.8 -18y) biopsy-confirmed HL patients were retrospectively included. Two radiologists independently reviewed the WB-MRI datasets, performed on 1.5 T scanner with axial / coronal short-tau inversion-recovery half-Fourier acquisition single-shot turbo-spin-echo (STIR-HASTE) and axial DWI with 3 b-value (0, 300 and 500 s/mm2) (Figure 1). The body was divided into 11 nodal stations [3]. For the largest node at each station, the radiologists measured short-axis diameter on STIR-HASTE and DWI-b500 and drew a region-of-interest (ROI) on both sequences to encompass measured nodes. ROIs on DWI-b500 were copied to subsequent DWI-b300 and DWI-b0 images and ADC calculated by mono-exponential fit of average signal-intensity on 3 b-value images’ ROIs. Average ROI signal-intensity from STIR-HASTE used to derive T2-SI, then normalized to muscle signal-intensity (nT2-SI). For reference-standard, 18F-FDG PET-CT were reviewed in consensus by two nuclear-medicine physicians and nodal-involvement assessed by application of conventional 18F-FDG PET-CT positivity-criteria [5] for the 11 nodal sites evaluated on WB-MRI. The sensitivity, specificity, positive-predictive-value (PPV) and negative-predictive-value (NPV) for nodal classification based on size-criteria (short-axis dimension ³10 mm) on WB-MRI was derived against the 18F-FDG PET-CT. Additionally, ADC cut-off values (0.77, 1.15, 1.77× 10⁻³ mm2 s -1) [4] were applied to the lymph nodes ³ 5mm and < 1 cm and the sensitivity, specificity, PPV and NPV repeated using combination of size and ADC cut-off values. Receiver-operating-characteristic (ROC) area-under-curve (AUC) for classification of involved nodes (against the 18F-FDG PET-CT) calculated for DWI-size, T2-size, nT2-SI and ADC. Mann-Whitney test was used to test the differences of ADC and nT2SI between 18F-FDG PET-CT positive / negative nodes, between 5 to 9 mm and ³ 10 mm nodes and between 18F-FDG PET-CT positive / negative nodes measured 5 to 9 mm.Results
There were 152 positive nodal sites on 18F-FDG PET-CT. ADC and nT2-SI for nodes split by size and for 18F-FDG PET-CT positive and negative nodes is tabulated in Figure 2. Figure 3 depicts ADC and nT2-SI for 18F-FDG PET-CT positive and negative nodes measured 5-9 mm. For 5-9 mm nodes, for reader 1, median ADC was 1.20 × 10⁻³ mm2 s -1 (interquartile-range 1.00-1.20 × 10⁻³ mm2 s -1) for 18F-FDG PET-CT positive nodes (n=18) compared to 1.40 mm2/s ×10 -6 (interquartile-range 1.30-1.70 × 10⁻³ mm2 s -1) for 18F-FDG PET-CT negative nodes (n=36) (p<0.0001). For reader 2, the median ADC was 1.10 × 10⁻³ mm2 s -1 (interquartile-range 1.10-1.20 × 10⁻³ mm2 s -1) for 18F-FDG PET-CT positive nodes (n=23) compared to 1.60 × 10⁻³ mm2 s -1 (interquartile-range 1.40-1.80 × 10⁻³ mm2 s -1) for 18F-FDG PET-CT negative nodes (n=40) (p<0.0001) The sensitivity, specificity, PPV and NPV for WB-MRI nodal staging based on size-criteria and combination of size / ADC cut-off values is tabulated in Figure 4. ROC-AUC graphs for DWI-size, T2-size, nT2-SI and ADC are presented in Figure 5.Discussion and Conclusion
In our study, diseased nodes had significantly lower ADCs than benign nodes (as highlighted by 18F-FDG PET-CT); this finding supports the results of prior investigators [6,7]. Whilst our result demonstrates good classification by ADC (ROC-AUC of 0.67-0.74), we note that the performance of ADC was not greater than simple size measurement. We also noticed that for nodes deemed negative for disease based on size criteria (measuring 5-9 mm) there was significant difference in ADC between disease-positive /disease-negative nodes (p<0.0001). It is not surprising therefore, that when applying ADC cut-off values to these nodes, there was an overall increase in WB-DWI’s sensitivity for both readers. However, increase in sensitivity comes at the expense of decrease in specificity. In conclusion, we have demonstrated that both WB-DWI and WB STIR-HASTE MRI size measurements had very good performance for classification of nodal disease in paediatric HL with no added advantage for quantitative ADC and nT2-SI measurements.Acknowledgements
This work was undertaken at the Biomedical Research Centre (BRC), University College Hospital London (UCLH), which received a proportion of the funding from the National Institute for Health Research (NIHR). The views expressed in this publication are those of the authors and not necessarily those of the UK Department of Health.
AL was supported by a Cancer Research UK/ Engineering and Physical Sciences Research Council (CRUK/EPSRC) award (C1519/A10331 and C1519/A16463) from the University College London/King’s College London (UCL/KCL) Comprehensive Cancer Imaging Centre (CCIC).
References
[1] Le Dortz L, De Guilbert S, Bayat S, et al. Diagnostic and prognostic impact of 18F-FDG PET/CT in follicular lymphoma. Eur J Nucl Med Mol Imaging. 2010;37(12):2307-2314.
[2] Kleinerman RA. Cancer risks following diagnostic and therapeutic radiation exposure in children. Pediatr Radiol. 2006; 36(Suppl 2):121-125.
[3] Punwani S, Taylor SA, Bainbridge A, et al. Pediatric and Aadolescent lymphoma: comparison of whole-body STIR half-Fourier RARE MR imaging with an enhanced PET/CT reference for initial staging. Radiology. 2010;255(1): 182-190.
[4] Punwani S, Prakash V, Bainbridge A, et al. Quantitative diffusion weighted MRI: A functional biomarker of nodal disease in Hodgkin lymphoma? Cancer Biomark. 2010;7(4):249-259.
[5] Kleis M, Daldrup-Link H, Matthay K, et al. Diagnostic value of PET/CT for the staging and restaging of pediatric tumors. Eur J Nucl Med Mol Imaging. 2009; 36:23-36
[6] Kwee TC, Ludwig I, Uiterwaal et al. ADC measurements in the evaluation of lymph nodes in patients with non-Hodgkin lymphoma: feasibility study. MAGMA. 2011;24(1):1-8.
[7] Perrone A, Guerrisi P, Izzo L, et al. Diffusion-weighted MRI in cervical lymph nodes: Differentiation between benign and malignant lesions. Eur J Radiol. 2011;77(2):281-286
Figures
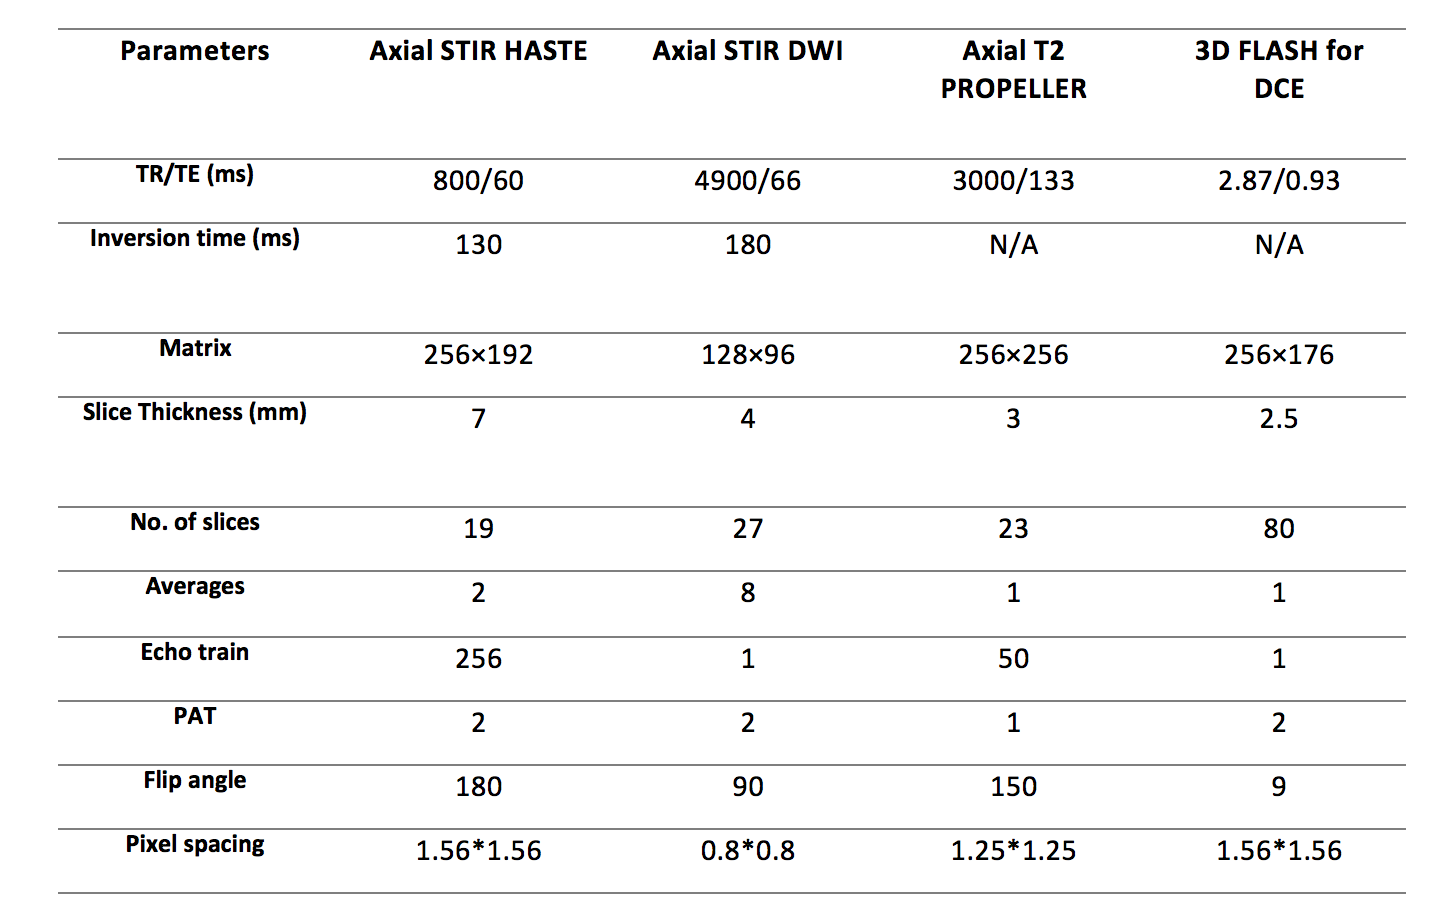
Figure 1: Whole-body MRI scanning parameters
TR: Repetition time
TE: Echo time
PAT: Parallel acquisition technique
STIR: Short tau inversion recovery
HASTE: Half fourier acquisition single shot turbo spin echo
DWI: Diffusion weighted imaging
FLASH: Fast low angle shot technique
DCE: Dynamic contrast enhance
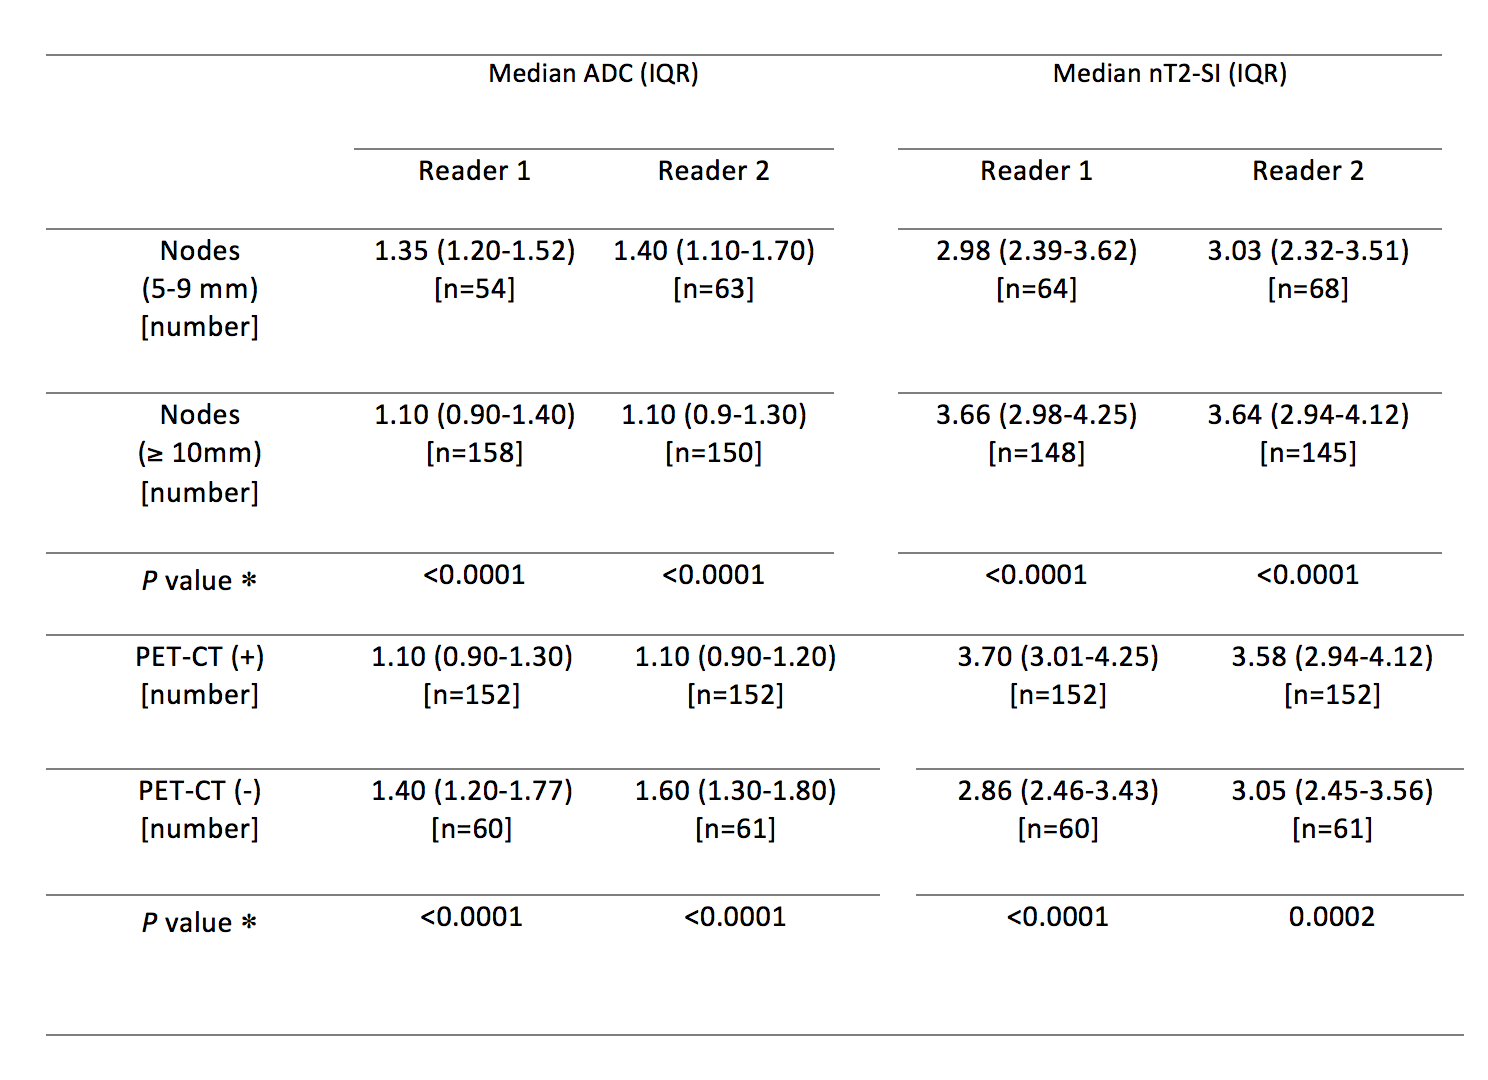
Figure 2: Comparison of median (interquartile range) of ADC and nT2-SI of lymph nodes based on size criteria and based on PET-CT positivity for both readers.
ADC: Apparent diffusion coefficient
nT2-SI: Normalised T2 signal intensity
IQR: Interquartile range
* Mann-Whitney test
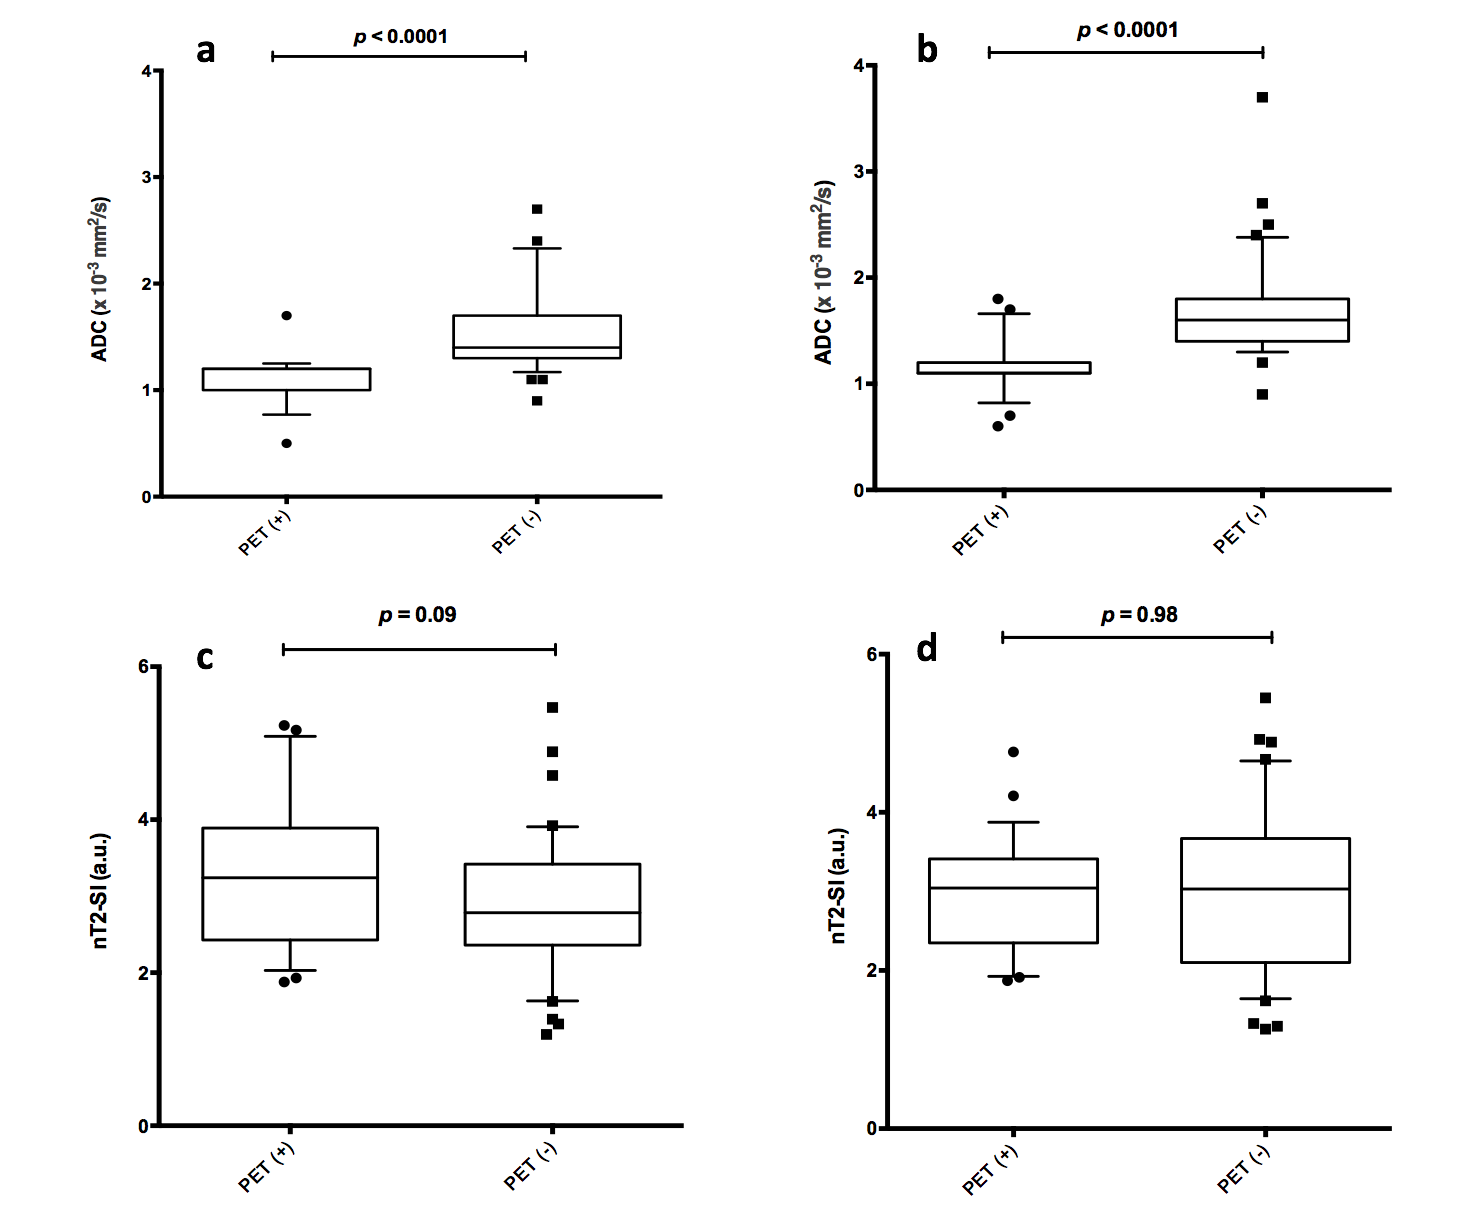
Figure 3: Box and whisker plots of ADC (a and b) and nT2-SI (c and d) for nodes measured 5 to 9 mm according to 18F-FDG PET-CT positivity/negativity.
ADC measurements for 5-9 mm nodes for both readers (a: reader 1 and b: reader 2) showed significantly lower ADC values for 18F-FDG PET-CT positive nodes compared to 18F-FDG PET-CT negative nodes.
No significant differences was found for nT2-SI for both readers (c: reader 1 and d: reader 2).
Outliers for ADC measurements (●) and nT2-SI measurements (◼) are shown. Each point represents a single nodal station.
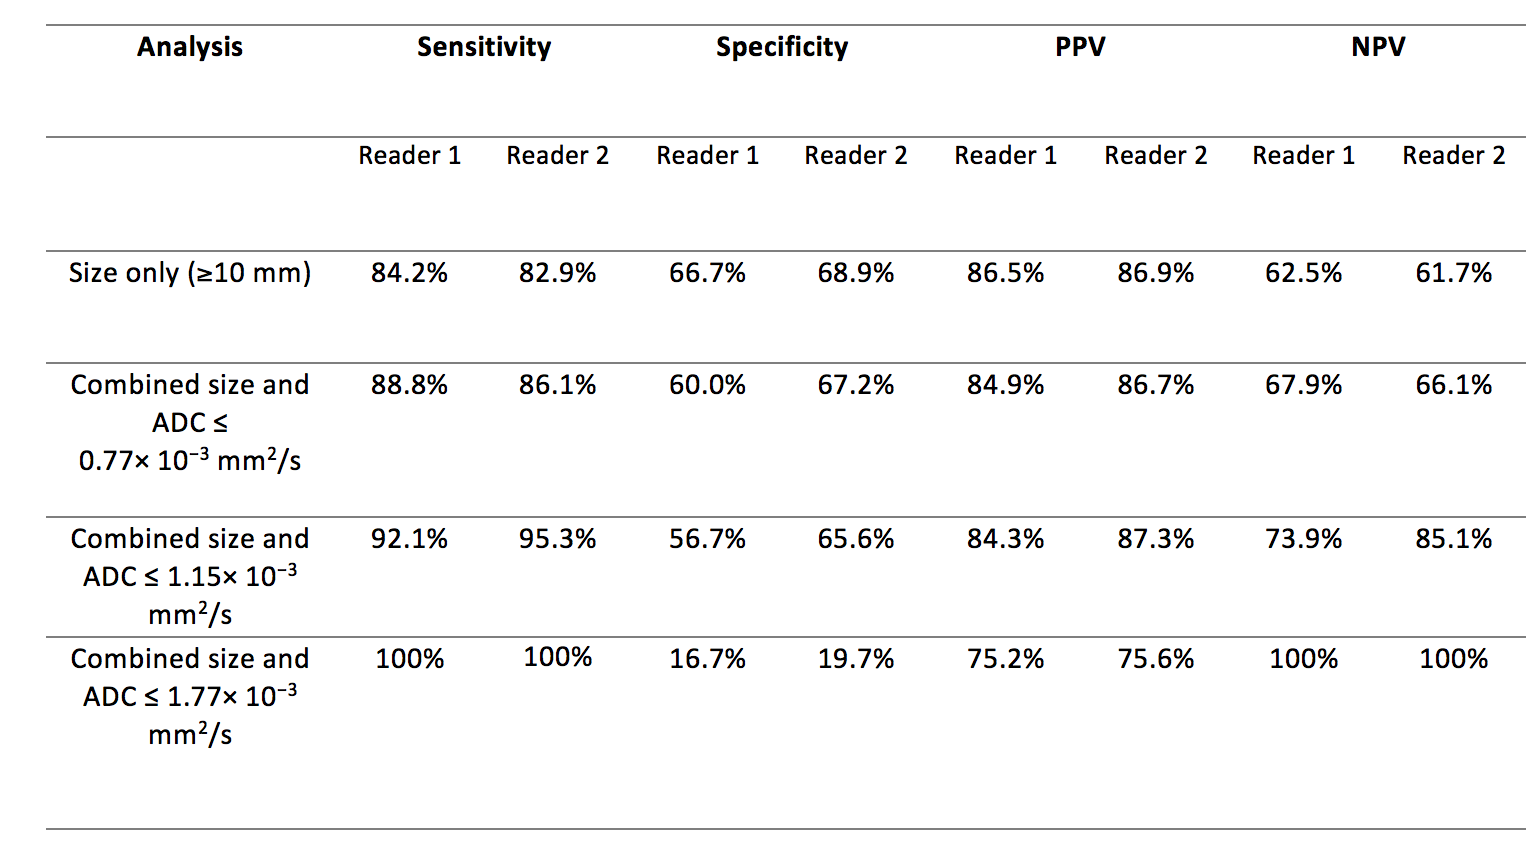
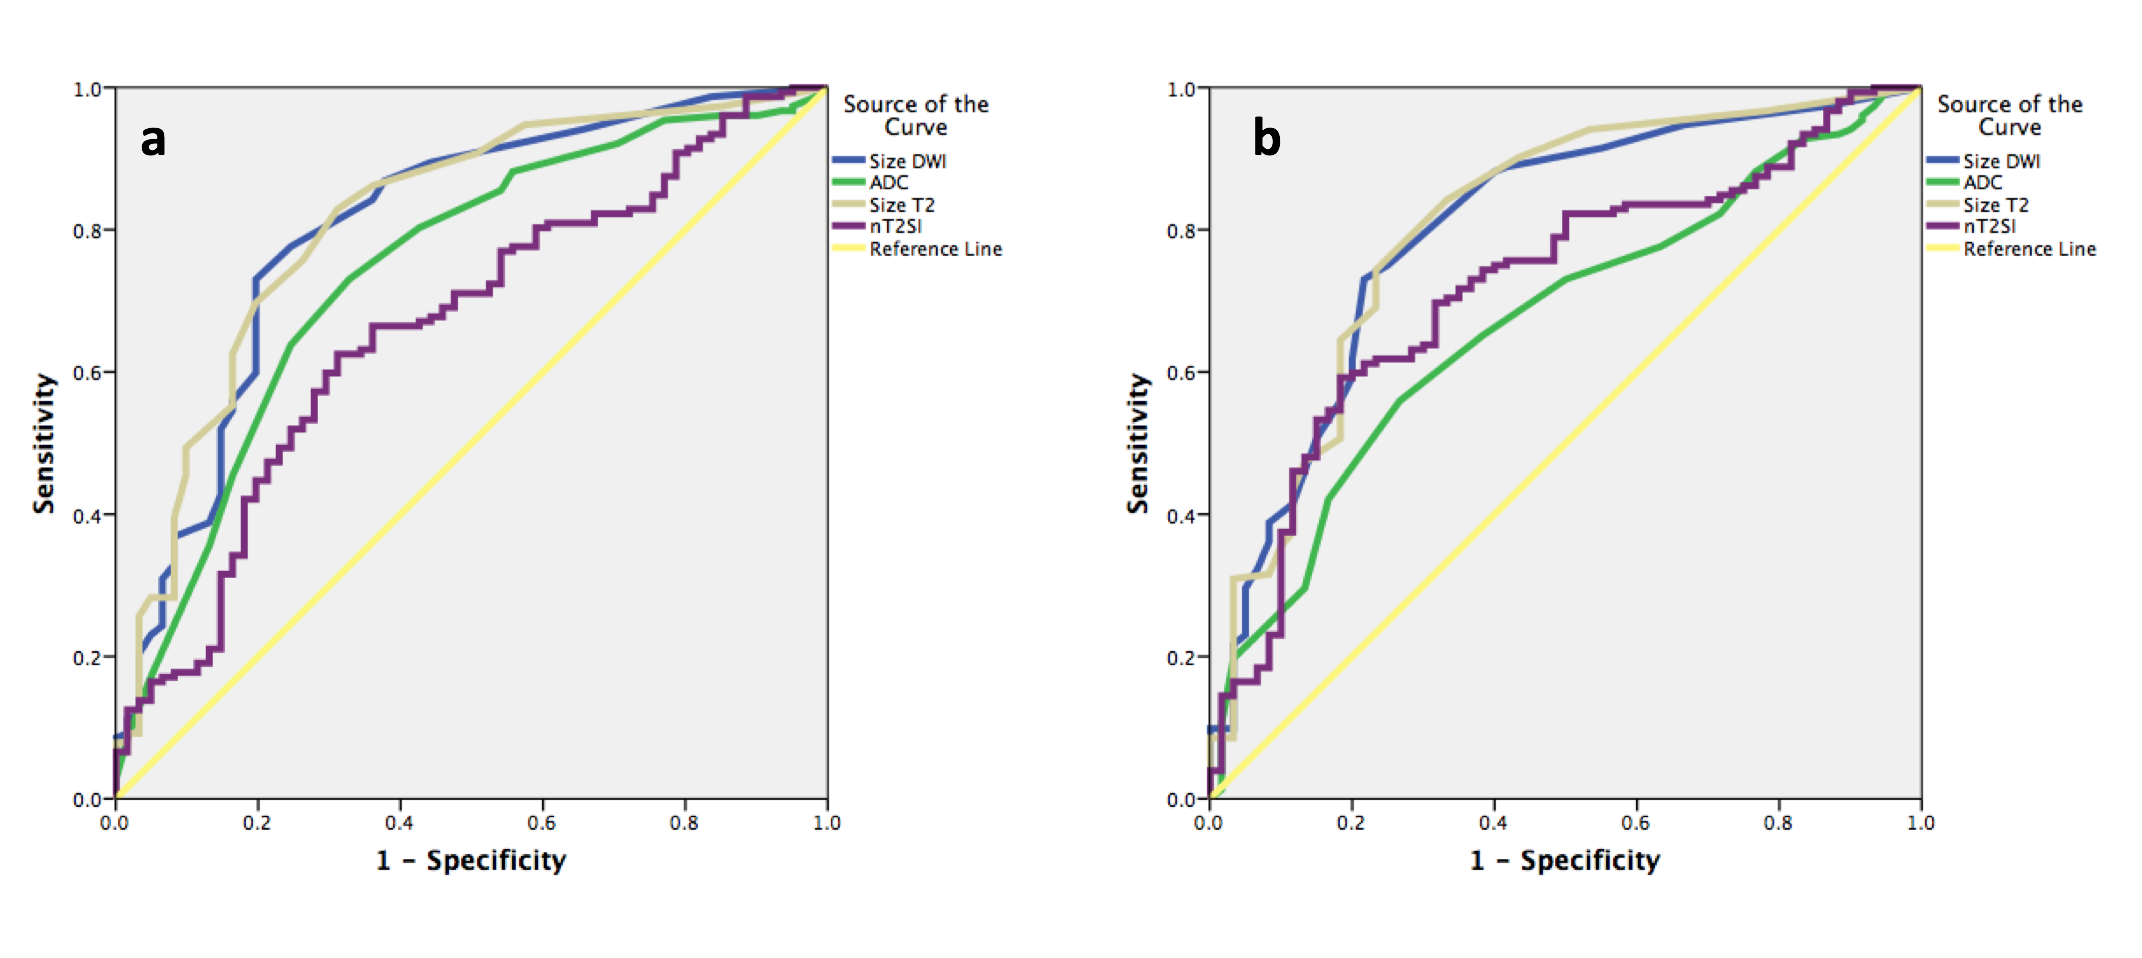
Figure 5: Receiver operating characteristic curves for size measurements on STIR-HASTE (size T2), diffusion weighted imaging (size DWI), apparent diffusion coefficient (ADC) and normalised T2 signal intensity (nT2-SI) measurements for reader 1 (a) and reader 2 (b).
The graphs demonstrate that for both readers and on both MRI sequences, size measurements achieved highest area under the curve (AUC) and were the best determinant of disease positivity.