3816
Anisotropy of Anomalous Diffusion Helps in Grading of Gliomas1Center for MRI Research, Peking University, Beijing, China, 2Department of Radiology, Beijing Tiantan Hospital, Capital Medical University, Beijing, China, 3Department of Radiology, Tongji Hospital, Tongji Medical College, Huazhong University of Science and Technology, Wuhan, China, 4MR Research China, GE Healthcare, Beijing, China, 5State Key Laboratory of Cognitive Neuroscience and Learning, Beijing Normal University, Beijing, China
Synopsis
Anomalous diffusion model has been introduced and shown to be beneficial in clinical applications, compared with conventional diffusion models. However, the anisotropy of anomalous diffusion was neglected and its clinical feasibility remains uncertain. In this study, the use of anisotropy of anomalous diffusion is investigated for differentiating low- and high-grade cerebral gliomas. Based on the results, it is shown that the anisotropy of anomalous diffusion offers advantages compared to that of conventional diffusion models, indicating its potential to facilitate future studies of neuropathological changes in clinical populations.
Purpose
It has been shown that the anomalous diffusion models better depict the diffusion-induced MR signal attenuation, as compared to the conventional mono-exponential model1. The clinical feasibility of anomalous models has also been demonstrated2–5. Up to date, only the “mean” anomalous parameters, obtained by averaging maps acquired with gradients oriented along different directions, were investigated and the effect of diffusion anisotropy was ignored. Recently, it has been demonstrated in healthy subjects that the anisotropy of anomalous diffusion is non-negligible and it can offer different contrast when compared with the conventional diffusion tensor imaging6–9. However, the clinical utility of the directional information from the anomalous diffusion remains uncertain. In this work, the use of anisotropy indices of anomalous diffusion in differentiating low- and high-grade cerebral gliomas is investigated.Methods
A total of 22 patients with pathologically-verified gliomas were enrolled in this prospective study. According to the World Health Organization (WHO) criteria10, these patients were divided into two groups: low-grade (n = 6; 1 females; mean age, 40.5±10.0 years; 4 WHO grade II astrocytic tumors and 2 WHO grade II oligoastrocytic tumors) and high-grade (n = 16; 6 females; mean age, 43.9±12.0 years; 1 WHO grade III astrocytic tumor, 11 WHO grade IV astrocytic tumors, and 4 WHO grade III oligoastrocytic tumors).
The MRI acquisition was performed on a 3.0T MRI scanner (Discovery MR750, GE Healthcare, Milwaukee, Wisconsin) equipped with an 8-channel head coil. The acquisition parameters were: TR/TE = 3800 ms/110 ms; accelerating factor = 2; field-of-view = 24 cm × 24 cm; matrix size = 128 × 128; slice thickness = 5 mm; and number of excitations = 2. The diffusion gradient separation time (Δ) was varied at 27.5, 40.0, and 55.5 ms consecutively. For each Δ value, the diffusion gradient amplitude (G0) was varied at 15.67, 19.68, 24.73, 31.06, 39.01, and 49.00 mT/m. The gradient duration (δ) was kept constant at 20.4 ms. Therefore, a total of 18 non-zero b-values were applied in one direction, ranging from 151 to 3482 s/mm2. The diffusion gradients were successively applied along the x-, y-, and z-axes.
After correction for eddy current distortions and head motions using FSL tools11, the diffusion MRI images were analyzed using the fractional motion (FM) model, which is thought appropriate to describe the anomalous diffusion in biological tissue12. The Noah exponent α and the Hurst exponent H were calculated, both of which characterize the FM model13,14. In addition, apparent diffusion coefficient (ADC) maps were also obtained using the images acquired at b-values of 0 and 950 s/mm2. To quantify anisotropy, an index similar to FA, termed generalized FA (gFA), was introduced as the sample standard deviation dividing the root mean square:
$$gFA(V)=\sqrt{\frac{N}{N-1}\frac{\sum^N_{i=1}(V_i-\bar{V})^2}{\sum^N_{i=1}V_i^2}}$$
where N is the number of sampling directions, Vi is the parameter in the i-th direction, and $$$\bar{V}$$$ is the directionally averaged parameter. The gFA maps were calculated for ADC, α, and H.
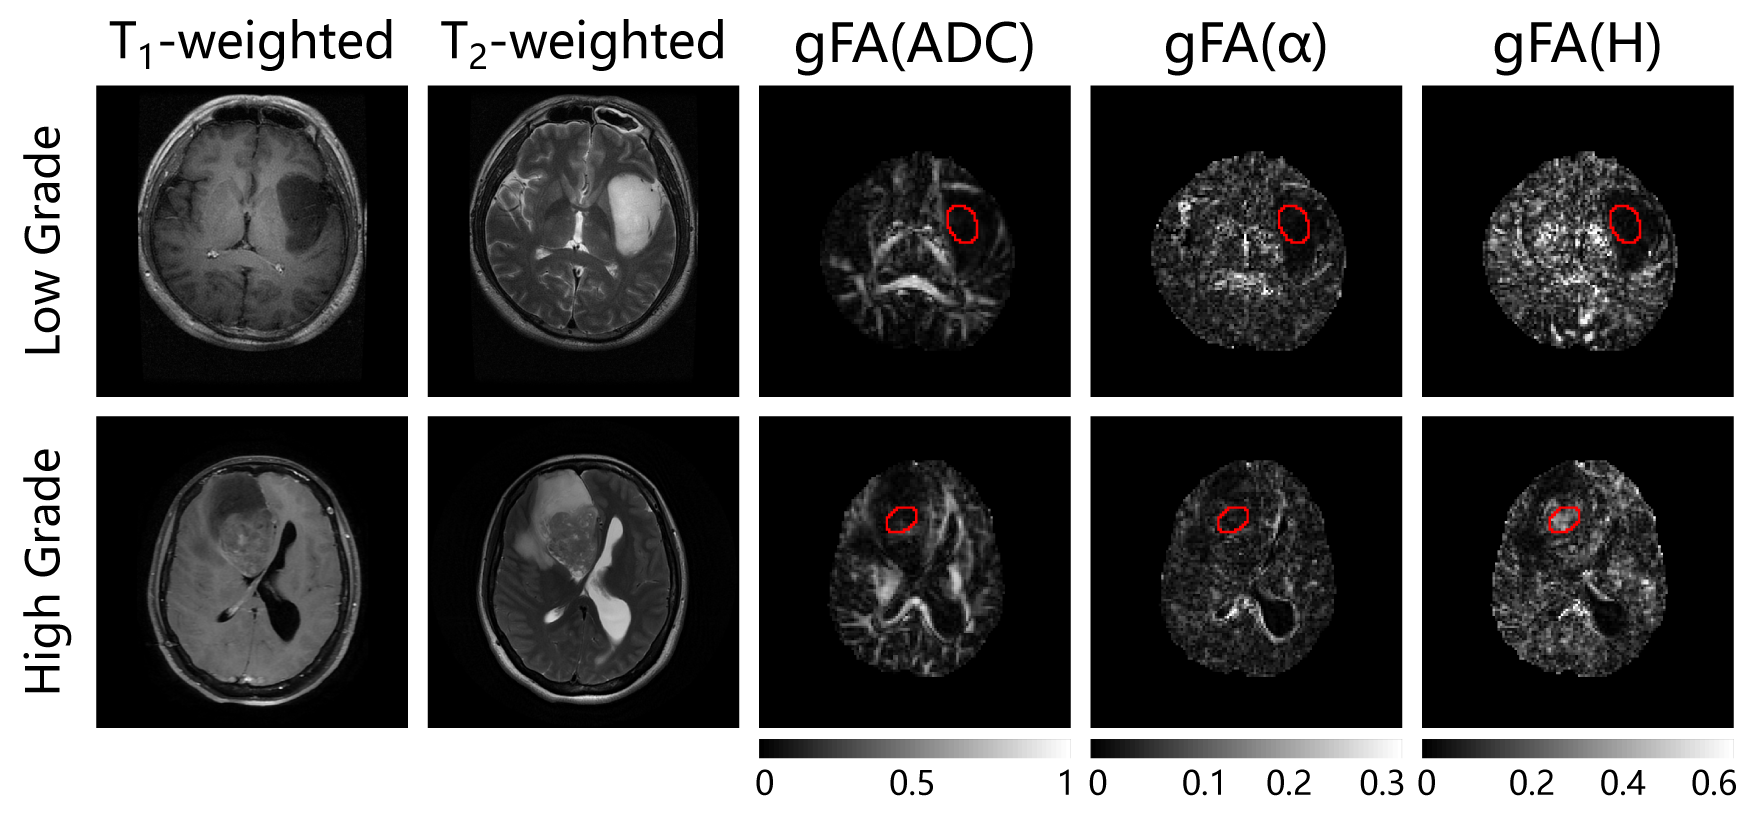
Two experienced radiologists manually placed region of interests (ROI) on solid tumor and normal-appearing white matter (NAWM) regions on the b0 images, with reference to contrast-enhanced T1-weighted images and T2-weighted images. The NAWM ROI was drawn in contralateral normal-appearing centrum semiovale to the tumor ROI, with the same size. The mean values of the gFA for ADC, α, and H were calculated over the selected ROIs and compared between low- and high-grade gliomas using the Mann-Whitney U test. Receiver operating characteristic (ROC) curves were generated to assess the sensitivity and specificity of different parameters in differentiating low- and high-grade gliomas.
Results
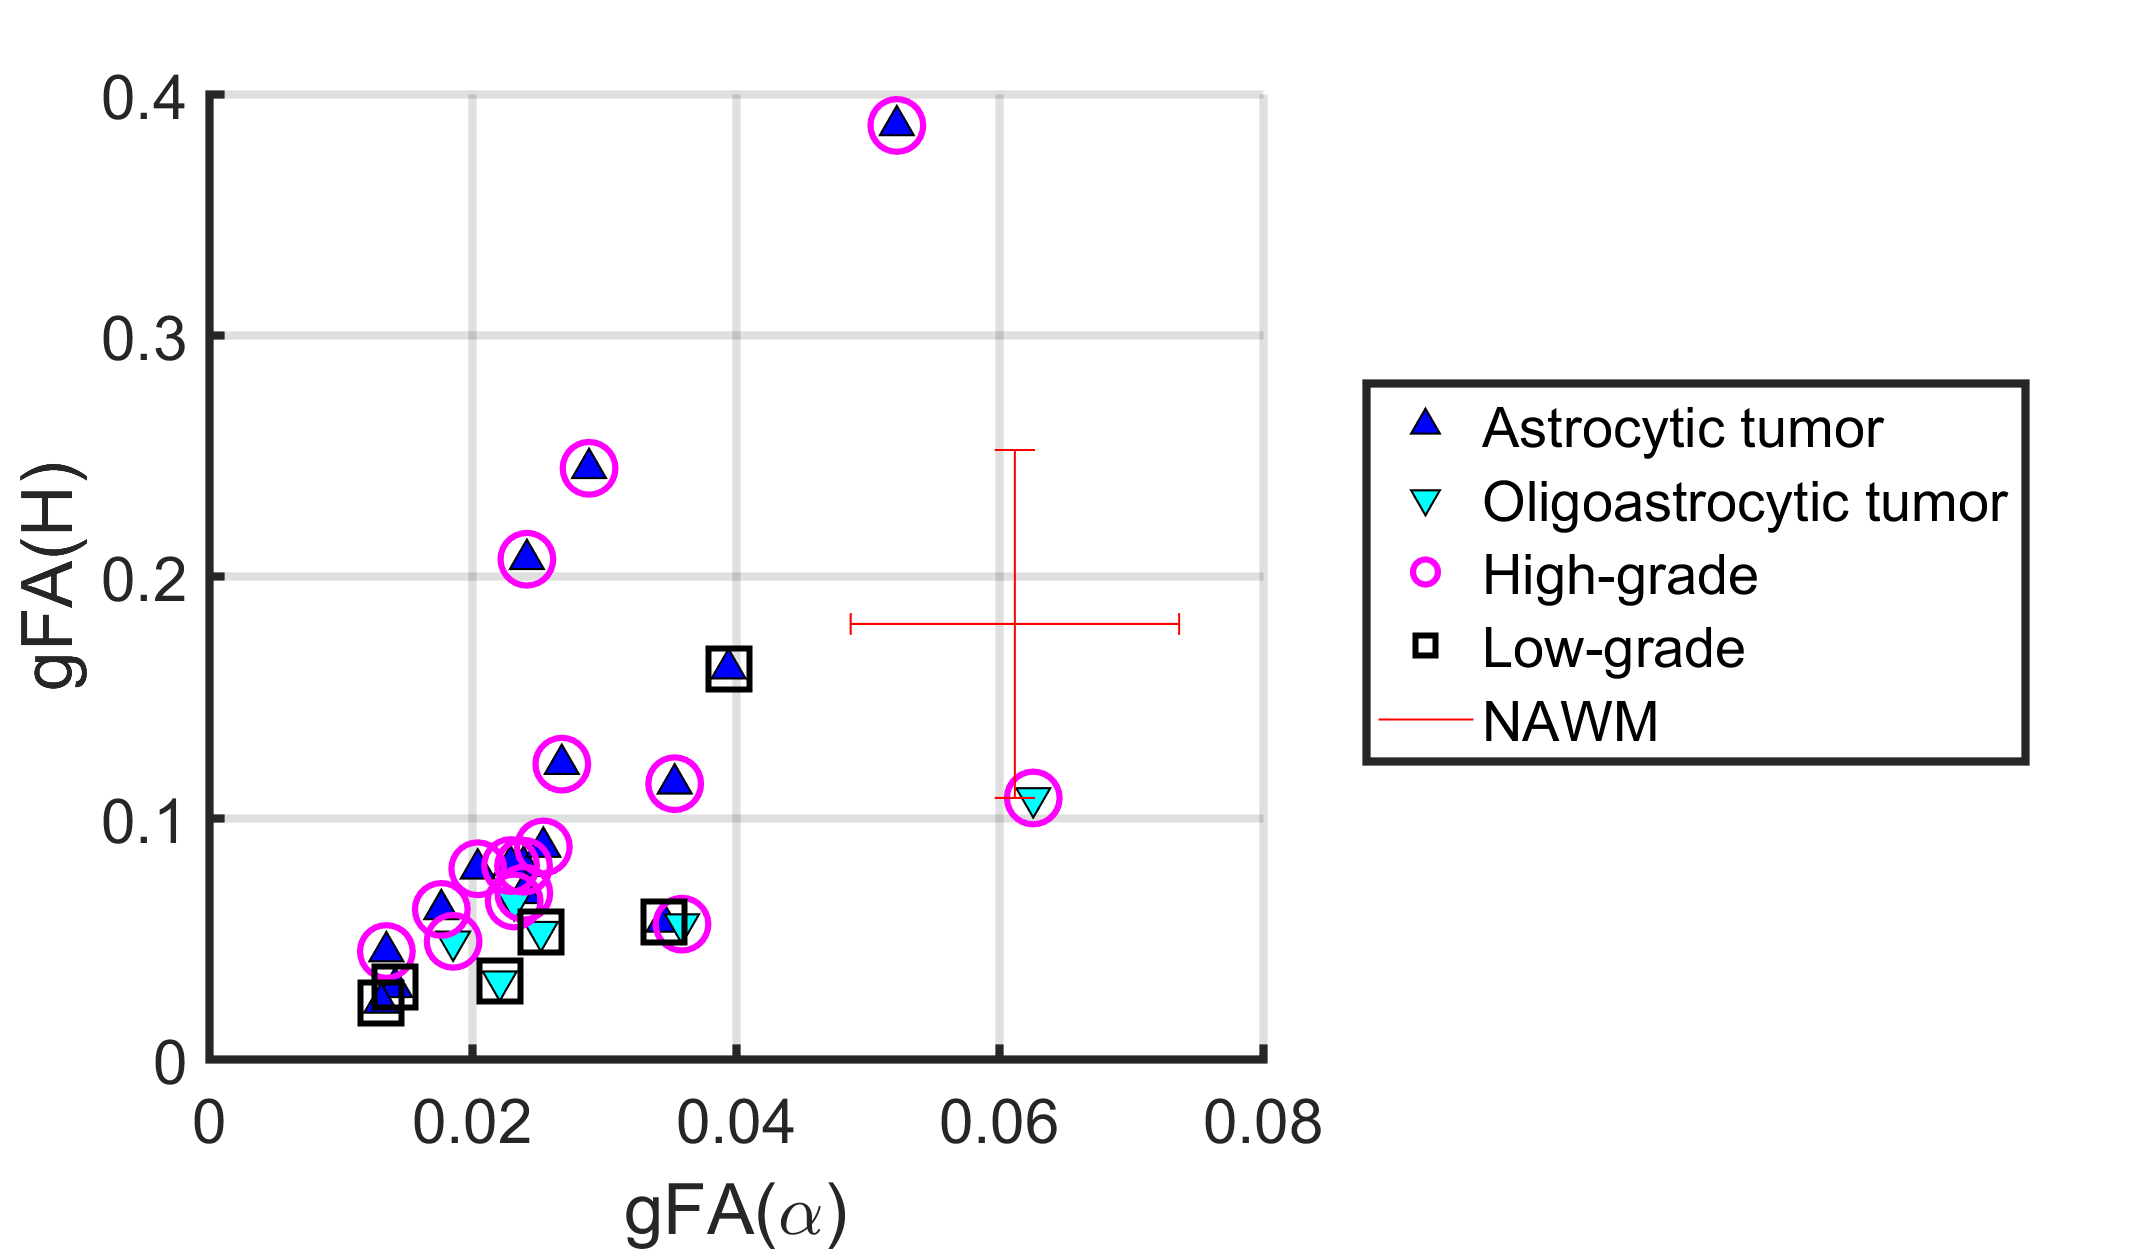
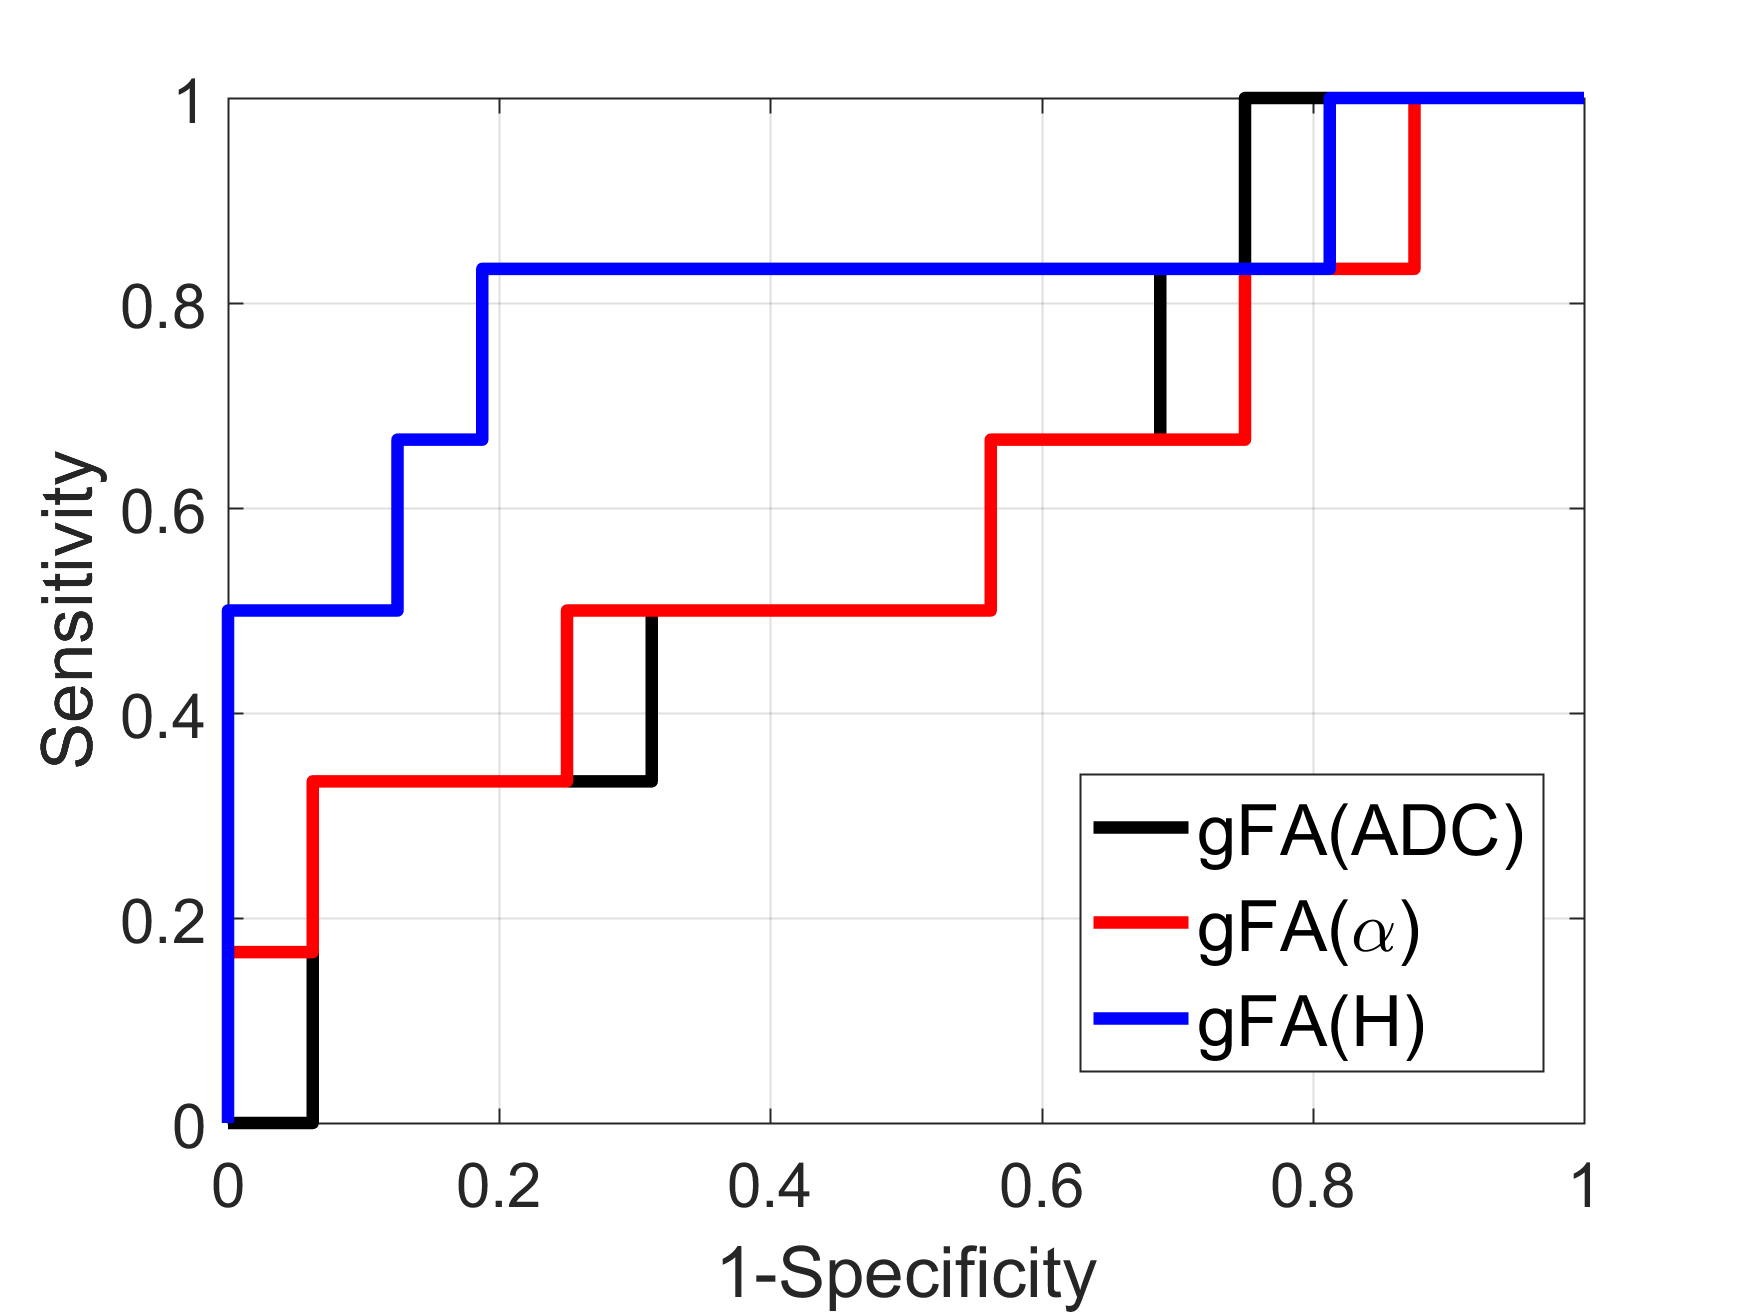
Anatomical images and the gFA maps of two representative patients are shown in Figure 1. It should be noted that gFA(H) shows clear delineation of tumor lesions from normal tissues. Figure 2 displays scatter diagram of gFA(α) vs gFA(H). It is seen that the tumor lesions and NAWM can be separated. The gFA(H) values of high-grade gliomas were significantly higher than those of low-grade gliomas (P-value=0.015); while no significant differences were observed between these two groups using gFA(ADC) (P-value=0.53) and gFA(α) (P-value=0.58) values. Figure 3 depicts the ROC curves. It is seen that the largest AUC (Area Under Curve) was obtained with gFA(H) (AUC=0.813) compared with gFA(ADC) (AUC=0.594) and gFA(α) (AUC=0.583).Discussion and Conclusion
In this study, the use of anisotropy of anomalous diffusion was investigated in differentiating low- and high-grade cerebral gliomas. The results indicated that the Hurst exponent showed good performance and outperformed the conventional ADC in the differentiation. Although the direct voxel-wise radiologic-pathologic correlation should be further explored, the anisotropy of anomalous diffusion offers distinctive information on the grading of glioma tumors.Acknowledgements
No acknowledgement found.References
1. De Santis S, Gabrielli A, Palombo M, et al. Non-Gaussian diffusion imaging: a brief practical review. Magn Reson Imaging 2011;29:1410–6.
2. Kwee TC, Galbán CJ, Tsien C, et al. Intravoxel water diffusion heterogeneity imaging of human high-grade gliomas. NMR Biomed 2010;23:179–87.
3. Sui Y, Xiong Y, Jiang J, et al. Differentiation of low-and high-grade gliomas using high b-value diffusion imaging with a non-Gaussian diffusion model. Am J Neuroradiol 2016;37:1643–1649.
4. Karaman MM, Sui Y, Wang H, et al. Differentiating low- and high-grade pediatric brain tumors using a continuous-time random-walk diffusion model at high b-values. Magn Reson Med 2016;76:1149–57.
5. Xu B, Su L, Wang Z, et al. Anomalous diffusion in cerebral glioma assessed using a fractional motion model. Magn Reson Med 2017;78:1944–9.
6. Hall MG, Barrick TR. From diffusion-weighted MRI to anomalous diffusion imaging. Magn Reson Med 2008;59:447–55.
7. De Santis S, Gabrielli A, Bozzali M, et al. Anisotropic anomalous diffusion assessed in the human brain by scalar invariant indices. Magn Reson Med 2011;65:1043–52.
8. Hall MG, Barrick TR. Two-step anomalous diffusion tensor imaging. NMR Biomed 2012;25:286–94.
9. Xu B, Gong G, Fan Y, et al. Directional sensitivity of anomalous diffusion in human brain assessed by tensorial fractional motion model. Magn Reson Imaging 2017;42:74–81.
10. Louis DN, Ohgaki H, Wiestler OD, et al. The 2007 WHO Classification of Tumours of the Central Nervous System. Acta Neuropathol (Berl) 2007;114:97–109.
11. Smith SM, Jenkinson M, Woolrich MW, et al. Advances in functional and structural MR image analysis and implementation as FSL. NeuroImage 2004;23, Supplement 1:S208–19.
12. Fan Y, Gao J-H. Fractional motion model for characterization of anomalous diffusion from NMR signals. Phys Rev E 2015;92:012707.
13. Eliazar II, Shlesinger MF. Fractional motions. Phys Rep 2013;527:101–29.
14. Burnecki K, Weron A. Fractional L\’evy stable motion can model subdiffusive dynamics. Phys Rev E 2010;82:021130.
Figures