3813
Changes in Apparent Diffusion Coefficient (ADC) of the Dominant Tumor during Dose-Painted Radiotherapy and High Dose Rate (HDR) Brachytherapy for Prostate Cancer1Radiation Oncology, Princess Margaret Cancer Centre, University Health Network, Toronto, ON, Canada, 2Radiation Oncology, University of Montreal, Montreal, ON, Canada
Synopsis
PIRADS-2 compliant Apparent Diffusion Coefficient mapping (ADC) and T2-weighted imaging was performed at baseline and week 6 of radiotherapy in 57 patients with localized prostate cancer. 101 radiomics features were calculated across the gross tumor volume (GTV) and whole prostate (WP). GTV ADC histogram metrics (10 percentile, median, mean) increased (p<1e-06) at equivalent maximum ADC values. High percentile WP ADC histogram metrics (90 percentile, maximum) decreased (p<2e-05) at equivalent 10 percentile/median/mean values. Between 44 (for GTV ADC) and 65 (for WP applied to T2w-weighted images) radiomics features were significantly different and will be explored as potential early predictive biomarkers of response.
Introduction
Dose escalation has improved cancer outcomes for patients with localized prostate cancer1. Targeting subprostatic regions of tumor burden for dose intensification may further improve tumor control and reduce dose to organs-at-risk. Quantitative MRI may enable early radiation response and dose adaptation, particularly Apparent Diffusion Coefficient (ADC) derived from diffusion-weighted images, which has validated histologic correlation to tumor cellularity2. A previous study showed a peak change in prostate tumor ADC at week 6 of radiation therapy3. This research investigates radiomics features of T2-weighted images and PIRADS-2 compliant ADC maps between baseline and week 6 as biomarkers for evaluation of early radiation response and dose adaptation, for patients treated with boosted radiation dose to their dominant prostate lesion.Methods
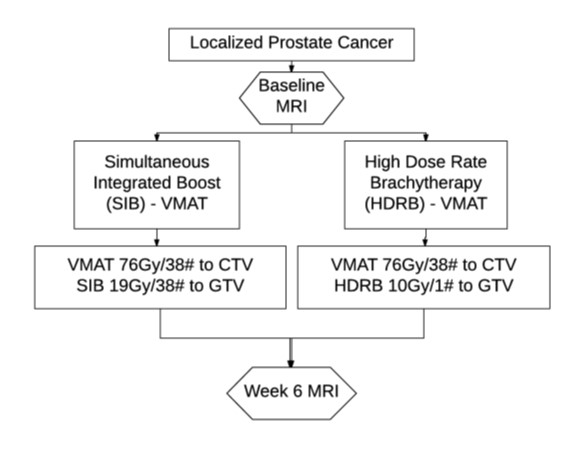
TARGET Trial: Patients with localized prostate cancer were enrolled on a tumor dose-escalation trial (Figure 1). Multi-parametric MRI was performed at baseline and week 6.
MRI Protocol: MRI was performed using a 3T Verio (Siemens Medical Systems, Erlangen, DE) with VQ gradients (40 mT/m peak amplitude; 200 T/m/s peak slew rate), with a four-channel phased-array surface coil placed anterior to the pelvis in combination with a 2-channel endorectal coil (Hologic Inc. Bedford, MA). T2-weighted imaging used a multi-slice 2D turbo-spin-echo (echo time/repetition time (TE/TR) = 115/4570 ms, echo-train length = 12, 256x256 matrix over 18 cm FOV, and 2 mm slice thickness). Diffusion-weighted image was based on single-shot echo-planar imaging with a standard biopolar diffusion gradient scheme and water-selective RF pulse for fat suppression (TE/TR = 83/4900 ms, 128x128 matrix over 18 cm, 3 mm slice thickness, b-values of 0, 100, 600, and 1000 s/mm2, 6 averages, readout bandwidth of 1302 Hz/pixel, 5 min 10 sec acquisition), with matching slice coverage to the T2-weighted acquisition. Adequacy of signal-to-noise for this protocol at b=1000 s/mm2 has already been confirmed4. ADC maps including b=0 s/mm2 were derived in-line, and PIRADS-2 compliant ADC maps excluding b=0 s/mm2 were derived using Matlab (Mathworks, MA), via weighted least squares regression to: Log(S(b)/S(bmin)) = -(b-bmin)*ADC + c, where bmin denotes the lowest b-value used for the regression4. Weightings were proportional to the inverse of the signal variance.
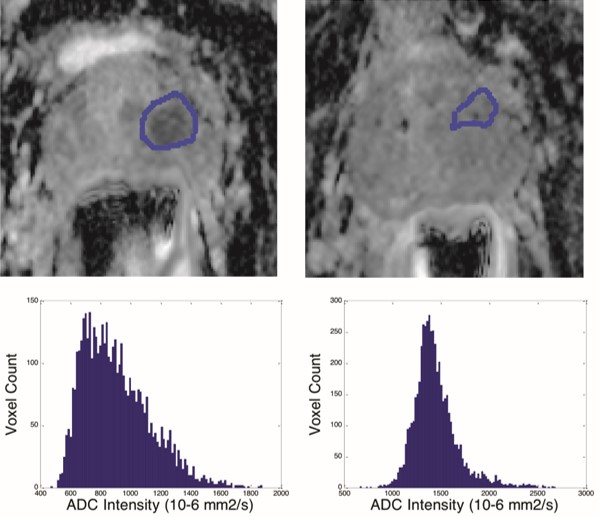
Deformable Registration: GTV defined at baseline was deformably registered onto week 6, as GTVs were not necessary visible at week 6, and the insertion of endorectal coil deformed the prostate (Fig. 2). The whole prostate and 3 common points were contoured on T2w images using MIPAV (NIH, Bethesda, MD). The points provided an initial rigid alignment, and MORFEUS4, a biomechanical-based deformable registration technique, computed displacement which was guided by the prostate surface. GTV was then visualized on ADC maps and translated manually when geometric distortion relative to the T2-weighted images was evident. Whole prostate contours drawn on T2-weighted images at each time-point were copied onto the ADC slices using MIPAV, and adapted manually for geometric distortion.
Feature Analysis: 101 radiomics features were extracted from GTVs and whole prostate contours and applied to baseline and Week 6 ADC maps, and to T2-weighted images. Features were compared using 2-tailed student t-test in Matlab (p<0.025 for intra-group and between week comparisons).
Results
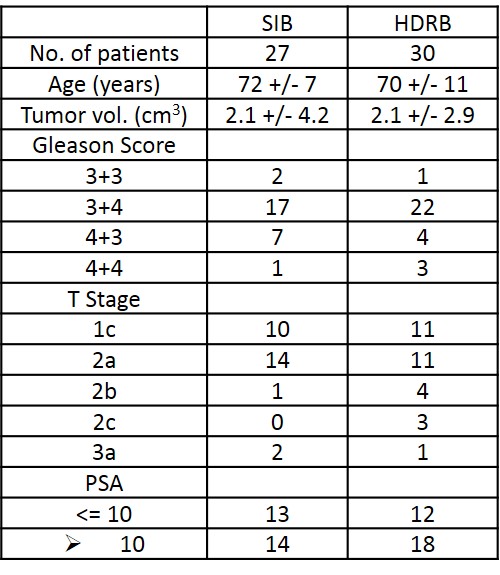
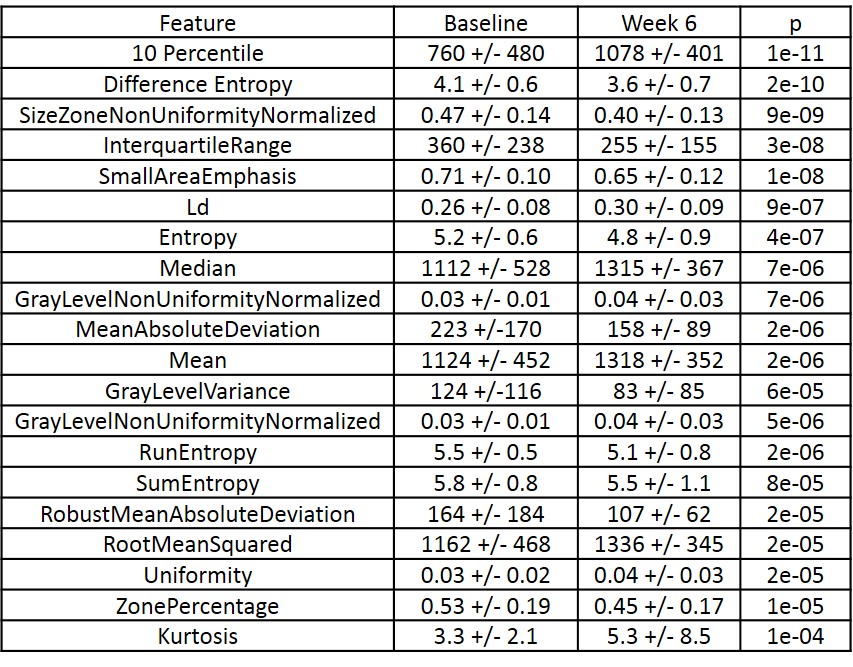
Patient characteristics for each arm are summarized in Table 1. Most significant radiomic features for GTV and WP ADC are listed in Tables 2 and 3.
GTV ADC Histogram metrics: For both b-value sets and time-points, GTV ROIs presented with equivalent ADC histogram metrics for both SIB and HDRB arms (e.g. minimum, 10 percentile, mean, median, 90 percentile, maximum absolute deviation; p>0.17). Between weeks, 10 percentile, mean, and median GTV ADC histogram metrics increased by 34, 18, and 20% without b=0 s/mm2 exclusion and by 42, 17, and 18% with b=0 s/mm2 exclusion (p<2e-06), at equivalent maximum ADC values (p>0.4). Absolute deviation metrics correspondingly reduced (p<2e-05).
WP ADC Histogram metrics: WP ROIs presented with equivalent histogram metrics for both arms (p>0.12). Between weeks, 90 percentile, maximum, and absolute deviation ADC metrics decreased (p<1e-05) at equivalent 10 percentile/mean/median (p>0.03).
Radiomics Features: 44/100 and 54/100 1st order radiomics features differed between baseline and week 6 for GTV and WP ADC contours with b=0 s/mm2 exclusion. 49 and 57 features differed with b=0 s/mm2 inclusion. 65/100 features differed between WP contours applied to T2-weighted images.
Conclusions
Our preliminary data confirm significant changes in numerous GTV and WP radiomic features assessed from ADC and T2-weighted images during boost radiotherapy. GTV ADC histogram metrics increased with equivalent maximum ADC values, and high percentile WP ADC metrics decreased. WP features will be tested for prediction of GTV changes, and all features will be evaluated as potential biomarkers of early radiotherapy response.Acknowledgements
Support by grant funding from the Canadian Cancer Society.References
1. Pollack A, Zagars GK, Smith LG, et al. Preliminary results of a randomized radiotherapy dose-escalation study comparing 70 Gy with 78 Gy for prostate cancer. J Clin Oncol. 2000;18(23):3904-11.
2. Langer DL, van der Kwast TH, Evans AJ, et al. Prostate tissue composition and MR measurements: investigating the relationships between ADC, T2, K(trans), v(e), and corresponding histologic features. Radiology. 2010;255(2):485-94.
3. Foltz WD, Wu A, Chung P, et al. Changes in apparent diffusion coefficient and T2 relaxation during radiotherapy for prostate cancer. J Magn Reson Imaging. 2013;37(4):909-16.
4. Foltz WD, Porter DA, Simeonov A, et al. Readout-segmented echo-planar diffusion-weighted imaging improves geometric performance for image-guided radiation therapy of pelvic tumors. Radiother Oncol. 2015;117(3):525-31.
Figures