3812
Response Assessment in Carbon-Ion Radiotherapy of Recurrent High Grade Glioma through Characterization of Tumor Vascularization and Perfusion using DCE MRI1German Cancer Consortium (DKTK), Heidelberg, Germany, 2Translational Radiation Oncology, National Center for Tumor Diseases (NCT), German Cancer Research Center (DKFZ), Heidelberg, Germany, 3Division of Molecular and Translational Radiation Oncology, Heidelberg Institute of Radiation Oncology (HIRO), National Center for Radiation Research in Oncology (NCRO), Heidelberg, Germany, 4Heidelberg Ion-Beam Therapy Center (HIT), Department of Radiation Oncology, Heidelberg University Hospital, Heidelberg, Germany, 5Division of Medical Image Computing, German Cancer Resarch Center, Heidelberg, Germany
Synopsis
Carbon-ion radiotherapy holds great potential for treatment of recurrent high-grade glioma, where re-irradiation is difficult due to prior dose burden. We investigated effects of carbon RT on tumor micro-vascularization and micro-circulation, by evaluating semi-quantitative parameters derived from DCE MRI before and after irradiation. Results show augmented perfusion parameters AUC, maximum enhancement and wash-out after therapy compared to pre-RT scans, and lower AUC, wash-in, wash-out and final uptake for responders to therapy compared to non-responders. Additionally, significantly lower values for AUC, wash-out, maximum enhancement and final uptake could be observed for progressed tumor volumes compared to irradiated tumor volumes.
Purpose
Despite many years of research prognosis
for patients with high-grade glioma (HGG) remains poor (1). Carbon-ion radiotherapy (RT) provides steep dose gradients and
enhanced biological effectiveness compared to standard photon RT, which allows
for dose escalation in the tumor combined with optimal sparing of
surrounding healthy tissue. Thus, it offers great potential, especially for treatment
of recurrent HGG, where re-irradiation has to be performed cautiously due to
dose burden from prior treatment (2,3). In dynamic contrast-enhanced (DCE) MRI a time series of images is
acquired over the administration of contrast agent (CA). Tissue perfusion and permeability dictate accumulation
and washout of CA. Analysis of concentration-time curves can thus
be utilized to assess tumor microvasculature and microcirculation (4).
We investigated the effects of carbon-ion RT
on tumor perfusion in recurrent HGG by evaluating pre- and post-RT DCE
MRI within RT volumes. The aim was to detect changes in microvasculature and
perfusion resulting from RT and to correlate these changes with the time-point
of progress after irradiation and hence response to therapy. Furthermore,
differences in DCE derived parameters within RT target volumes compared to
progressed tumor volumes were investigated at follow-up (FU), in order to
evaluate the potential for perfusion parameters to detect progress after
therapy.Methods
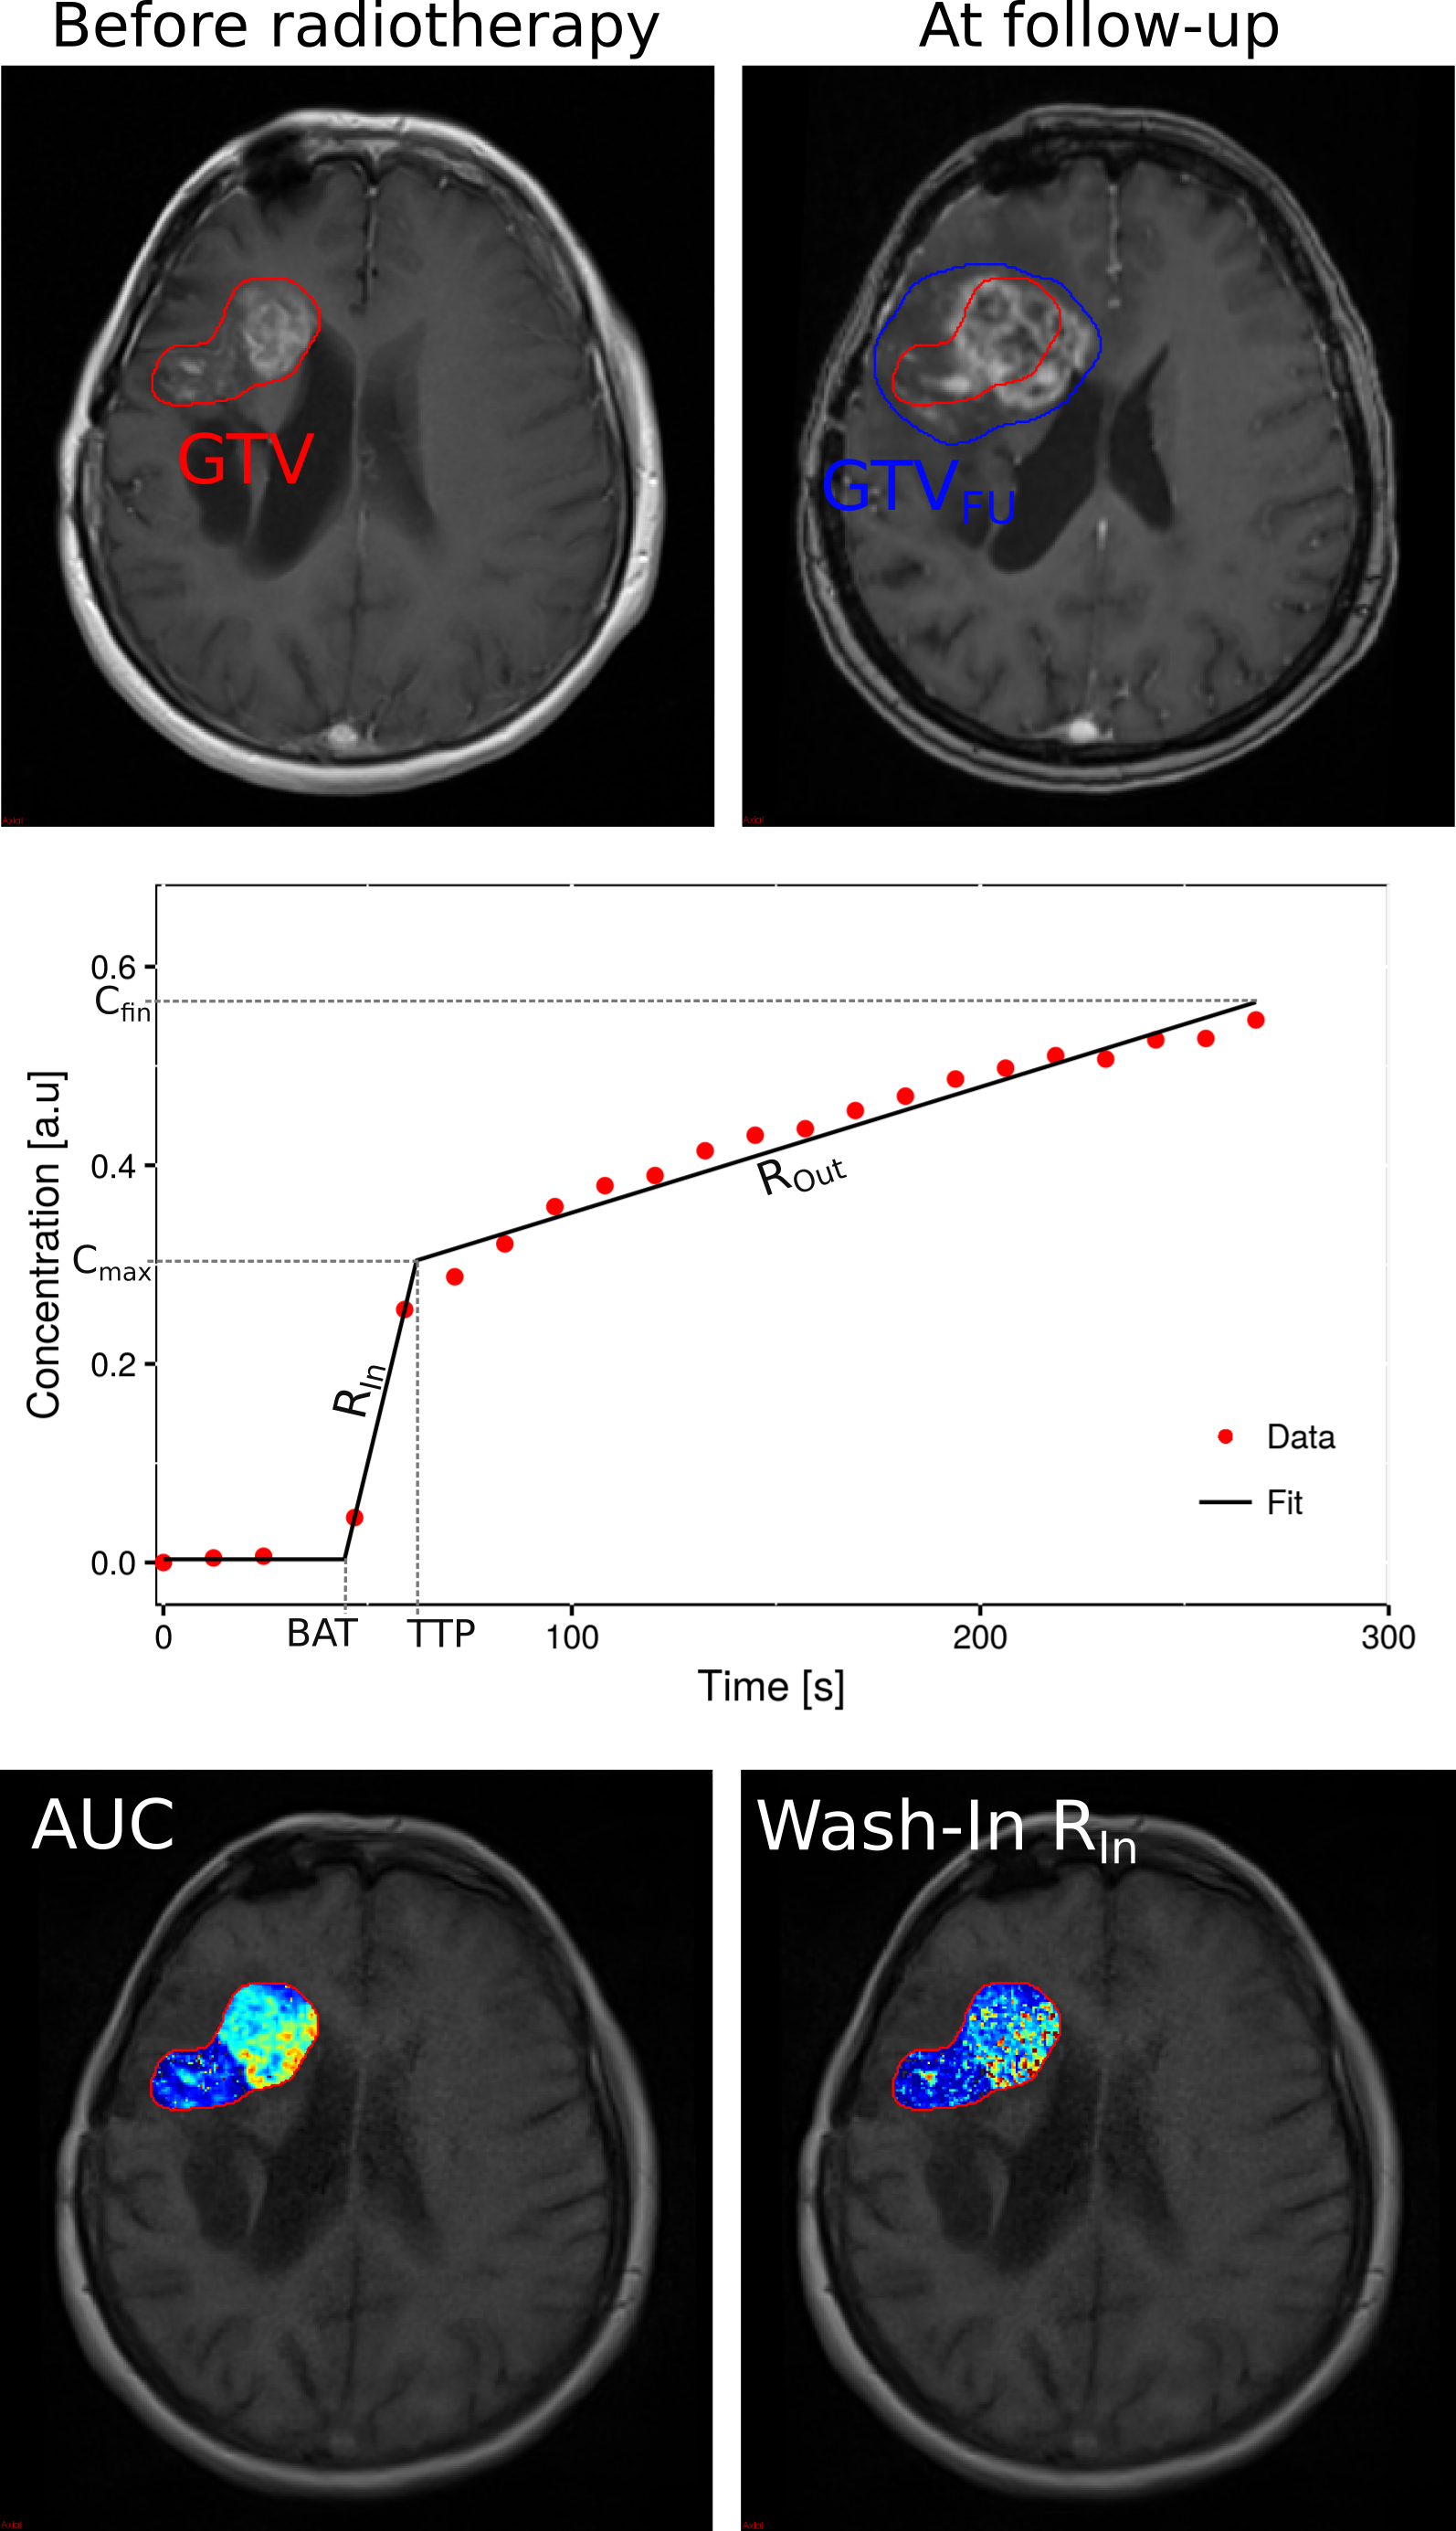
Retrospective data from 15 patients with recurrent HGG were investigated. DCE MRI was conducted for Taq=267.49 s over the time course of tracer administration (Gadovist) on a Siemens 3T scanner prior to RT and at first follow-up examination (<2 months after RT), using a T1 VIBE sequence (TR=5.54ms, TE=2.52ms, α=10°) at a spatial resolution of 0.898mm×0.898mm×5mm and a temporal resolution of 12.26s. RT target structure gross tumor volume (GTV), delineated on standard T1-CE MRI, was co-registered with the DCE data. Patients received carbon irradiation with varying fractions (10 - 13) of each 3GyE. For patients with radiologically confrimed progress at first FU, progressed tumor volumes GTVFU were delineated based on FU T1-CE MRI. Analysis of DCE MRI data was conducted within GTV for pre- and post-RT scans and within the further grown tumor P=GTVFU-GTV for post-RT scans. Signal was converted to concentration units by means of relative signal enhancement and ROI-based concentration-time curves were fitted within GTV and P with a three step linear model (5) using in-house developed software (6,7). Fitting yielded semi-quantitative parameters area-under-the-curve (AUC), bolus-arrival time (BAT), time-to-peak (TTP), wash-in slope (RIn), wash-out slope (ROut), maximum uptake (Cmax) and final uptake (Cfin) (Fig.1).Results
At the first FU examination, 6 patients showed progression
of the tumor (referred to as Early
Progress EP), the remaining 9 patients presented with stable disease
(denoted as Late/No Progress LP).
From these 9, 7 showed progress at a later FU time-point. Over all patients, no
distinct trend of change could be detected in determined parameters within GTV
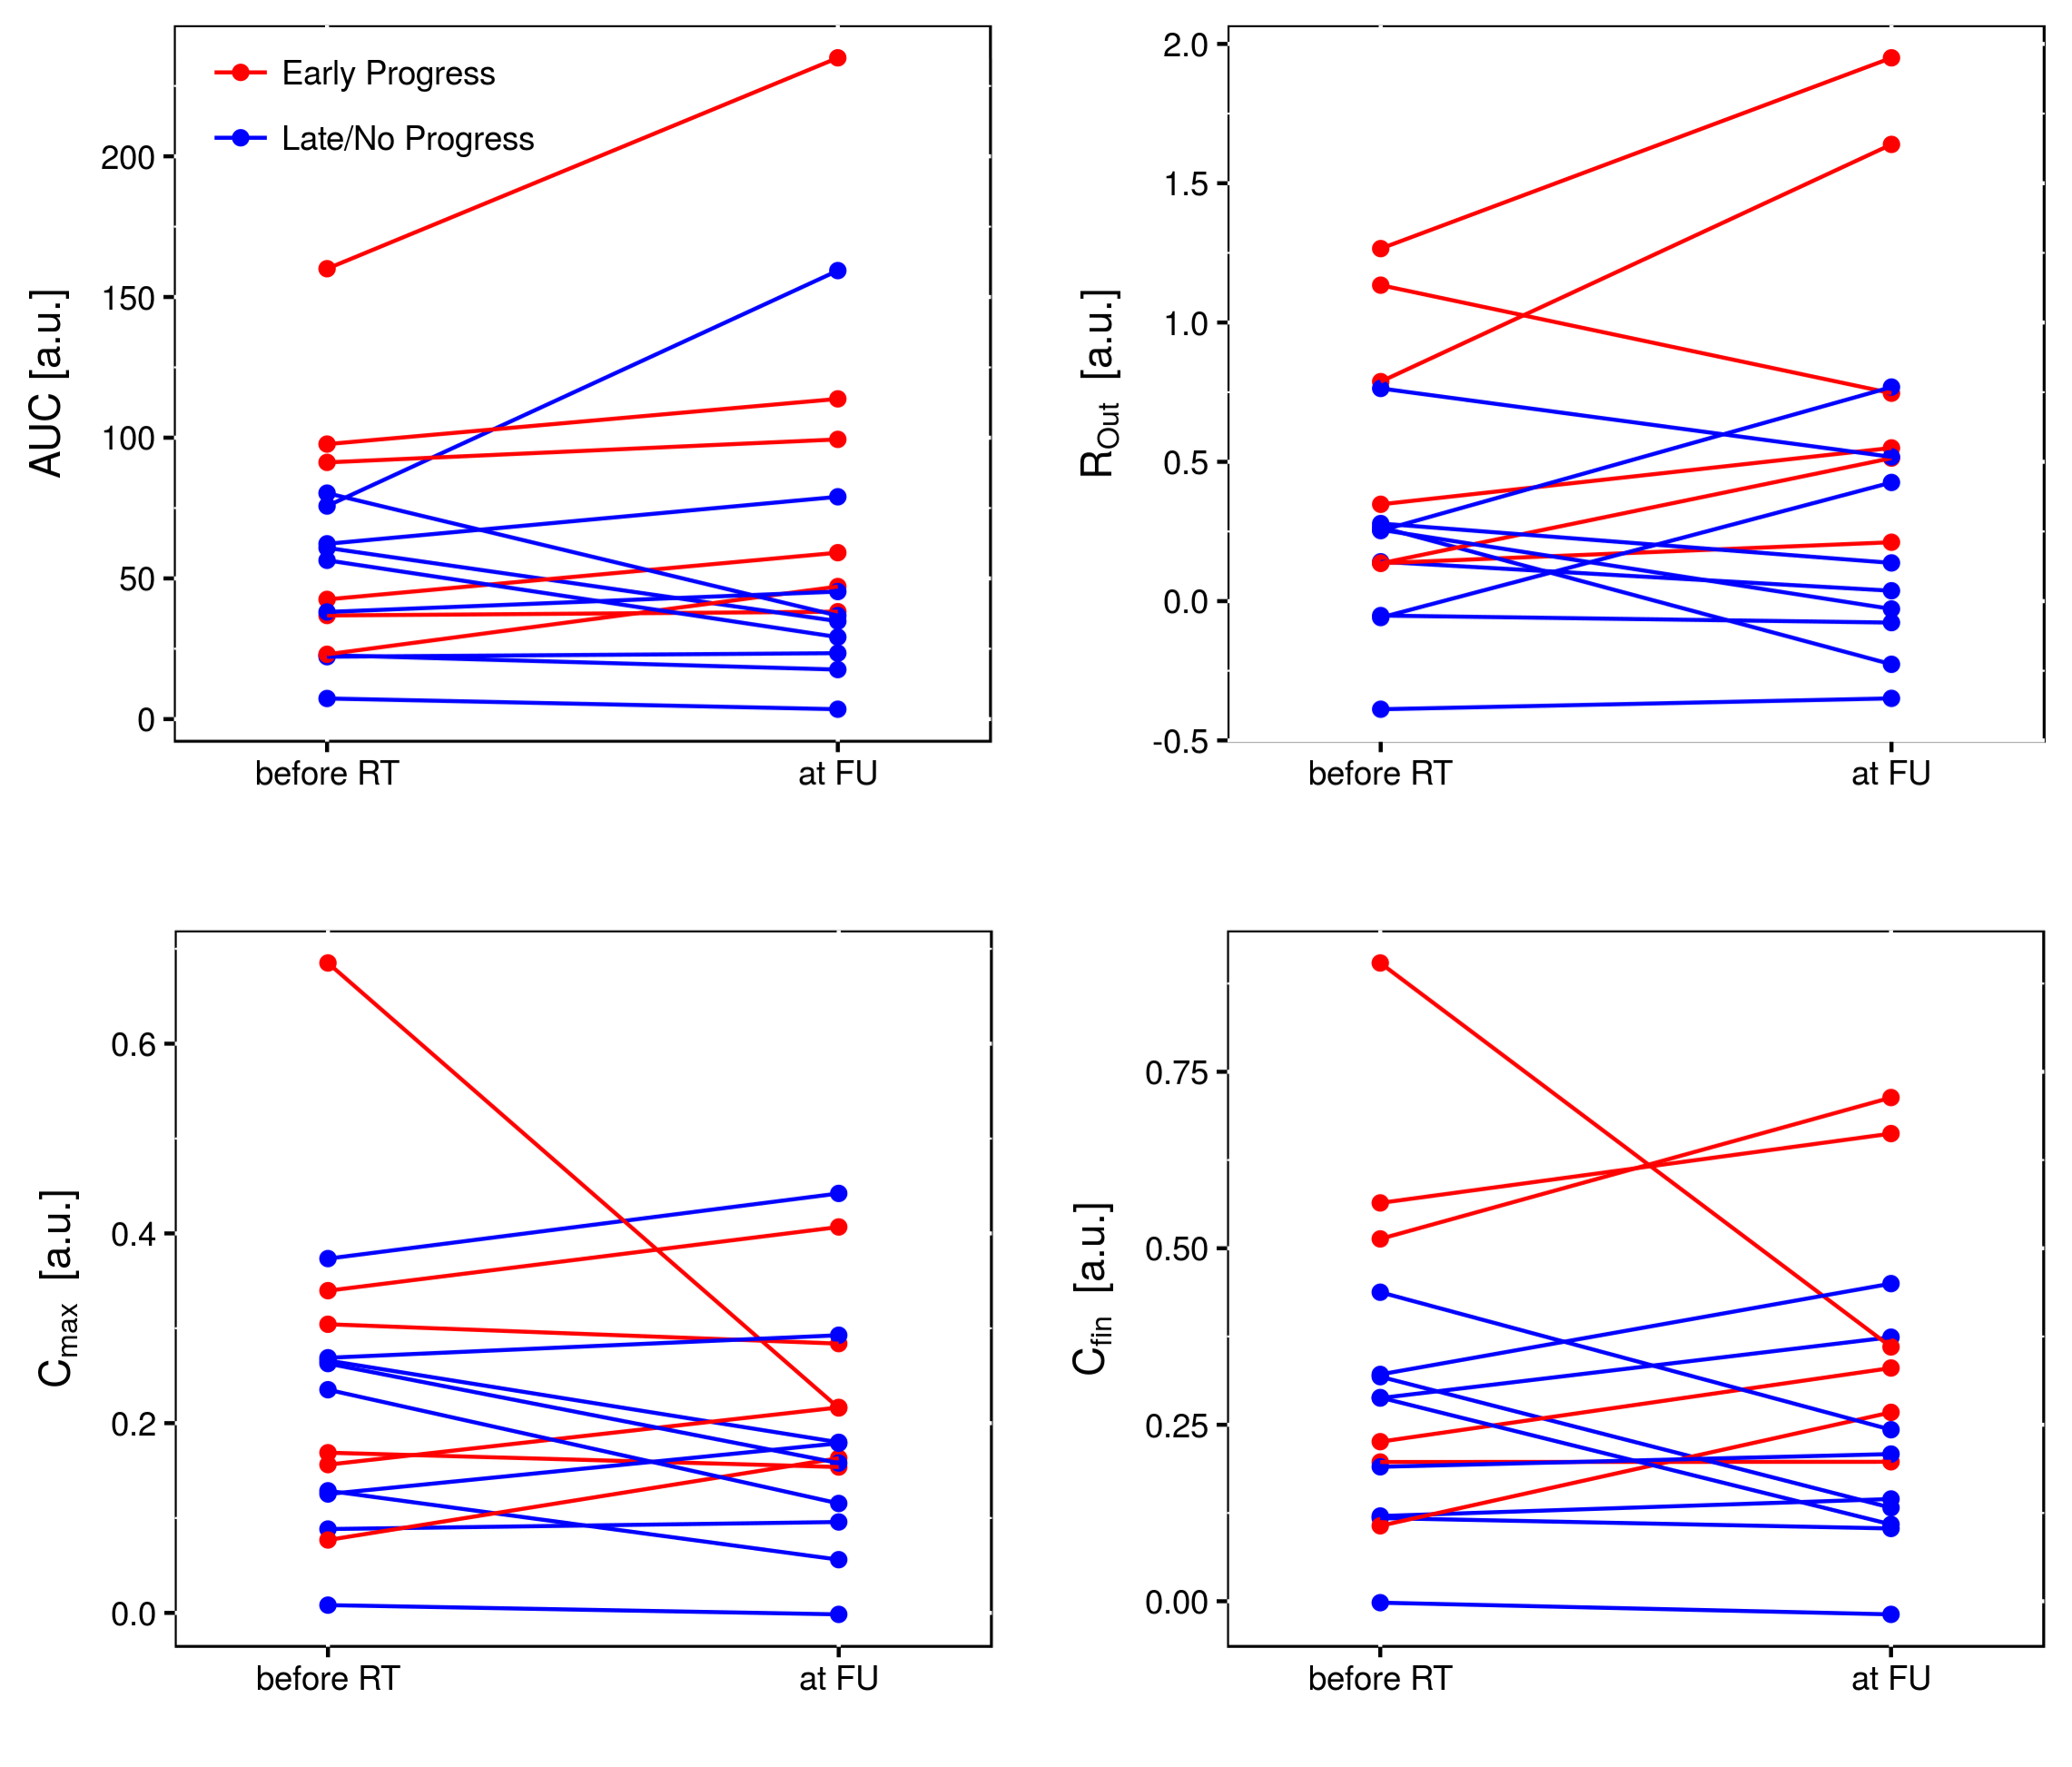
before RT compared to FU. However, it can be observed that in EP patients, AUC,
Rout, Cmax and Cfin tended to be higher at FU
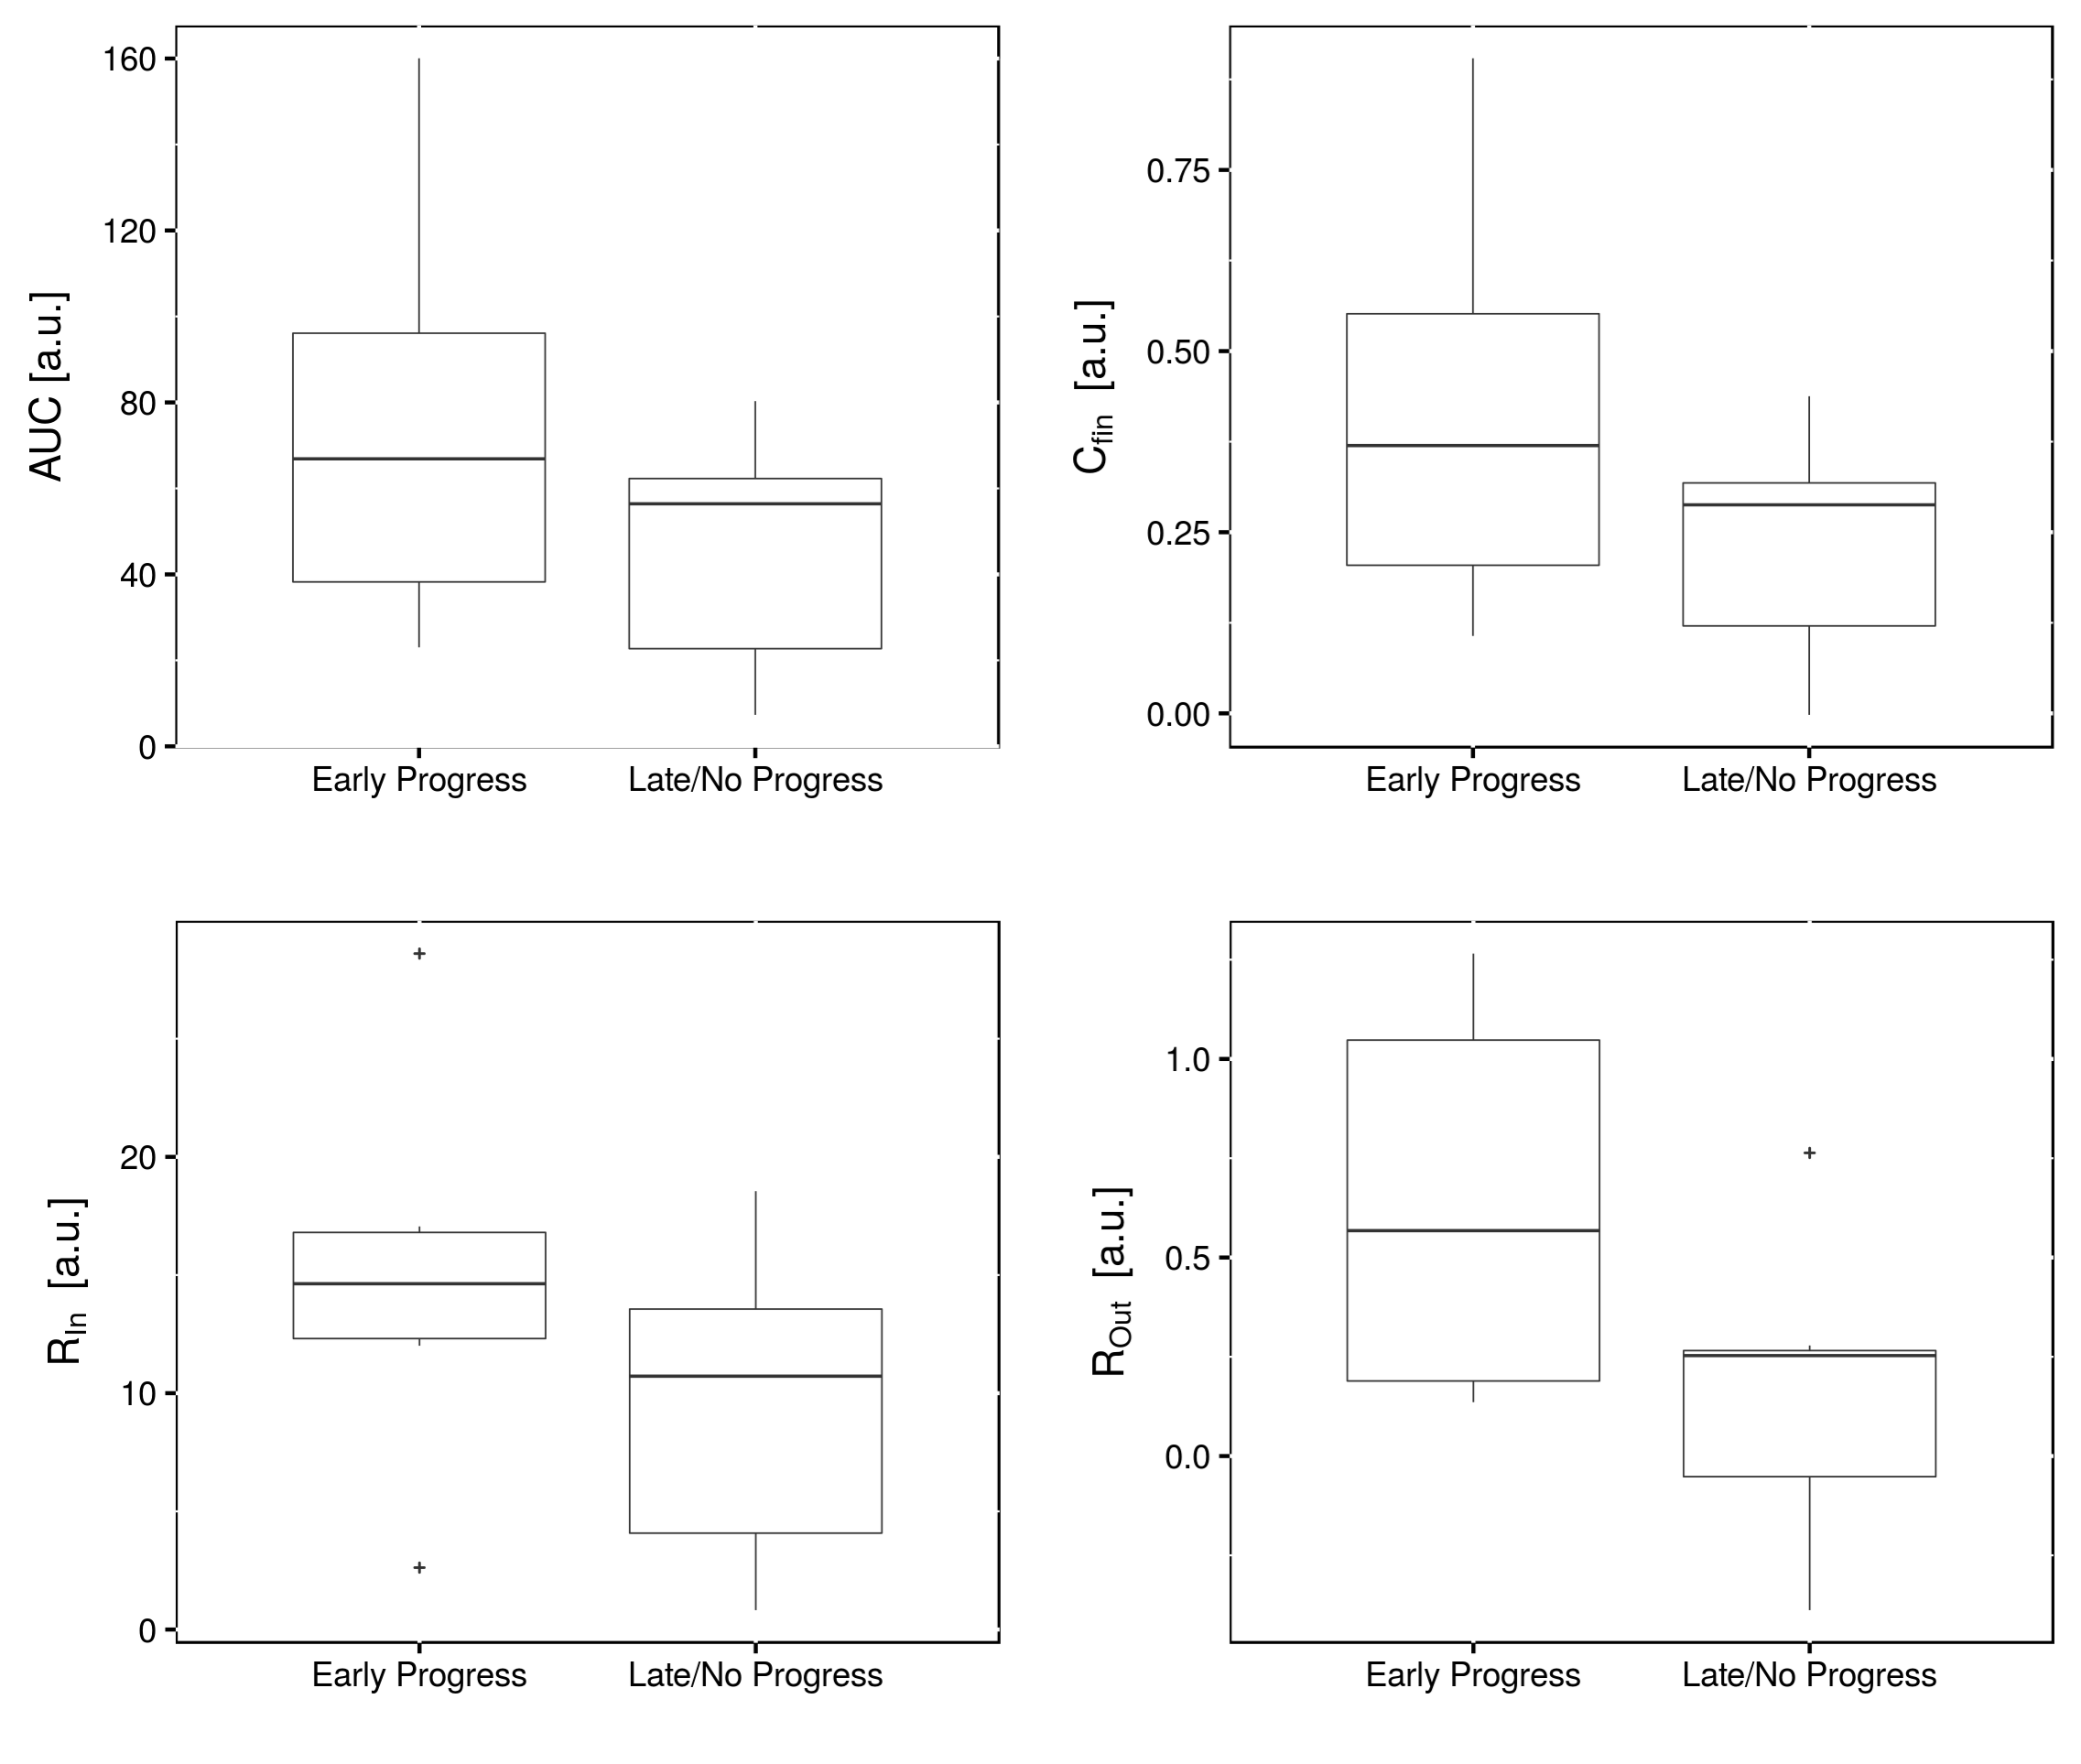
(Fig. 2). Before RT, parameters AUC, RIn, ROut and Cfin
were higher in patients, who showed progress immediately after therapy (Fig. 3).
However, the differences were not significant. For patients with EP and LP,
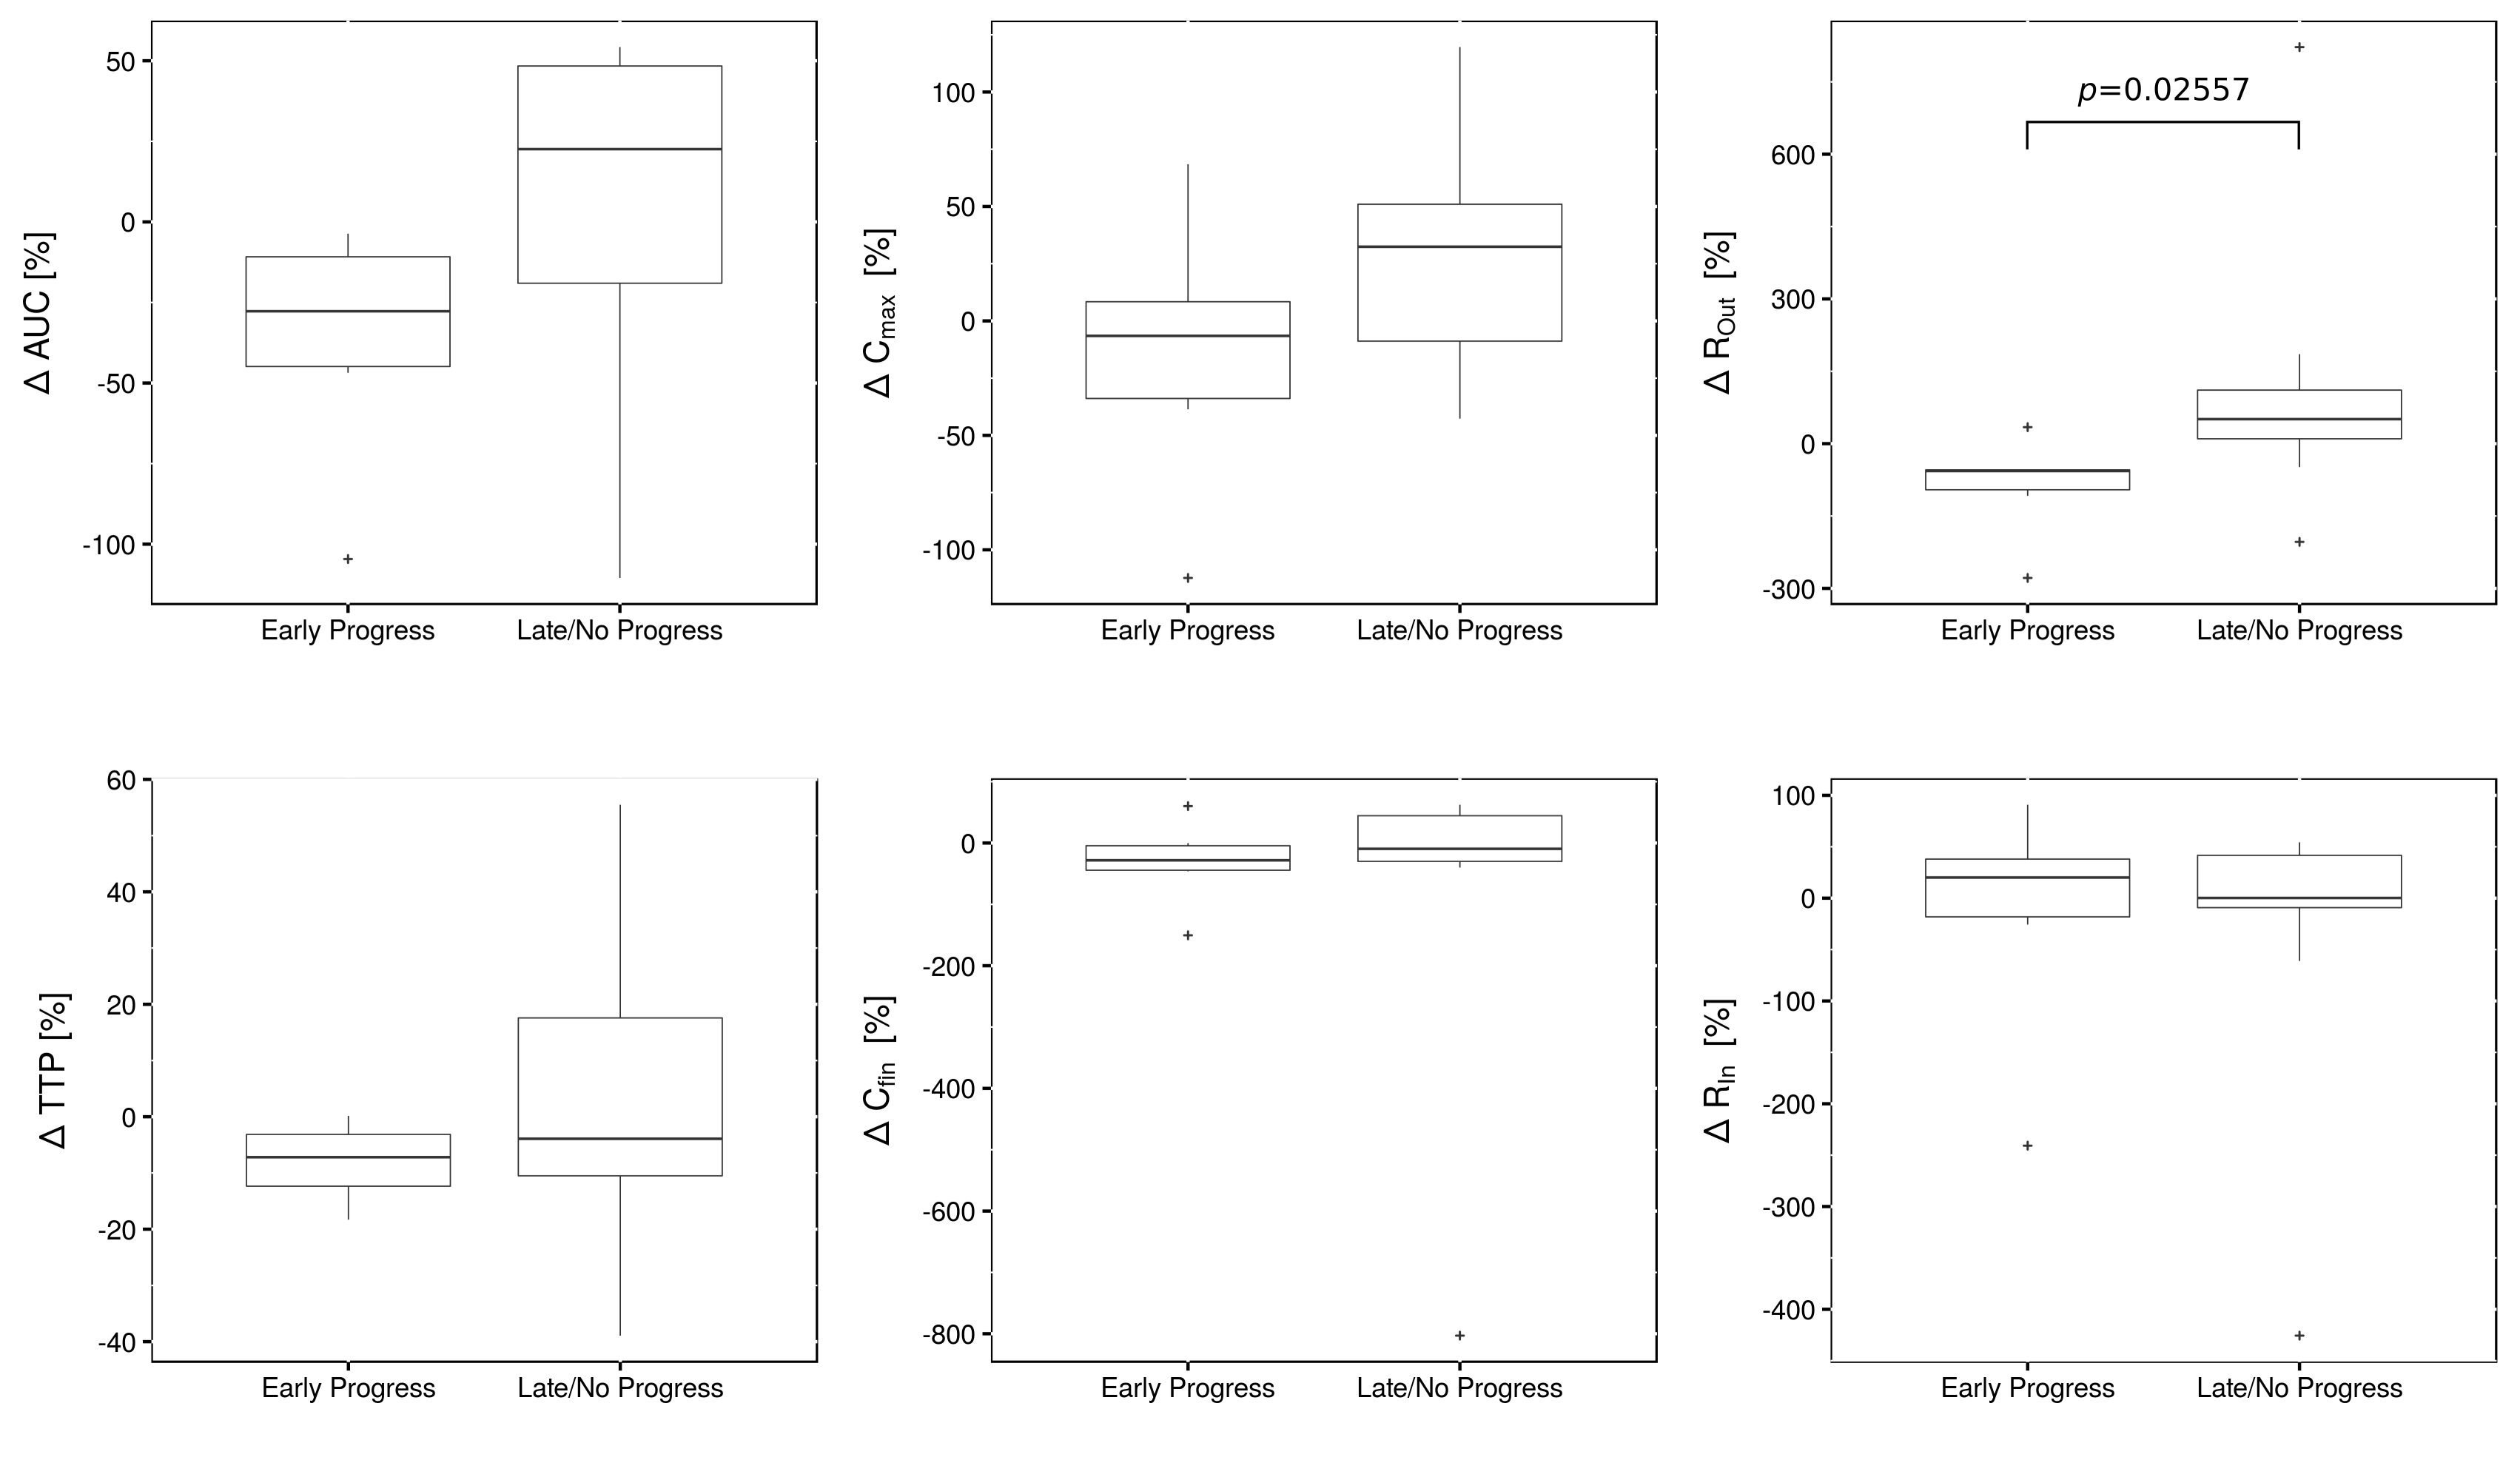
respectively, the percentage change of each parameter with respect to the pre-RT
values was calculated (Fig.4): $$\Delta \phi [\%]= \frac{\phi_{beforeRT}- \phi_{FU}}{\phi_{beforeRT}}\cdot 100\%$$.
It could be observed, that patients with LP showed decrease in parameters ROut and Cmax after RT ($$$\Delta \phi >0$$$), whereas these parameters showed almost no change in EP patients. For ROut, this difference was significant (-56.7% vs. 50.8%, p=0.0256, Mann-Whitney-U-test). AUC decreased in LP patients and increased in EP patients. Parameters Cfin, BAT and TTP showed no changes after RT in both groups.
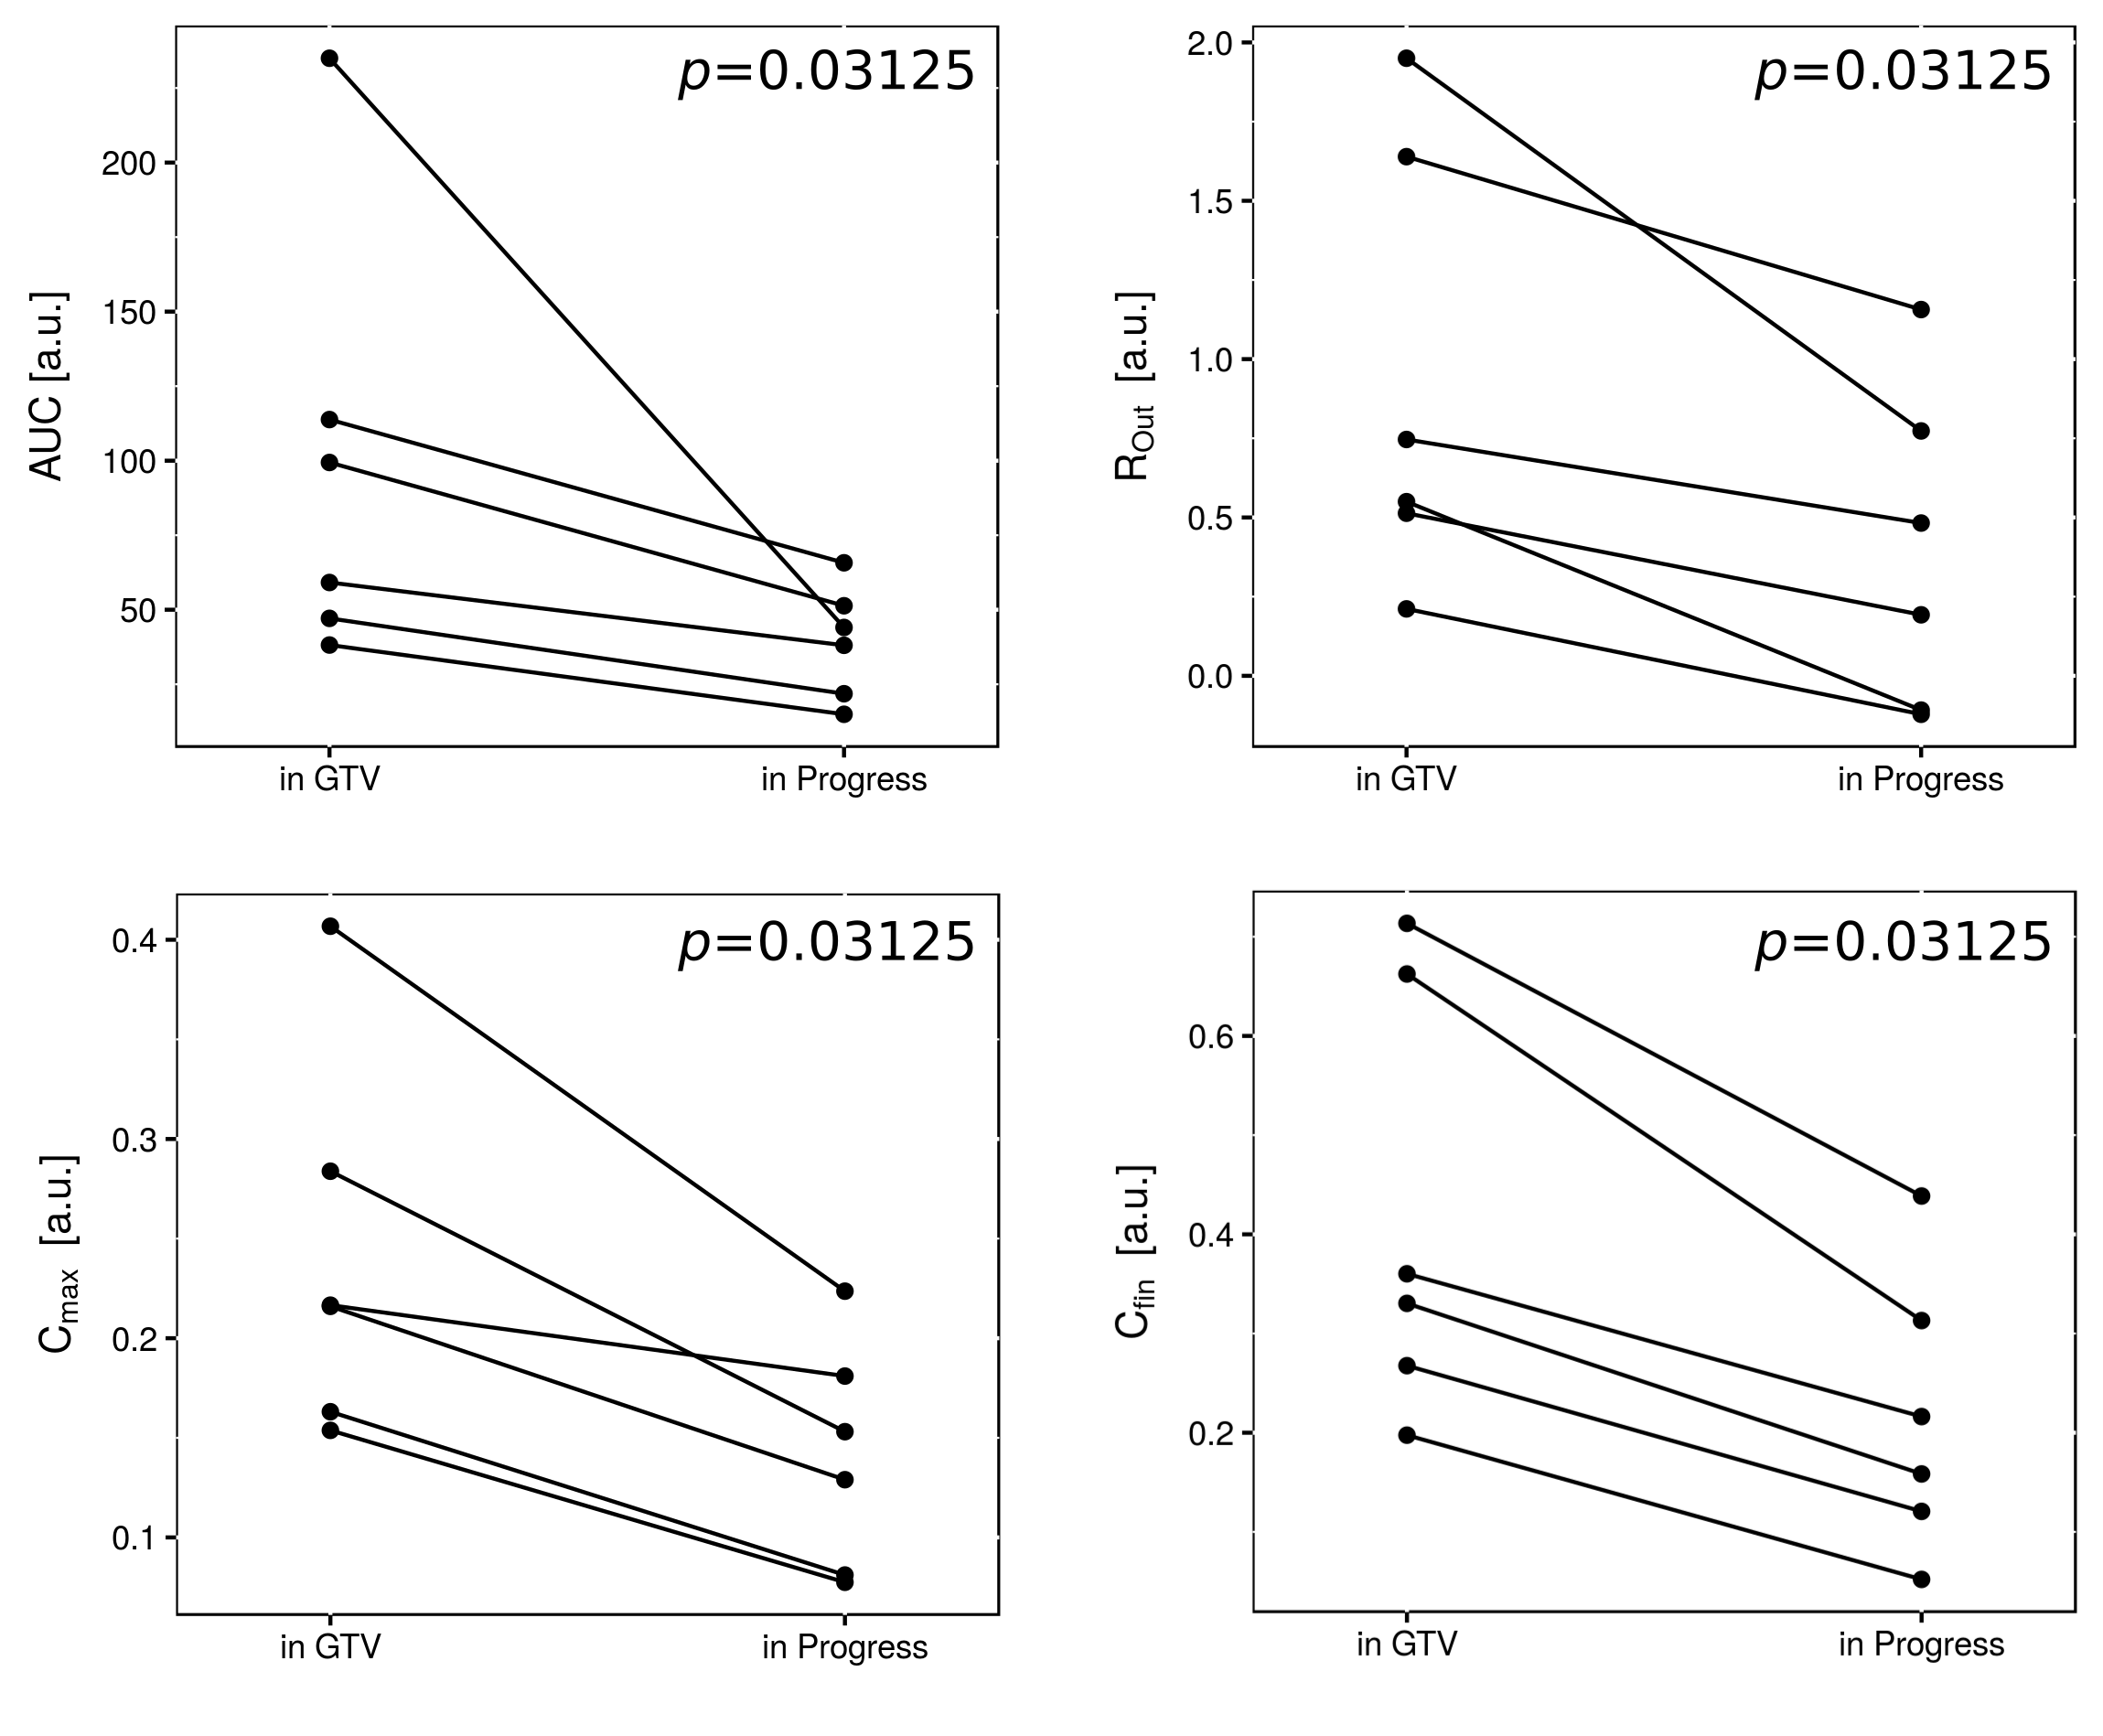
Parameters AUC, ROut, Cmax and Cfin were significantly lower in the progressed volumes compared to GTV (Fig. 5). There was a tendency towards lower values in P for RIn, which did not reach significance.
Conclusion
Our results show, that response to carbon irradiation is related to changes in tumor perfusion (related to AUC) and leakiness of the capillaries (related to RIn / ROut). Patients with EP showed tendencies towards higher values in AUC, ROut, Cmax, whereas these values decreased after therapy in LP patients who initially responded to therapy. More aggressive tumors that were unaffected by treatment, could be identified based on elevated perfusion and leakiness before RT. We demonstrated the value of DCE MRI for response assessment in carbon RT and identification of progress after therapy. Higher patient numbers need to be investigated to improve statistical power of these findings.Acknowledgements
No acknowledgement found.References
1. Nieder C, Grosu AL, Mehta MP, Andratschke N, Molls M. Treatment of malignant gliomas: radiotherapy, chemotherapy and integration of new targeted agents. Expert Rev. Neurother. 2004;4:691–703. doi: 10.1586/14737175.4.4.691.
2. Niyazi M, Siefert A, Schwarz SB, Ganswindt U, Kreth F-W, Tonn J-C, Belka C. Therapeutic options for recurrent malignant glioma. Radiother. Oncol. 2011;98:1–14. doi: 10.1016/j.radonc.2010.11.006.
3. Debus J, Abdollahi A. For the next trick: new discoveries in radiobiology applied to glioblastoma. Am. Soc. Clin. Oncol. Educ. Book Am. Soc. Clin. Oncol. Meet. 2014:e95-99. doi: 10.14694/EdBook_AM.2014.34.e95.
4. Sourbron S. Technical aspects of MR perfusion. Eur. J. Radiol. 2010;76:304–313. doi: 10.1016/j.ejrad.2010.02.017.
5. Singh A, Rathore RKS, Haris M, Verma SK, Husain N, Gupta RK. Improved bolus arrival time and arterial input function estimation for tracer kinetic analysis in DCE-MRI. J. Magn. Reson. Imaging 2009;29:166–176. doi: 10.1002/jmri.21624.
6. Debus C, Floca R, Nörenberg D, Abdollahi A, Ingrisch M. Impact of fitting algorithms on errors of parameter estimates in dynamic contrast enhanced MRI. Phys. Med. Biol. [Internet] 2017. doi: 10.1088/1361-6560/aa8989.
7. Nolden M, Zelzer S, Seitel A, et al. The Medical Imaging Interaction Toolkit: challenges and advances. Int. J. Comput. Assist. Radiol. Surg. 2013;8:607–620. doi: 10.1007/s11548-013-0840-8.
Figures