3811
Susceptibility-based positive contrast for visualization and localization of implanted brachytherapy seeds in realistic prostate phantoms1Medical Physics, Ryerson University, Toronto, ON, Canada, 2Sunnybrook Research Institute, Toronto, ON, Canada, 3Medical Physics, Sunnybrook Health Sciences Centre, Toronto, ON, Canada, 4Medical Biophysics, University of Toronto, Toronto, ON, Canada, 5Odette Cancer Centre, Sunnybrook Health Sciences Centre, Toronto, ON, Canada, 6Radiation oncology, University of Toronto, Toronto, ON, Canada
Synopsis
Employing susceptibility-based positive contrast for depiction and localization of closely implanted elongated paramagnetic objects (i.e. brachytherapy seeds) is very challenging due to the orientation dependence and/or size overestimation of reconstructed object. In this study, 321 brachytherapy seeds were implanted in four realistic prostate phantoms; all phantoms were scanned at three different angles on a 1.5T MR scanner. A novel susceptibility-based workflow was proposed for visualization and localization of the seeds. For all scanning angles the reconstructed seed shapes, centroids and orientations were identical and no significant difference was found between the proposed method and the current clinically used CT-based method.
Introduction
Low‐dose‐rate (LDR) brachytherapy for prostate cancer involves permanent implantation of several (typically 60-100) radioactive sources within prostate, each encapsulated in a cylindrical titanium shell (seed,$$$4.5mm\times0.8mm$$$). The quality of the implant is evaluated through post-implant dosimetry which is currently based in most clinics on CT imaging1. Anatomical delineation is challenging on CT images due to poor soft-tissue contrast and efforts have been made to incorporate MRI into the post-implant dosimetry. Several MR acquisition/reconstruction techniques such as IRON2,3 pulse sequence, co_RASOR4 method, quantitative susceptibility mapping (QSM)5,6 and susceptibility gradient mapping (SGM)7 have been proposed for seed depiction with positive contrast however, all of theses techniques employ non-clinical pulse sequences, some require ultra-high field scanners and most importantly for all proposed techniques the shape of the reconstructed seed is strongly dependent on seed orientation with respect to the B0-field also, seed dimensions are often overestimated3–8, resulting in inaccurate localization of seeds for clinically-relevant configurations. To the best of our knowledge feasibility of the QSM for seed depiction and localization in realistic configurations has never been validated. In this study, we investigated the feasibility of a novel QSM-based workflow using four realistic prostate phantoms implanted with a total of 321 LDR seeds at different orientations.Methods
Realistic LDR brachytherapy seed implantation plans were generated based on the ultrasound of four multimodality realistic prostate phantoms (CIRS Inc. 053L model) with multiple lesions. Our current clinical process was followed for seed implantation and pre/post treatment planning. In total 321 dummy I-125 seeds (IsoAid AdvantageTM) were implanted into the prostates under ultrasound guidance by an experienced radiation oncologist. Post-implantation MRI scans were acquired on a 1.5T scanner (Philips Ingenia) with an 8-channel head coil array using a 3D multi-echo gradient echo sequence with the following parameters: TE1/TR=2.2/10.3ms; number-of-echoes=4; echo spacing=1.9ms; flip angle=20˚; resolution=1mm3 isotropic and matrix size=128x128x88. To investigate the orientation dependence of the susceptibility-based seed reconstruction, all phantoms were scanned at three different angles with respect to the B0-field: 0°,45° and 90°. All phantoms were CT scanned to validate the MR-derived seed positions against the clinical CT-based approach (MIM-Symphony-DxTM).
The QSM was performed in the following steps: (1) temporal/spatial phase unwrapping using Laplacian and region growing methods10–12, (2) background field removal using Projection onto Dipole Field (PDF) method13, (3) off-resonance frequency map $$$(f)$$$ estimation using exponential least square fitting:
$$ f_{r}\theta_{0r}=argmin_{f_{r}\theta_{0r}}\sum_{j=1}^{echoes}\parallel {M_{r,TE_{j}}e^{i\theta_{r,TE_{j}}}}-M_{r,TE_{j}}e^{i(f_{r}\times TE_{j}+\theta_{r,})}\parallel_2^2$$
where $$$M$$$ and $$$\theta$$$ denote magnitude and background removed phase
data respectively and $$$\theta_{r}$$$ denotes the initial phase.
(4) Morphology Enabled Dipole Inversion (MEDI) with regularized L1 minimization14–16:
$$ \chi_{r}=argmin_{\chi_{r}}\lambda\parallel W[e^{iD_{r}\chi_{r}}-e^{if_{r}}]\parallel_2^2+\parallel G_{M}G_{\chi}\parallel_{1}$$
where $$$χ$$$ is susceptibility , $$$λ$$$ is the Lagrangian multiplier, $$$D_{r}$$$ is Fourier domain dipole kernel, $$$W$$$ is a weighting matrix and $$$G$$$ is the gradient operator.
Seed positions (centroids, and orientations) were estimated using unsupervised machine learning by first thresholding the 3D susceptibility maps and converting them into point-cloud data; optimal number of seeds was calculated using Silhouette criterion18,19; constrained K-medoid clustering algorithm20,21 was utilized to find the optimal centroid, $$$c$$$ of each cluster (seed) by minimizing within-cluster sum-of-squares:
$$ j=argmin_{c}\sum_{i=1}^k\sum_{j=1}^{n}\parallel x_j^i-c_{i} \parallel^{2}$$
After finding the centroids the orientation of each seed was calculated using singular value decomposition and calculation of the eigenvector of each cluster21,22.
Results and Discussions
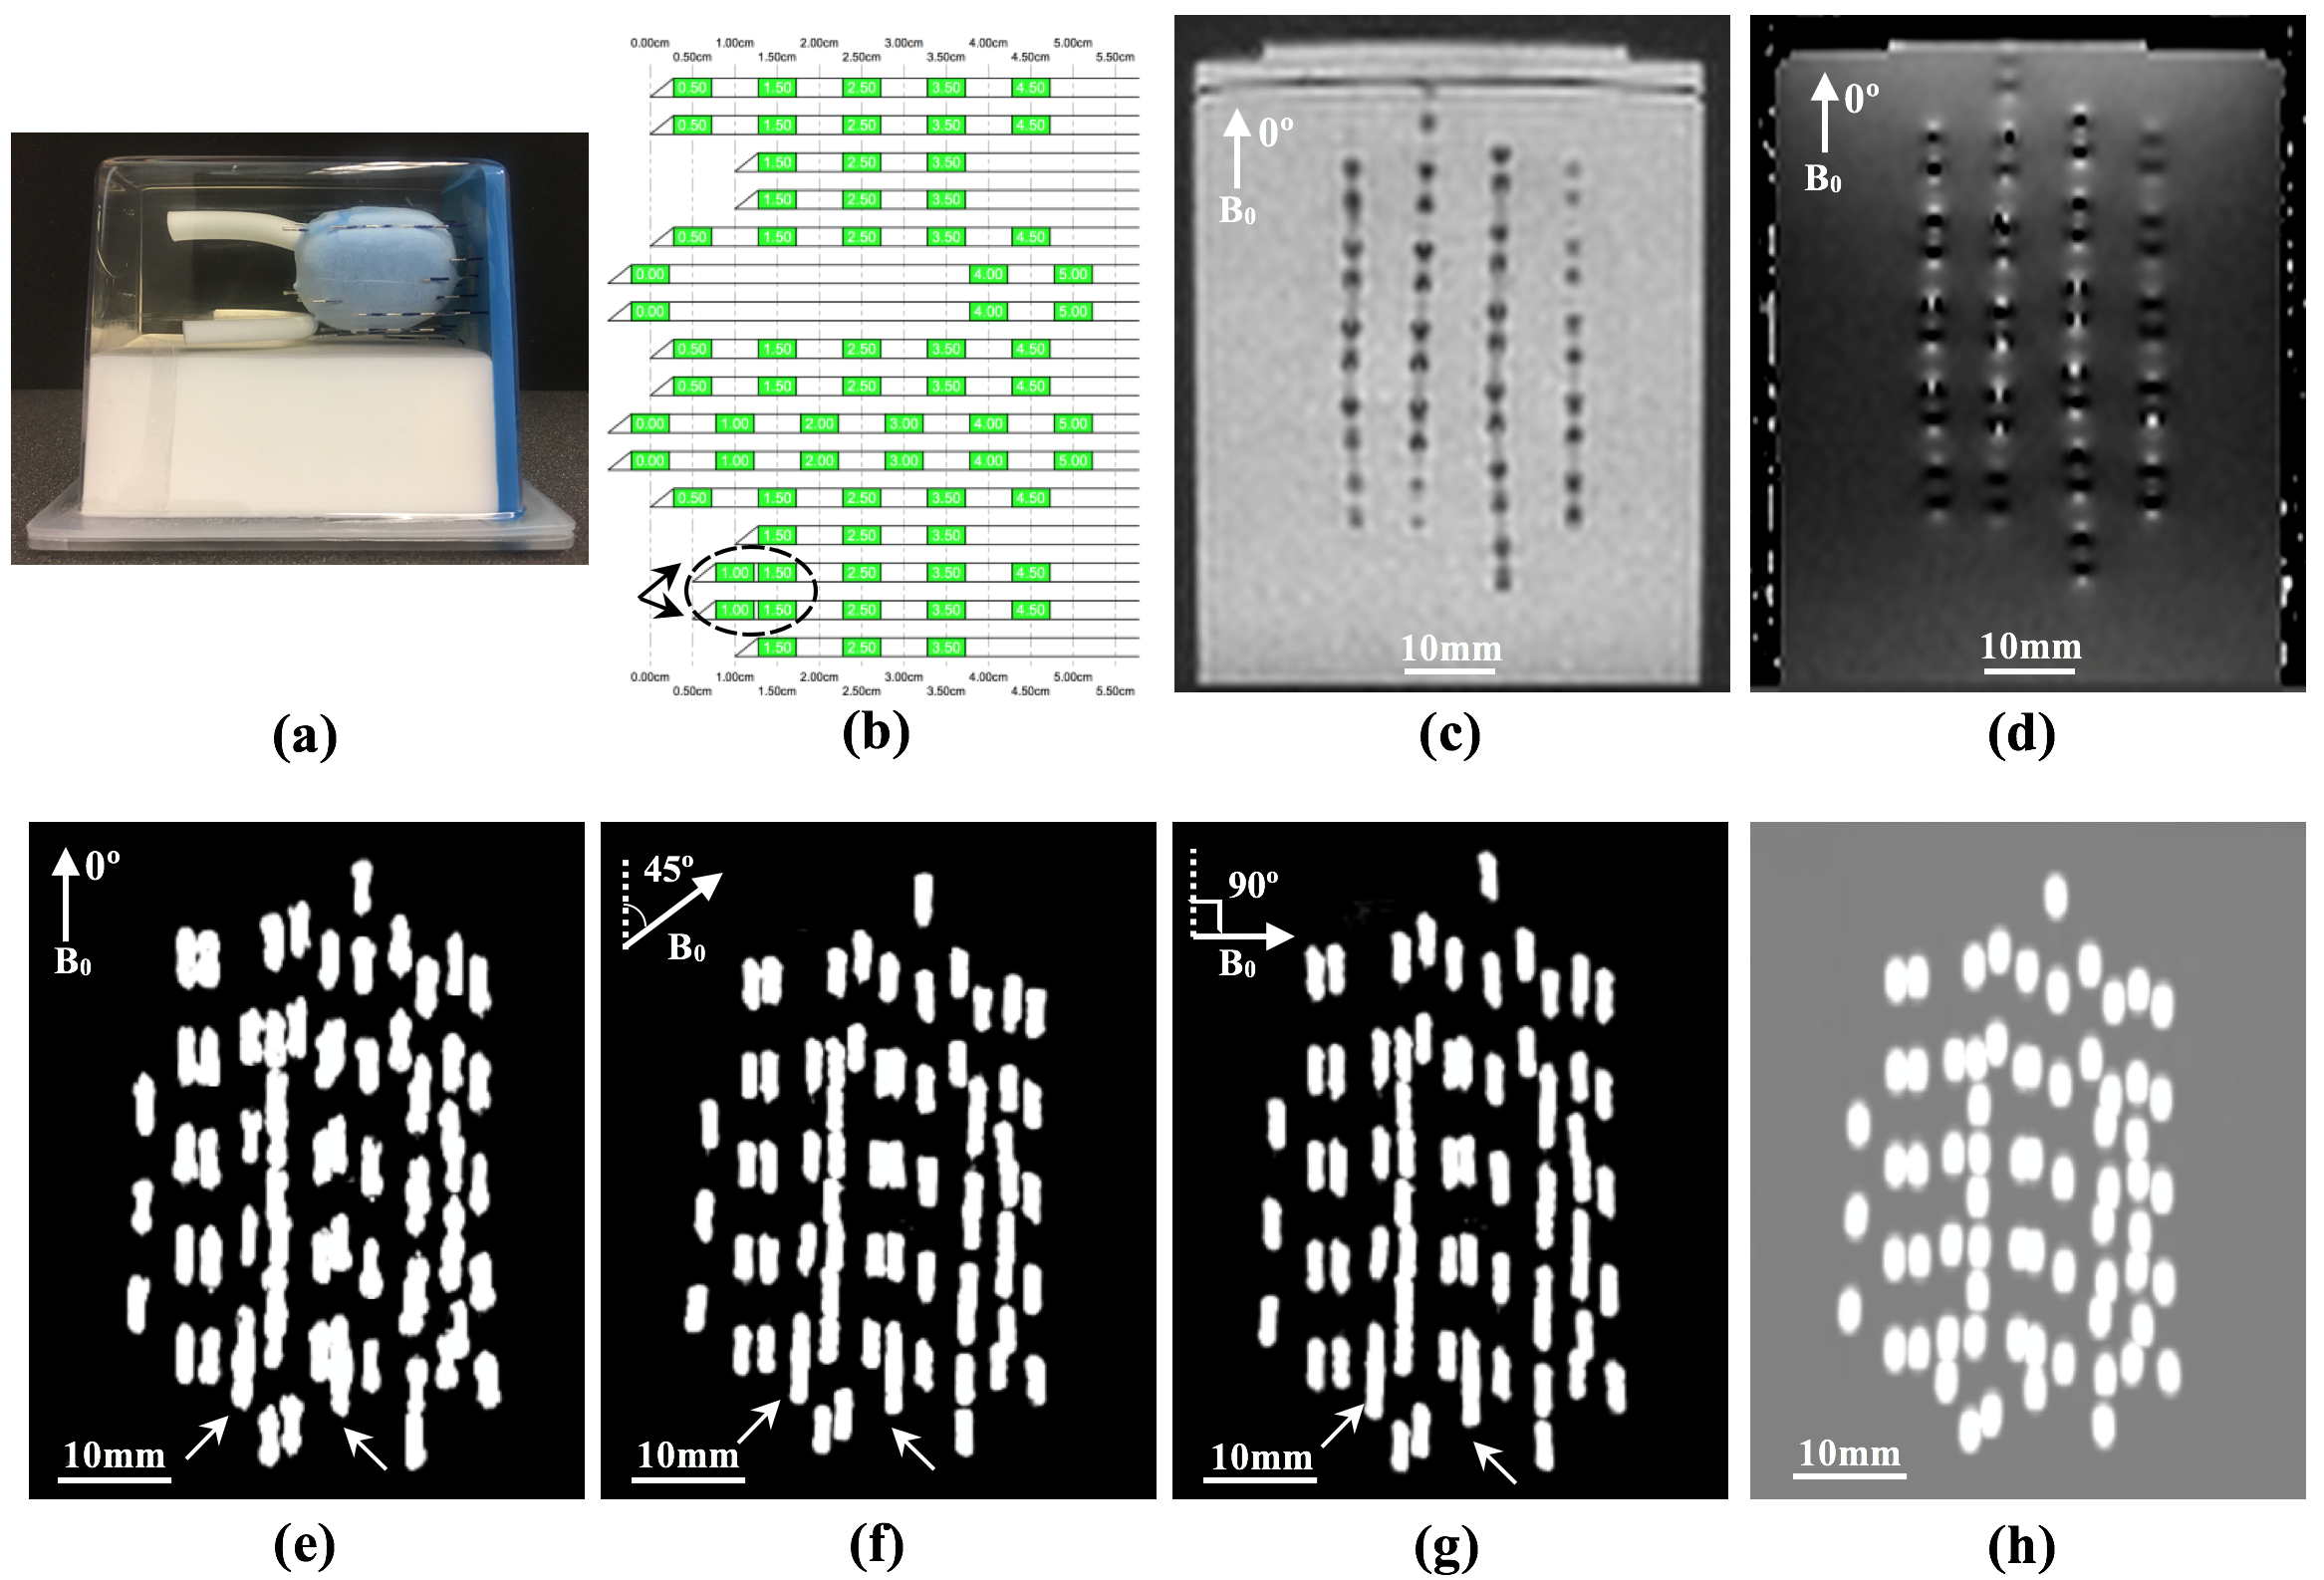
Fig.1 shows one of the phantoms containing 70 seeds, the corresponding seed implantation plan (with two pairs of non-spaced seeds), magnitude image, phase image, the calculated QSM at three different angles and the CT image. The proposed QSM pipeline successfully reconstructed the shape of all 321 seeds correctly regardless of their orientations. No significance difference was found between the estimated centroids on QSM acquired at different angles (p<0.05). The average length and diameter of the reconstructed seeds in all three orientations were 4.9±0.4mm and 0.9±0.2mm respectively reflecting an average 10% overestimation.
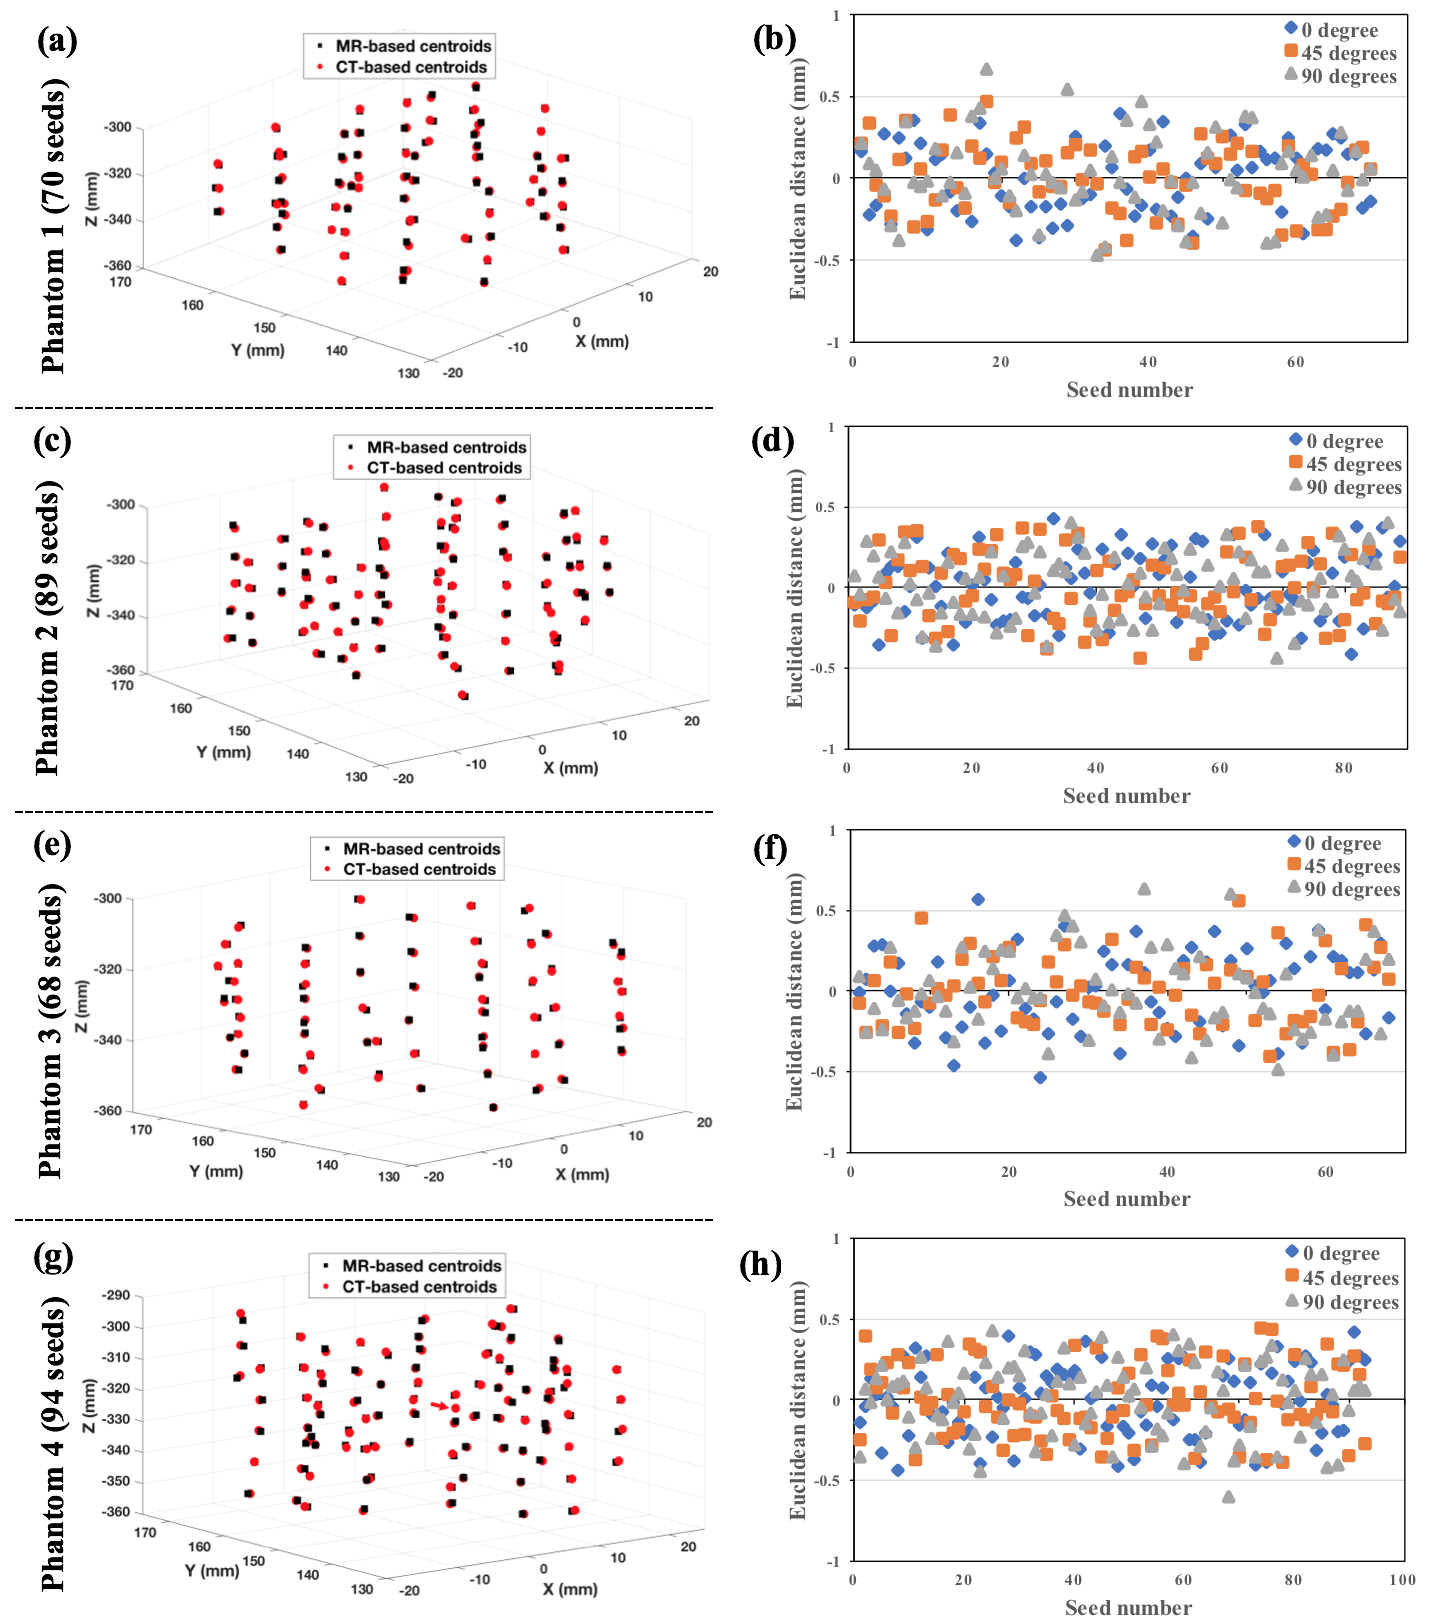
Fig.2 presents the calculated seed centroids on each phantom and the Euclidean distance between the estimated centroids at each angle using the proposed method and the CT-based method. The proposed seed localizer algorithm detected all seeds except the middle seed in the triple loading (shown by arrow in Fig.2-g). The estimated orientations of the seeds were compared to their hypothetical direction and the maximum deviation was less than 10º. There was no overall significant difference between the calculated centroids between the two methods (p<0.05). The overall average Euclidean distance between the proposed method and the CT-based approach was 0.3±0.2mm.
Conclusions
The proposed QSM-based pipeline allows for accurate visualization of the brachytherapy seeds regardless of their orientations in complex spatial configurations. The proposed seed localizer requires further improvements for localization of more than two non-spaced (clumped) seeds.
Acknowledgements
Authors would like to thank the IsoAid LLC for providing all of the seeds used in this study.References
1. Orio, P. F. et al. Effects of the Time Interval Between Prostate Brachytherapy and Postimplant Dosimetric Evaluation in Community Practice. Am J Clin Oncol 31, 523–531 (2008).
2. Stuber, M. et al. Positive contrast visualization of iron oxide-labeled stem cells using inversion-recovery with ON-resonant water suppression (IRON). Magn Reson Med 58, 1072–7 (2007).
3. Kuo, N., Lee, J., Tempany, C., Stuber, M. & Prince, J. MRI-BASED PROSTATE BRACHYTHERAPY SEED LOCALIZATION. Proc IEEE Int Symp Biomed Imaging 2010, 1397–1400 (2010).
4. de Leeuw, H., Seevinck, P. R. & Bakker, C. J. G. Center-out radial sampling with off-resonant reconstruction for efficient and accurate localization of punctate and elongated paramagnetic structures. Magn Reson Med 69, 1611–1622 (2013).
5. Dong, Y., Chang, Z., Xie, G., Whitehead, G. & Ji, J. X. Susceptibility-based positive contrast MRI of brachytherapy seeds. Magn Reson Med 74, 716–26 (2015).
6. Shi, C. et al. Accelerated susceptibility-based positive contrast imaging of MR compatible metallic devices based on modified fast spin echo sequences. Phys Med Biol 62, 2505–2520 (2017).
7. Dahnke, H., Liu, W., Herzka, D., Frank, J. A. & Schaeffter, T. Susceptibility gradient mapping (SGM): a new postprocessing method for positive contrast generation applied to superparamagnetic iron oxide particle (SPIO)-labeled cells. Magn Reson Med 60, 595–603 (2008).
8. Varma, G. et al. Positive visualization of implanted devices with susceptibility gradient mapping using the original resolution. Magn Reson Med 65, 1483–1490 (2011). 9. Bioucas-Dias, J. M. & Valadão, G. Phase Unwrapping via Graph Cuts. IEEE Trans IMAGE Process 16, (2007).
10. Li, W., Avram, A. V, Wu, B., Xiao, X. & Liu, C. Integrated Laplacian-based phase unwrapping and background phase removal for quantitative susceptibility mapping. NMR Biomed 27, 219–27 (2014).
11. Zhou, K., Zaitsev, M. & Bao, S. Reliable two-dimensional phase unwrapping method using region growing and local linear estimation. Magn Reson Med 62, 1085–1090 (2009).
12. Liu, T. et al. A novel background field removal method for MRI using projection onto dipole fields (PDF). NMR Biomed 24, 1129–1136 (2011).
13. Liu, T. et al. Nonlinear formulation of the magnetic field to source relationship for robust quantitative susceptibility mapping. Magn Reson Med 69, 467–76 (2013).
14. Liu, J. et al. Morphology enabled dipole inversion for quantitative susceptibility mapping using structural consistency between the magnitude image and the susceptibility map. Neuroimage 59, 2560–8 (2012).
15. Liu, T. et al. Morphology enabled dipole inversion (MEDI) from a single-angle acquisition: comparison with COSMOS in human brain imaging. Magn Reson Med 66, 777–83 (2011).
16. Liu, T. et al. Nonlinear formulation of the magnetic field to source relationship for robust quantitative susceptibility mapping. Magn Reson Med 69, 467–476 (2013).
17. Rousseeuw, P. J. Silhouettes: A graphical aid to the interpretation and validation of cluster analysis. J Comput Appl Math 20, 53–65 (1987). 18. Hartigan, J. A. & Wong, M. A. Algorithm AS 136: A K-Means Clustering Algorithm. J R Stat Soc 28, 100–108 (1979).
19. Sander, J., Ester, M., Kriegel, H.-P. & Xu, X. Density-Based Clustering in Spatial Databases: The Algorithm GDBSCAN and Its Applications. Data Min Knowl Discov 2, 169–194 (1998).
20. Park, H.-S. & Jun, C.-H. A simple and fast algorithm for K-medoids clustering. Expert Syst Appl 36, 3336–3341 (2009).
21. Henry, E. R. & Hofrichter, J. Singular value decomposition: Application to analysis of experimental data. Methods Enzymol 210, 129–192 (1992).
Figures