3810
Repeatability of Quantitative Imaging on the MR-Linac for Treatment Response Monitoring1Department of Radiation Oncology, The Netherlands Cancer Institute, Amsterdam, Netherlands, 2MR Clinical Science, Philips, Best, Netherlands
Synopsis
The MR-Linac opens the possibility for accurate daily treatment response monitoring. Quantitative MR imaging is a promising tool to quantify day-to-day changes. Therefore the performance of quantitative imaging of the MR-Linac needs to be assessed. In this study, we investigated the repeatability of T2 and ADC mapping using test-retest data of patients with prostate cancer. We calculated the within-patient coefficient of variation (wCV) and compare this to data from a conventional diagnostic 3T scanner. The MR-Linac performs similar to the diagnostic scanner regarding T2 mapping as wCV values are comparable. However, the repeatability for ADC mapping is lower on the MR-Linac.
Introduction
With the introduction of the MR-Linac daily MR imaging of the tumor, typically over the course of several weeks, opens the possibility for accurate treatment response monitoring. Quantitative MR imaging could be very useful for this purpose1. However, the adjusted design of the MR-Linac compared to conventional diagnostic scanners could influence the repeatability of quantitative imaging. In this study, we analyzed the repeatability of the apparent diffusion coefficient (ADC) and T2 maps by test-retest scans of prostate cancer patients on the MR-Linac and compared the results to repeatability on a conventional diagnostic scanner.Materials & Methods
Test-retest scan data of two patients with prostate cancer and a healthy volunteer were acquired on the MR-Linac (Elekta Unity, Elekta AB, Stockholm, Sweden) before radiation treatment, with more than one day in between. The protocol included T2-weighted imaging, diffusion weighted imaging (DWI), and an accelerated multi-echo spin echo (ME-SE) sequence for T2 mapping2. ADC maps were calculated from the DWI images using b-values of 200 and 800 s/mm2. From the ME-SE data a T2 map was calculated using the scanner software. The same images were acquired with a similar protocol for 9 patients on a diagnostic 3T Achieva scanner (Philips Healthcare, Best, The Netherlands). Acquisition parameters for both systems are given in Table 1. To enable a voxel-level comparison, T2 and ADC maps were rigidly registered to the T2-weighted image (voxel size 0.5 x 0.5 x 1.2 mm3) of the same day. Then, the re-test T2-weighted image was registered to the test T2-weighted image using deformable image registration. The same transformation was subsequently applied to the re-test T2 and ADC maps. The within-subject coefficient of variation (wCV) was calculated of the T2 and ADC maps for each patient2. A log transform was performed when the variation between the two maps was dependent on the mean value3. The images were smoothed with an increasing kernel size and the wCV was calculated to assess the dependence of the wCV on the smoothing kernel volume size. At voxel level, the wCV is mainly influenced by imaging noise, which is reduced by increasing the ROI size, leaving the effect of daily variations in the patient and machine.Results
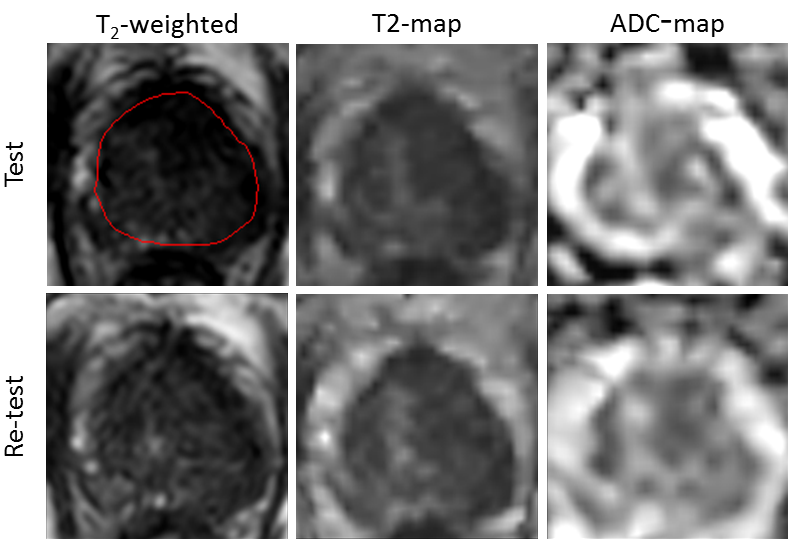
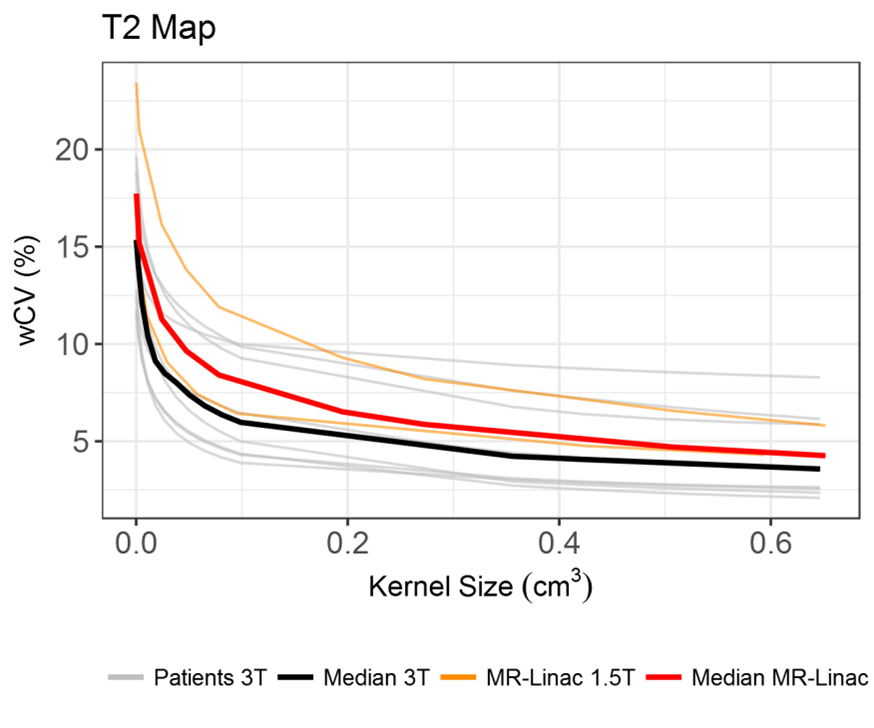
The quality of MR-Linac images is presented in Figure 1, showing test and re-test data of the T2-weighted image and the T2 and ADC map of the prostate. The repeatability of the T2 maps was similar for both scanners, with a median wCV of 5.9% (range 3.9 - 10.0%) for the 3T scanner and 8,0% (range 6,4 – 11,3%) for the MR-Linac at a smoothing kernel size of 0.1 cm3. Figure 2 shows the result of the increasing smoothing kernel size on the wCV of the T2 maps, where a clear reduction in the wCV was found for all subjects. At a smoothing kernel size of 0.5 cm3, the median wCV of the 3T scanner was 3.9% (range 2.6 – 8.6%) and of the MR-Linac 4.7% (range 4.5 – 6.6%). The difference in repeatability of the ADC maps was larger between the two scanners, with a median wCV of 4.5% (range 3.4 – 5.8%) for the 3T scanner and 12.5% (range 7.4 – 24.7%) for the MR-Linac at an ROI size of 0.1 cm3. The upper value of this last range is a result of large amount of air in the rectum of one of the patients, which created distortions in the ADC map at the posterior side of the prostate. When only taking the anterior part into account, the wCV decreased from 24.7 to 9,9%.Conclusion
In this study, we showed the feasibility of quantitative imaging in prostate cancer patients on the MR-Linac. When compared to the diagnostic 3T scanner, the MR-Linac produced comparable repeatability results for T2 mapping. For ADC mapping, the MR-Linac repeatability values were lower compared to the diagnostic 3T scanner. The difference in this repeatability can be explained by the fact that the protocols were not matched to have exactly the same SNRAcknowledgements
No acknowledgement found.References
1. Foltz, W. D. et al. Changes in apparent diffusion coefficient and T2 relaxation during radiotherapy for prostate cancer. J. Magn. Reson. Imaging 37, 909–916 (2013).
2. van Houdt, P. J. et al. Performance of a fast and high-resolution multi-echo spin-echo sequence for prostate T2 mapping across multiple systems. Magn. Reson. Med. 0, (2017).
3. Bland, J. M. & Altman, D. G. Statistics Notes: Measurement error proportional to the mean. BMJ 313, 106–106 (1996).
Figures
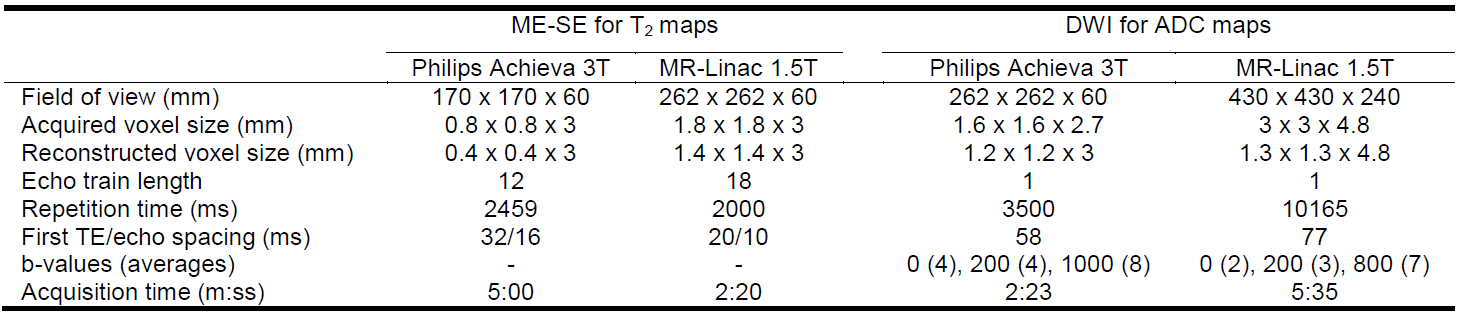
Table 1. MRI acquisition parameters.
Figure
2. Repeatability of T2 mapping on both a 3T diagnostic scanner
and the 1.5T MR-Linac. The gray lines each represent a patient examined on the
3T scanner. The black line shows the median of these patients. The orange lines
show the subjects from the MR-Linac, and the red line the median of these
subjects.