3809
A Magnetic Resonance Imaging (MRI) and Computed Tomography (CT) compatible anthropomorphic pelvic phantom for MRI-guided radiotherapy.1Radiation Oncology, University of California Los Angeles, Los Angeles, CA, United States
Synopsis
We present an anthropomorphic pelvic phantom for MR-guided radiotherapy. Materials were selected to mimic bone, fat and muscle and produce tissue-like contrast with T1, T2 and T2* weighted MRI sequences and CT. MR and CT tissue quantification results are presented. A comparison between the phantom and patient images acquired using standard prostate radiotherapy MR sequences is presented. The study concludes with an example application of the phantom where we compare the visibility of an implanted gold fiducial marker in phantom and in vivo.
Purpose
The purpose of this work is to produce a phantom capable of generating tissue-like contrast when scanned with T1, T2 and T2* weighted MRI sequences and CT. Our institution is planning on replacing our only CT simulator with an MRI for treatment planning. Anthropomorphic phantoms will allow for testing various aspects of MRI-guided radiotherapy, including the visibility of implanted fiducial markers, development of new sequences and testing synthetic CT images. Commercially available phantoms are limited because they produce tissue-like contrast for specific MR sequences and are typically optimized for a single application.Methods
The anthropomorphic prostate phantom was constructed to mimic three types of tissue: muscle, fat and bone. Porcine fat was used to mimic human fat. A solidified gelatin, CaCO3 and porcine muscle mixture was used to mimic human muscle. A solidified gelatin and CaCO3 mixture was used to mimic human bone.
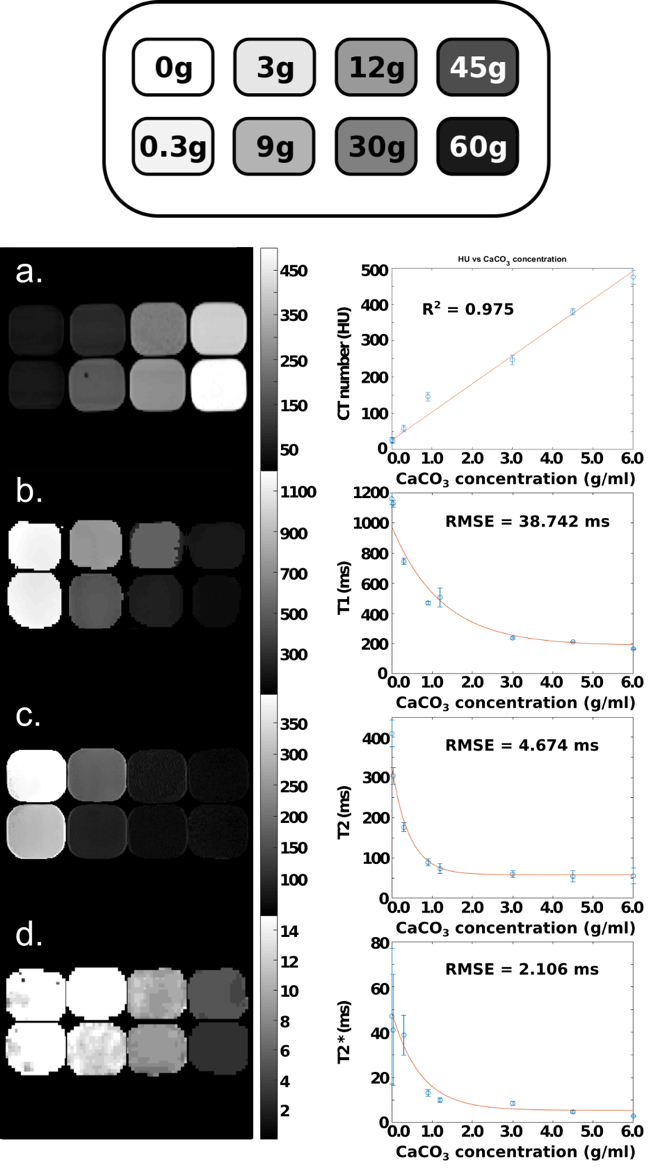
A tissue validation phantom containing gelatin mixed with increasing concentrations of CaCO3 in different compartments was constructed to optimize the signal for muscle and bone. T1, T2, T2* and HU mapping was performed on the validation phantom and MRI scans were acquired on a 3T Siemens Skyra (Siemens, Munich, Germany). T1 maps were created using the voxel-to-voxel null times acquired from an inversion-recovery turbo-spin-echo (TSE) sequence image. T2 maps were created using a voxel-to-voxel fit based on the following equation:
Si(TE,TR) = S0 (1 - 2e-(TR-TE/2)/T1 + e-(TR/T1)) e-TE/T2
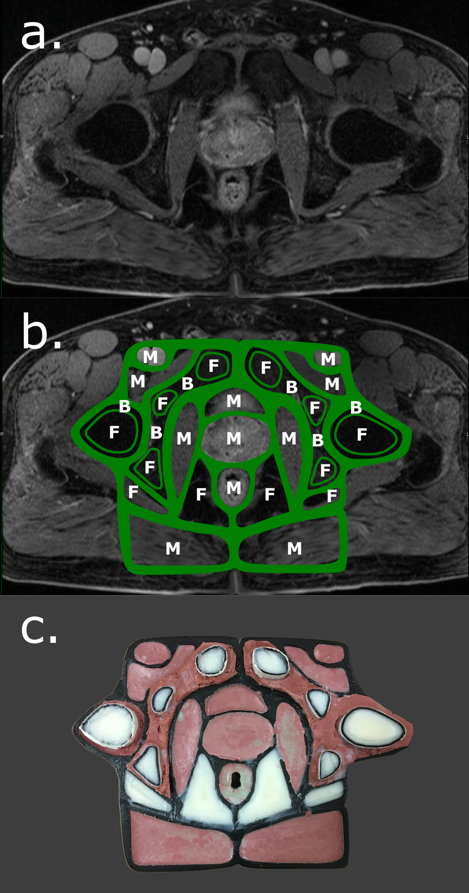
where Si(TE,TR) is the measured signal at time TE, S0 is the signal before gradient field perturbation, TE and TR are the echo and repetition times respectively [1]. T2* maps were created using a gradient-echo (GRE) sequence and fitting the data to an exponential decay. The final bone and muscle material choices were based on running an optimization to find a CaCO3 concentrations such that the T1, T2, T2* and HU values were close to values reported in the literature [1]. The phantom design was based on contours drawn on a patient image in Autodesk Inventor (Autodesk Inc., Venice, CA) and the phantom structure was 3D printed on a MakerGear M2 (MakerGear, Beachwood, OH) (Figure 1). The phantom was validated by comparing the relative bone, muscle and fat signals to patient images. Three prostate cancer patients who received fiducial marker implantation prior to MR imaging were retrospectively selected. Each patient had a T1-TSE, T2-TSE and fat-suppressed GRE image acquired on a 3T Siemens Skyra. CT simulation images were also acquired. Region-of-interest (ROI) contours were drawn in intra-pelvic fat packs, gluteal muscles, pelvic bone and air. The mean patient fat, muscle and bone signal-to-noise-ratios (SNR) were calculated. The fat-muscle and fat-bone contrast-to-noise-ratio (CNR) were calculating using Sf - Sm,b where Sf is the fat signal and Sm,b is the muscle or bone signal. In an example application, gold fiducial marker visibility was quantified by the CNR between the marker and prostate background.
Results
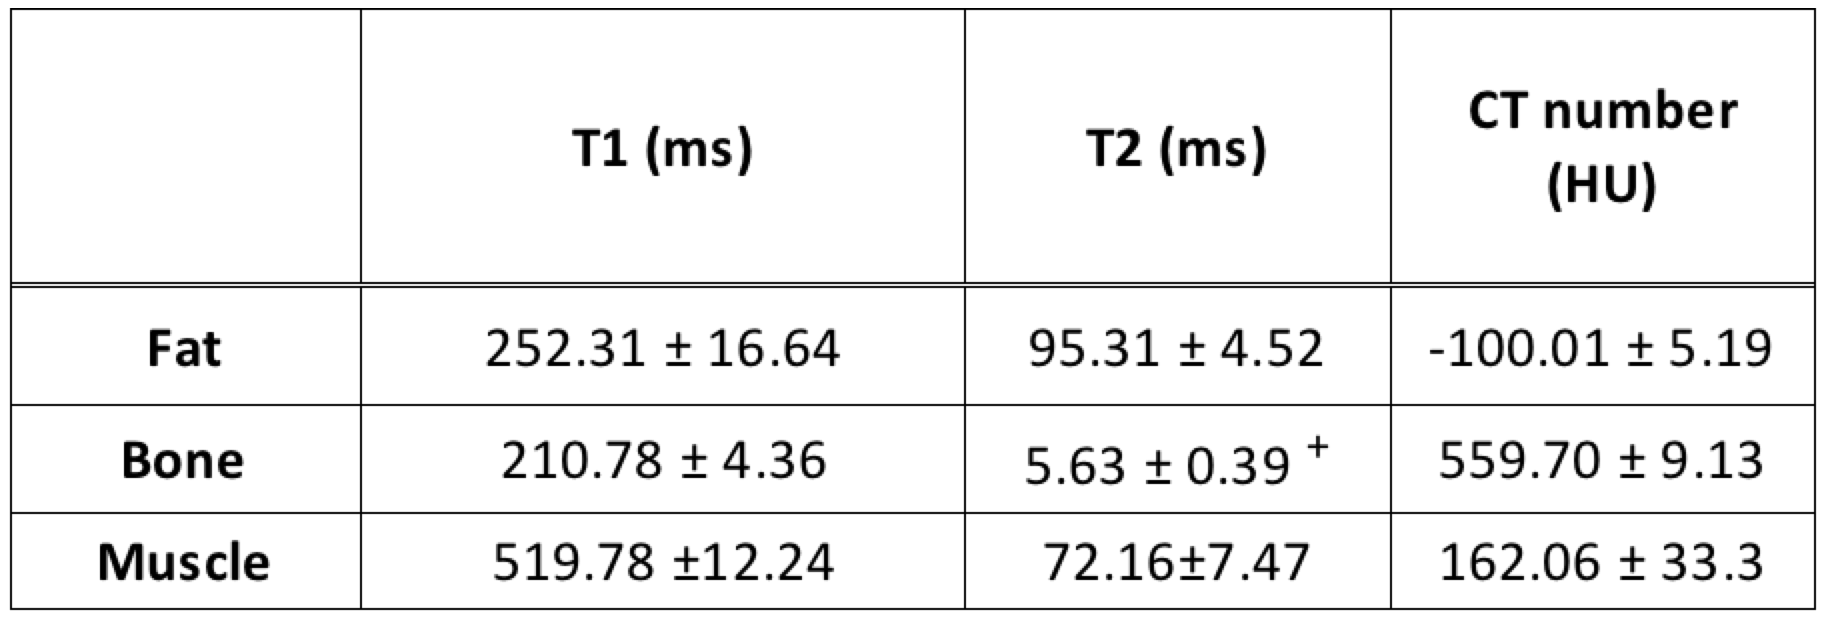
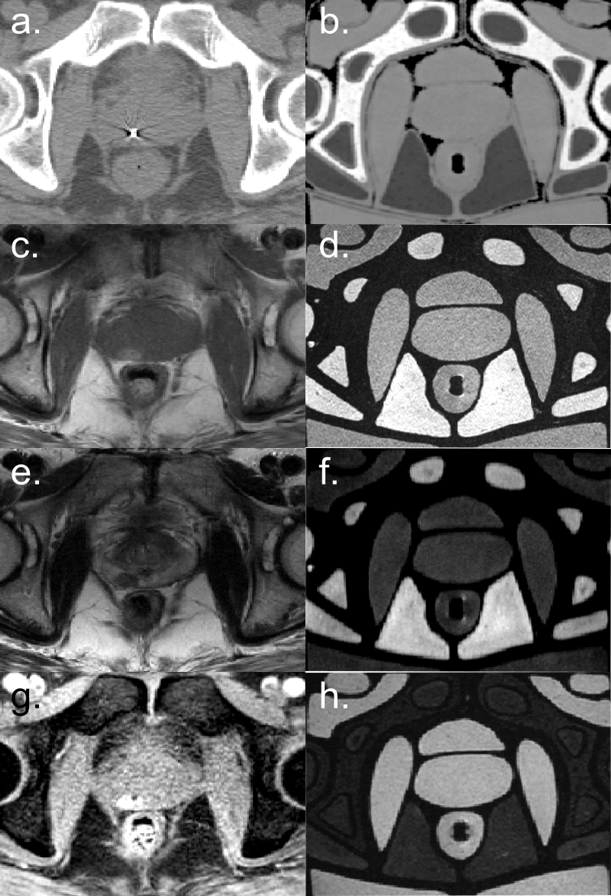
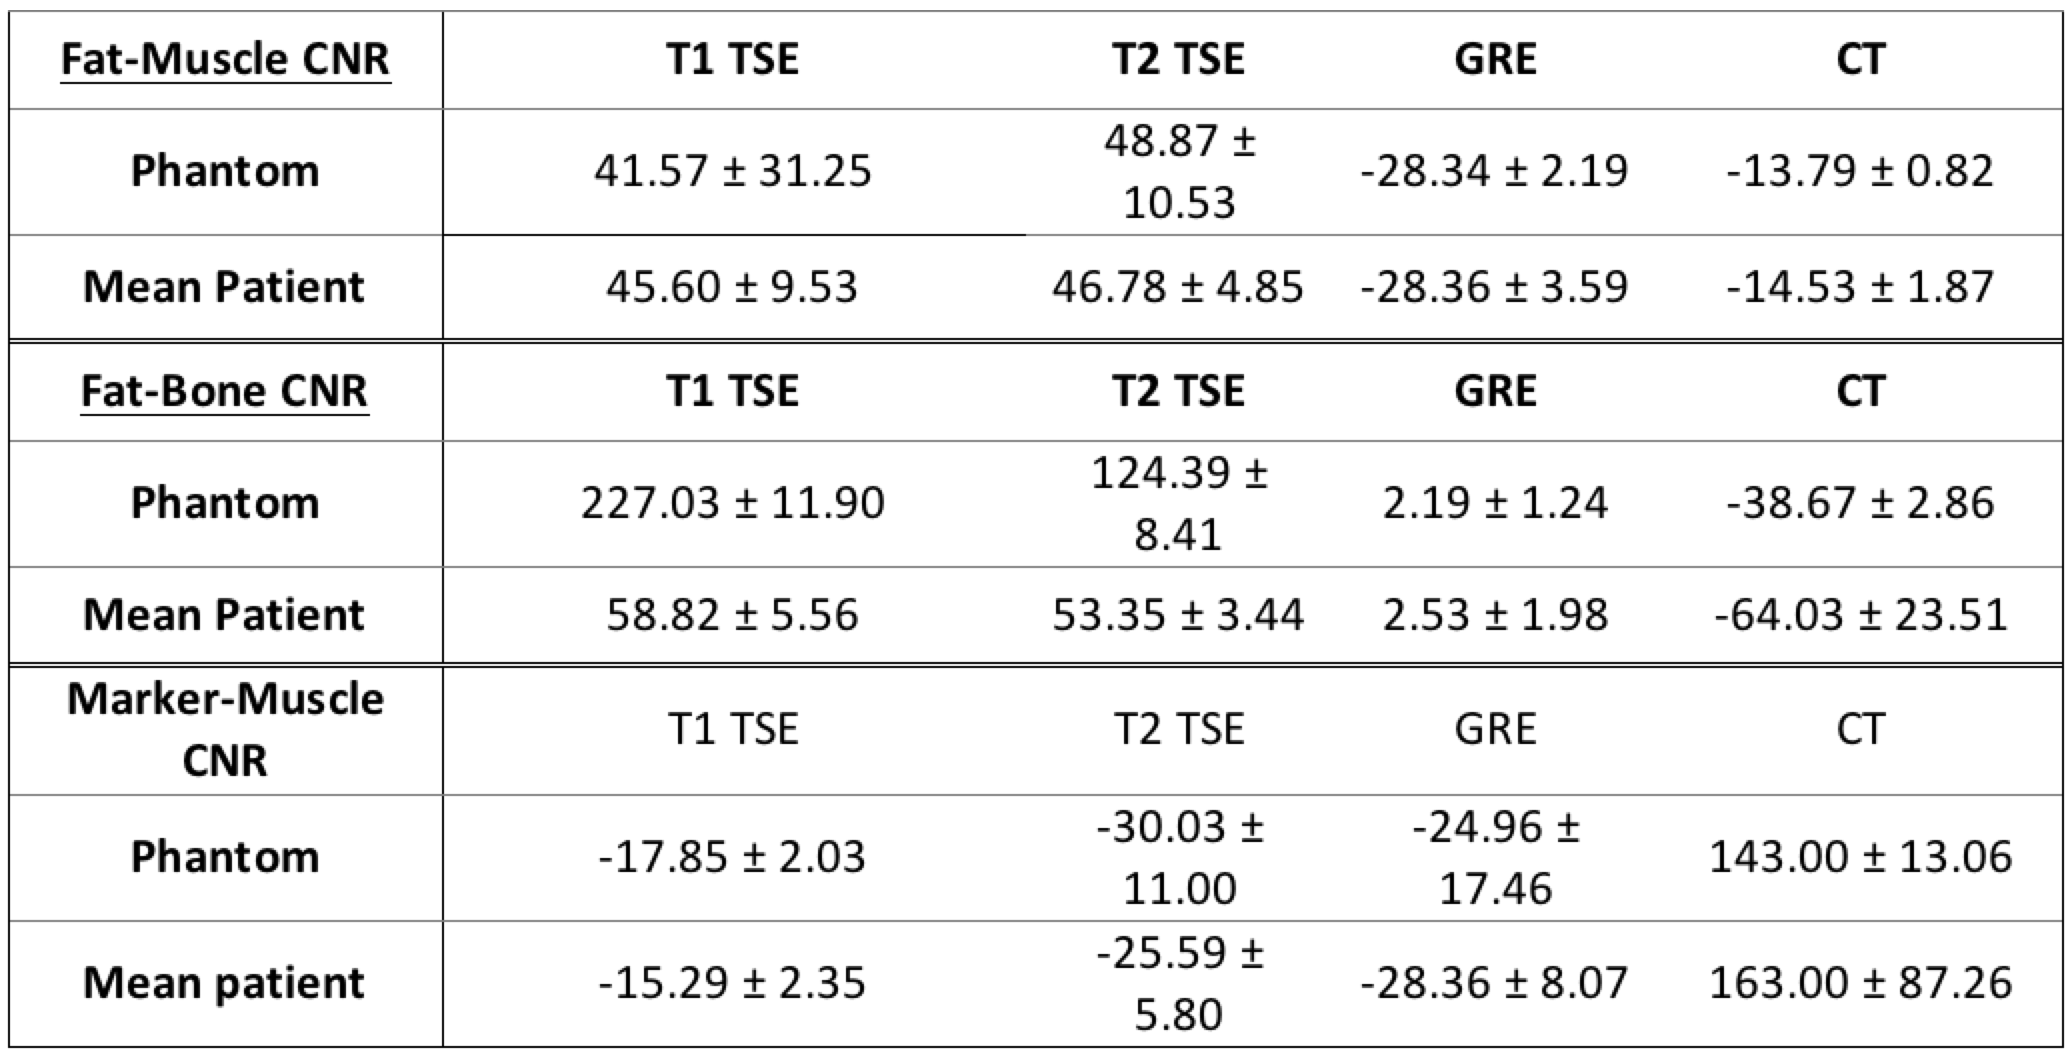
The T1, T2, T2* and CT number maps are presented in Figure 2. The variation in T1, T2 and T2* and CT number with respect to CaCO3 concentration and corresponding fits are also shown in Figure 2. The T1, T2, T2* and CT numbers for fat, muscle and bone materials are reported in Figure 3. A qualitative comparison between T1-TSE, T2-TSE, fat suppressed GRE and CT images from a prostate cancer patient and the phantom is shown in Figure 4. Fat-muscle and fat-bone CNR values for the phantom and patients were calculated and are reported in Figure 5. The marker-prostate CNR values for patient and phantom are also reported in Figure 5.Discussion
The phantom reasonably represents patient tissue using easily accessible materials. The T1 and T2 relaxation times for muscle and fat do not perfectly match with literature. For example, our muscle mixture had a T1 of 520 ms while Bojorquez et al reported a T1 of 1295 ms for skeletal muscle when scanned on a 3T bore [3]. However, the differences in T1 and T2 between muscle and fat are sufficient to produce tissue-like contrast. The phantom fat-muscle CNR agrees within 8.8% compared to the patient. The phantom marker-prostate CNR agrees within 15% compared to the patient for all of the tested MR sequences and CT. We conclude that this phantom can be used to evaluate the visibility of implanted fiducials for MR-alone treatment planning.Conclusion
We have developed an anthropomorphic phantom capable of producing tissue-like contrast with T1, T2, T2* weighted MR sequences and on CT. This phantom has the potential of being used for testing various aspects of MRI-guided radiotherapy, including the visibility of implanted fiducial markers.Acknowledgements
The authors would like thank Yu (Summer) Gao and Professor Peng Hu for their assistance with MR scanning.References
[1] R.W. Brown, Y.-C.N. Cheng, E.M. Haacke, M.R. Thompson, and R. Venkatesan, in Magnetic Resonance Imaging (John Wiley & Sons, Inc., 2014), pp. 113–139.
[2] J.Z. Bojorquez, S. Bricq, F. Brunotte, P.M. Walker, and A. Lalande, MAGMA 29, 777 (2016).
[3] J.Z. Bojorquez, S. Bricq, C. Acquitter, F. Brunotte, P.M. Walker, and A. Lalande, Magnetic Resonance Imaging 35, 69 (2017).
Figures