3808
Comparative evaluation of DTI and FLAIR images in assessment of whole pathological region in GBM patients for RT planning; a semi-automatic segmentation approach1Quantitative MR Imaging and Spectroscopy Group, Research Center for Cellular and Molecular Imaging, Institute for Advanced Medical Imaging, Tehran University of Medical Sciences, Tehran, Iran (Islamic Republic of), 2Clinical Oncology, Shahid Beheshti University of Medical Science, Tehran, Iran (Islamic Republic of), 3Payambaran Imaging Center, Tehran, Iran (Islamic Republic of)
Synopsis
Accurate determination of whole pathological region is still a challenging task and necessary prerequisite step in radiotherapy planning in GBM. This study attempted to propose semi-automatic segmentation method that can extract whole pathogenic tumor on T2-FLAIR and isotropic component (p-map) of diffusion tensor imaging(DTI) with over 90 % sensitivity,
Introduction
Glioblastoma Multiform (GBM) is the most aggressive brain tumors in adults1. Unclear and irregular boundaries are prominent aspects of GBM that make tumor delineation infeasible and their margins are not always able to define using conventional MRI2.To gain some insight into the spatial extension of GBM into normal tissue, an image fusion approach (T2-FLAIR/DTI-p map) was used in this study.Methods
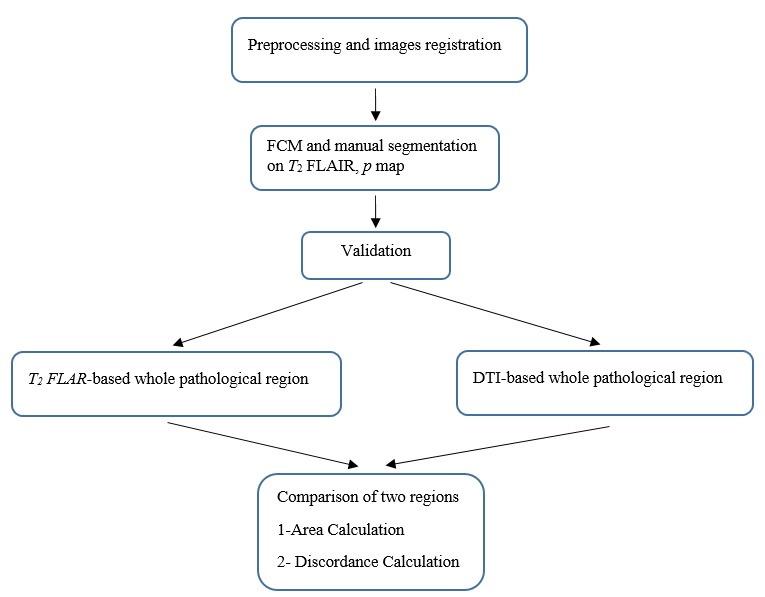
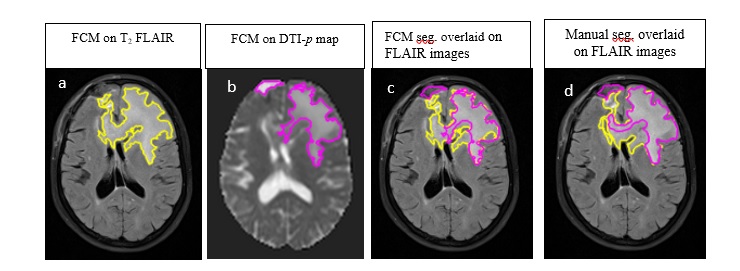
A total of 15 patients with GBM participated in this study who were candidate for radiotherapy. T2 FLAIR, T1C and T2 weighted MRIs and diffusion tensor imaging (DTI) were performed before radiotherapy. Flowchart for the entire procedure is shown in Figure1. DTI-p map and T2-FLAIR images were co-registered in SPM12 software3. In the first step, Fuzzy C-means (FCM)-Region Growing clustering approach was implemented for the segmentation of the images 4. T2-FLAIR images are classified into four classes: tissues with high hyperintensity values (necrosis, tumor hemorrhages and cysts), tissues with intermediate intensity (edema), tissues with hypointensity values (scalp, normal white and gray matter) and tissue with zero intensity (CSF, skull, background). DTI-p maps are classified into four clusters: tissues with high hyperintensity values (tumor hemorrhages, cysts and CSF), tissues with intermediate intensity (edema), tissues with hypointensity values (normal white and gray matter), and regions with zero intensity (background). The semiautomatic segmentation method was applied to each patient's MRI data individually. Segmentation results were validated based on manual expert’s segmentation. Dice Scores (DS) were calculated for validation of the semiautomatic method. An example of segmentation results is shown in Figure2. Then, for comparison purposes, pathological regions area and difference percentage between regions were calculated for each patient. In addition, Discordance Index (DI), a measure of similarity in location, was defined as the ratio of the union the two regions minus the intersection the two regions to the union of two regions.Results
Proposed semi-automatic segmentation method can extract whole pathogenic tumor on two modalities with over 90 % sensitivity, specificity and dice score. Abnormality areas from two modalities were compared. The segmented region in the p map was smaller than in the T2-FLAIR images (mean difference percentage: 40% ± 0.15) in fourteen patients. The abnormality area in the p map was larger than in the T2-FLAIR images in one patient (difference percentage: 14%). Lack of concordance was observed between T2-FLAIR and p map ranged from 0.158 - 0.67 (average: 0.468 ± 0.2).Discussion
T2-FLAIR image is the method of choice for accurate delineation whole pathological region, in the current clinical practice of radiotherapy planning for GBM, however, this image cannot differentiate between pure edema and tumor-infiltrated edema. Histo-pathological studies have shown that p maps can add more information about tumor extension 5-7. Results of differences between size of whole pathological regions derived from T2-FLAIR and DTI-p map for each patient show that just anatomical T2-FLAIR is not adequate for delineation of boundary of pathological regions in GBM tumors.Conclusion
Delineation of hyperintense regions on FLAIR images is currently performed manually in target definition and volume measurement for treatment. This study explored the semi-automatic method applied to anatomic MRI with DTI-p map data for segmenting the pathological region as a timesaving and fast evaluation of tumor extension.Acknowledgements
We are extremely grateful to Ms Aramesh Safari and Mr Pedram Rostami for providing imaging data in Payambaran MRI center.References
1. G.A. Whitfield, S.R. Kennedy, I.K. Djoukhadar, et al. Imaging and target volume delineation in glioma. Clinical Oncology, 2014. 26(7): p. 364-376.
2. Price, S., et al., Improved delineation of glioma margins and regions of infiltration with the use of diffusion tensor imaging: an image-guided biopsy study. American journal of neuroradiology, 2006. 27(9): p. 1969-1974.
3. Maes, F., et al., Multimodality image registration by maximization of mutual information. IEEE transactions on medical imaging, 1997. 16(2): p. 187-198.
4. Kazerooni AF, et al. Multi-parametric (ADC/PWI/T2-w) image fusion approach for accurate semi-automatic segmentation of tumorous regions in glioblastoma multiforme. Magnetic Resonance Materials in Physics, Biology and Medicine. 2015; 28(1):13-22.
5. Price, S., et al., Improved delineation of glioma margins and regions of infiltration with the use of diffusion tensor imaging: an image-guided biopsy study. American journal of neuroradiology, 2006. 27(9): p. 1969-1974.
6. Kinoshita, M., et al., Fractional anisotropy and tumor cell density of the tumor core show positive correlation in diffusion tensor magnetic resonance imaging of malignant brain tumors. Neuroimage, 2008. 43(1): p. 29-35.
7. Beppu, T., et al., Fractional anisotropy value by diffusion tensor magnetic resonance imaging as a predictor of cell density and proliferation activity of glioblastomas. Surgical neurology, 2005. 63(1): p. 56-61.
Figures