3803
Longitudinal diffusion MRI for predicting response to radiotherapy in sarcoma patients1Department of Radiological Sciences, University of California, Los Angeles, Los Angeles, CA, United States, 2Physics and Biology in Medicine IDP, University of California, Los Angeles, Los Angeles, CA, United States, 3Xi'an Jiaotong University, Xi'an, China, 4Department of Radiation Oncology, University of California, Los Angeles, Los Angeles, CA, United States
Synopsis
In this work, we sought to predict the necrosis score, a surrogate of radiotherapy treatment outcome for sarcoma patients, using the longitudinal diffusion MRI data. Over three hundred features were extracted from the longitudinal diffusion data on twenty sarcoma patients. Minimum redundancy maximum relevance method with cross-validation was used to select the most relevant and stable features. Logistic regression, support vector machine and adaptive boosting were implemented to predict the necrosis score. AUC of 0.76 was achieved when using SVM with features from all three imaging time points. Features from before the treatment time point had better predictive power than data in the middle or after the treatment.
Introduction
Diffusion MRI has been shown to be a promising imaging biomarker for tumor response assessment due to its ability to reflect tissue morphofunctional information including cellular density. Various studies have revealed the possible correlation between baseline ADC or changes of ADC during treatments and patient outcome1–3. However, in most of these studies, only the simplest feature mean ADC was investigated and only data from 1-2 time points throughout the course of therapy were available. In this study, we sought to explore more features from longitudinal (daily) diffusion MRI to build a predictive model for necrosis score prediction.
Methods
Twenty soft-tissue sarcoma patients who underwent a clinical stereotactic body radiation therapy (SBRT) trial were recruited in this study with IRB approval. Each patient received five daily fractions of radiotherapy treatment within one week. Diffusion imaging was acquired using an MRI guided radiotherapy (MRgRT) system (ViewRay) three times during the treatment: one before the first treatment (T1), one after the third fraction (T2), and one immediately after the final fraction (T3) (See Figure 1(a)). Post-radiotherapy resection was performed about one month after the treatment, during which a necrosis score ranging from 0% to 100% was obtained as an immediate surrogate of the treatment outcome, where a low necrosis score indicates a poor response to the treatment. In this study, patients were divided into two groups Nlow and Nhigh based on the necrosis score (<50% v.s. >=50%).
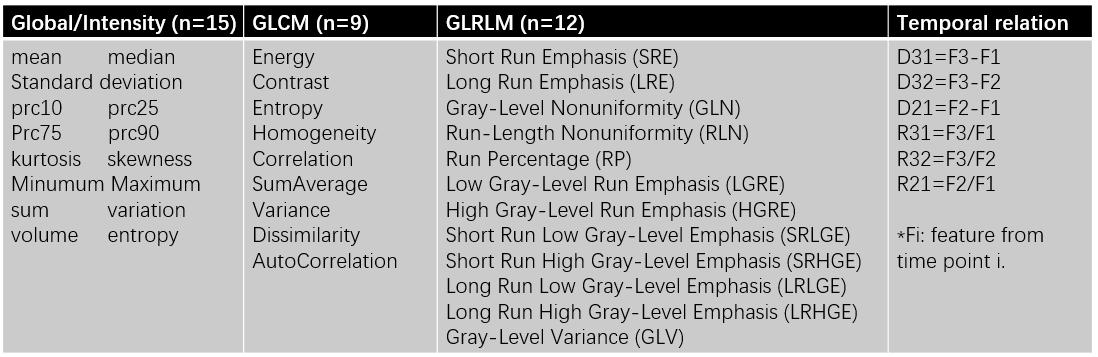
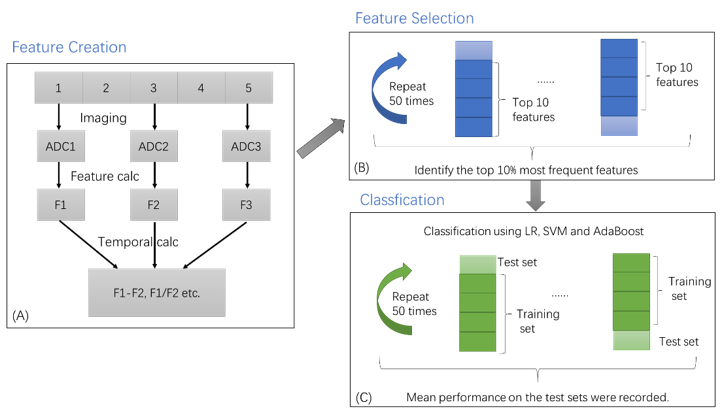
During each imaging session, diffusion-weighted single-shot echo-planar imaging (DW-ssEPI) images were acquired with the following protocol: TR/TE=3400/115ms, FOV=350x350mm2, resolution=2.7x2.7x6mm3, bandwidth=1346Hz/px, 20 slices, b-value=0,200, 300, 400, 500 mm2/s, average=5. The total scan time was 85 second. ADC maps were generated using the mono-exponential fitting, after which tumors were manually segmented. A total of 36 features, including 15 global feature, 9 gray level co-occurrence matrix (GLCM) features, 12 gray level run length matrix (GLRLM) features were extracted from each imaging time point (see Table 1). Ratio and difference between features from different time points were calculated, resulting to a total of 324 features.
Minimum redundancy maximum relevance (MRMR) was used to select the most relevant features while minimizing the redundancy between selected features4. As shown in Figure1(b), five-fold cross-validation was applied to avoid overfitting to the training set. In this process, one-fold of the data was removed from the feature selection process, and the top 10 features were selected using MRMR based on the remaining four-fold data. The entire process was repeated for 50 times with different data splitting to select the most stable features, which were defined as the top 10% most frequent features.
Logistic regression (LR), support vector machine(SVM) and adaptive boosting (AB) were implemented to predict treatment outcome (Nlow v.s. Nhigh). Similar to the feature selection process, five-fold cross-validation with 50 repetitions was conducted to evaluate the stability of each method (Figure 1(c)). The area under curve (AUC), sensitivity, specificity, and accuracy were recorded. Classification using only individual imaging time point (T1, T2, T3 respectively) were performed to identify the best time point for imaging and to evaluate the benefits of adding more imaging time points.
Results and Discussion
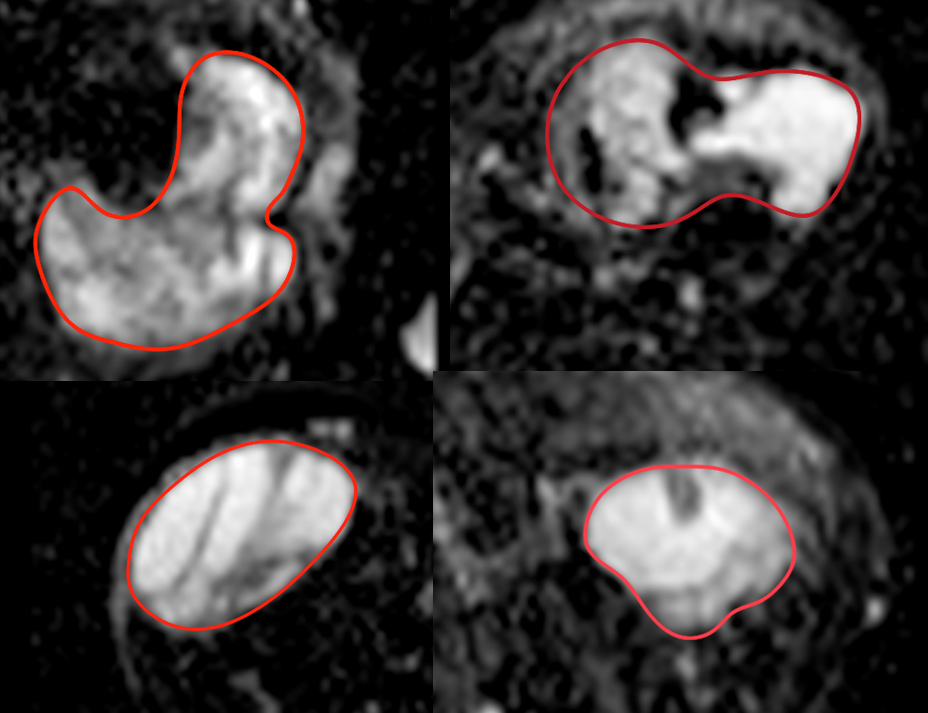
Considerable heterogeneity of ADC values within the tumor was observed for several patients (Figure 2). This clearly demonstrated the need of extracting more features to unveil the underlying biology.
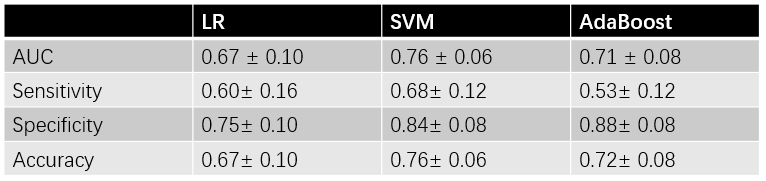
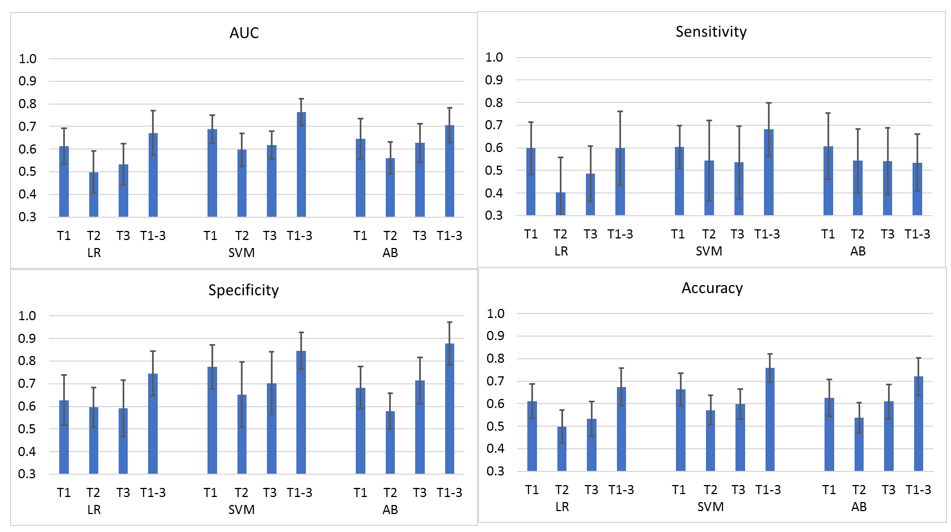
Four features were selected when using data from all three imaging time points (T1-3). They are: GLCM homogeneity at T1, 10% percentile at T2, the entropy of R31, and volume of D21. Those features came from all three imaging time points, with two reflected the heterogeneity ( GLCM homogeneity and entropy). Prediction performance is listed in Table 2. SVM had the best performance in terms of AUC (0.76 ± 0.06), specificity (0.84±0.0.08) and accuracy (0.76±0.06). Adaptive boosting provided the best sensitivity (0.88±0.08). Logistic regression had the worst performance. Moderate standard deviation indicated the stability of the prediction.
Classification performance comparison was shown in Figure 3, where AUC, sensitivity, specificity, and accuracy were plotted. The SVM model had the best prediction among the three methods. Overall, using T1-3 provided the highest performance, and then followed T1. This might be an indication that imaging should be performed before the treatment if only one imaging can be scheduled.
Due to the small sample size, no independent test data set was used in this study. More patients are being recruited to improve the robustness of the prediction.
Conclusion
Longitudinal diffusion MRI was used for the prediction of necrosis score on sarcoma patients. The SVM model with features from all imaging time points provided the best performance among the features under consideration for predicting necrosis score at the time of surgery.Acknowledgements
No acknowledgement found.References
1. Padhani AR, Liu G, Mu-Koh D, et al. Diffusion-Weighted Magnetic Resonance Imaging as a Cancer Biomarker: Consensus and Recommendations. Neoplasia. 2009;11(2):102-125. doi:10.1593/neo.81328.
2. Thoeny HC, Ross BD. Predicting and Monitoring Cancer Treatment Response with DW-MRI. J Magn Reson Imaging JMRI. 2010;32(1):2-16. doi:10.1002/jmri.22167.
3. Yang Y, Cao M, Sheng K, et al. Longitudinal diffusion MRI for treatment response assessment: Preliminary experience using an MRI-guided tri-cobalt 60 radiotherapy system. Med Phys. 2016;43(3):1369-1373. doi:10.1118/1.4942381.
4. Ding C, Peng H. Minimum redundancy feature selection from microarray gene expression data. J Bioinform Comput Biol. 2005;03(02):185-205. doi:10.1142/S0219720005001004.
Figures