3801
Comparative Assessment of Geometric Distortion for an MR-Linac Versus Several Diagnostic ScannersJordan Michael Slagowski1, Yao Ding2, Clifton David Fuller2,3, Caroline Chung2, Mo Kadbi4, Zhifei Wen1, and Jihong Wang1,3
1Radiation Physics, The University of Texas MD Anderson Cancer Center, Houston, TX, United States, 2Radiation Oncology, The University of Texas MD Anderson Cancer Center, Houston, TX, United States, 3The University of Texas Graduate School of Biomedical Sciences at Houston, Houston, TX, United States, 4MR Therapy, Philips HealthTech, Cleveland, OH, United States
Synopsis
The integration of a MR scanner with a linear accelerator (MR-Linac) may improve image guidance in radiation therapy (RT). Spatial fidelity is an important consideration in RT and should be evaluated for MR-Linac imaging. This work presents a phantom and software developed in-house to measure geometric distortion across a large MR imaging field-of-view. A comparative assessment of geometric distortion within a 1.5T MR scanner integrated with a 7 MV linear accelerator is performed versus several commercial scanners with field strengths ranging from 1.5T-3.0T. The geometric distortion within the MR-Linac was comparable or less than that measured with the diagnostic scanners.
Purpose
The recent realization of a high-field (1.5T) MR scanner integrated with a linear accelerator (MR-Linac) may improve image-guidance in radiation therapy (RT). The excellent soft tissue contrast offered by MRI could potentially enable online or real-time adaptive treatment planning, improve target localization, and facilitate markerless real-time tumor tracking during treatment. However, geometric distortion attributed to main magnetic field inhomogeneities and gradient nonlinearities may reduce the spatial localization accuracy of target and normal tissue structures. High spatial fidelity over a large imaging field-of-view (FOV) that encompasses the patient skin surface is paramount for RT treatment planning. The purpose of this study was to assess the geometric distortion for an MR-guided linear accelerator (MR-Linac, Elekta AB, Stockholm, Sweden) and compare to several diagnostic scanners with field strengths ranging from 1.5T-3.0T.Methods
A geometric distortion phantom (Fig. 1A) was fabricated in house and used to assess geometric distortion for an MR-Linac and several commercial scanners by different vendors. The phantom consists of 828 high-contrast fiducials suspended in a non-MR visible material. The fiducials are spaced 5 mm in each of the x-, y-, and z- dimensions corresponding to the medial-lateral, anterior-posterior, and cranial-caudal axes, respectively. The phantom was designed to span a large volume-of-interest (50 cm lateral, 40 cm anterior-posterior, 40 cm cranial-caudal) in order to assess distortion that may occur near the skin surface. For each scanner considered, the phantom was centered near MR iso-center and imaged with 3D T1 and T2 weighted pulse sequences (e.g. Fig. 1B) with the vendor provided 3D geometric distortion correction applied. Similar receiver bandwidth and spatial resolution were selected during imaging for each scanner. Fiducials were segmented from the acquired images using a semi-automatic approach. First, image processing is performed to improve uniformity across the imaging FOV and enhance fiducial contrast. Second, fiducials are detected using convolution based template matching and thresholding. The threshold level was set to 10% of the maximum value of the filtered image. Finally, spatial coordinates (x, y, z) corresponding to the grayscale weighted center-of-mass of each fiducial are determined using connected component analysis. Each image is manually inspected to ensure fiducials in low-contrast regions, often near the edges of the imaging volume where distortion is greatest, are detected. A manual refinement procedure, with automated center-of-mass computation, ensures all fiducials are properly detected. After segmentation, a rigid registration is performed over a limited FOV near the iso-center to align the measured fiducial positions with a reference template that specifies coordinates derived from the phantom manufacturing specifications (Fig. 1C). Distortion vectors are then computed that specify the deviation of each measured fiducial position relative to the reference position in each of the x-, y-, and z-dimensions (Fig. 1D). The mean, standard deviation, and range of the absolute distortion are reported for the MR-Linac and several commercial scanners. Distortion vectors superimposed on heat maps facilitate visualization of distortion within the 3D FOV.Results
The mean geometric distortion measured from T1 weighted MR-Linac images was 1.0 mm +/- 0.6 mm for fiducials within a spherical volume of diameter 30 cm defined about iso-center. Geometric distortion for the MR-Linac was less than or equal to results obtained with 1.5T (1.4 mm +/- 0.8 mm) and 3.0T (1.0 mm +/- 0.4 mm) diagnostic scanners (Fig. 2). Mean geometric distortion measured 0.8 mm +/- 0.4 mm (MR-Linac), 1.5 mm +/- 1.4 mm (1.5T scanner), and 0.9 mm +/- 0.4 mm (3.0T scanner) for T2 weighted imaging. Distortion increased with distance from iso-center, as expected. Heat maps (Fig. 3) and three-dimensional distortion maps (Fig. 4) present results throughout the imaging volume. A slight distortion was observed near the center of the MR-Linac imaging volume, relative to slices +/- 7.5 cm cranial/caudal. The distortion at the center may be caused by the 15 cm gap between the passive shim coils of the MR-Linac to permit radiation beam transmission. Figure 5 demonstrates an example application of the developed distortion phantom and software. Fusion of the color-coded distortion maps with anatomic images could provide useful information during contouring, margin determination, or patient set-up.Conclusion
The geometric distortion measured for an MR-Linac was comparable or less than that observed for diagnostic scanners. A novel visualization technique was demonstrated to display geometric distortion maps relative to anatomic structures. This display feature could be utilized during contour delineation or margin determination. Efforts are currently ongoing to quantify the geometric distortion of several additional scanners at our institution.Acknowledgements
No acknowledgement found.References
No reference found.Figures
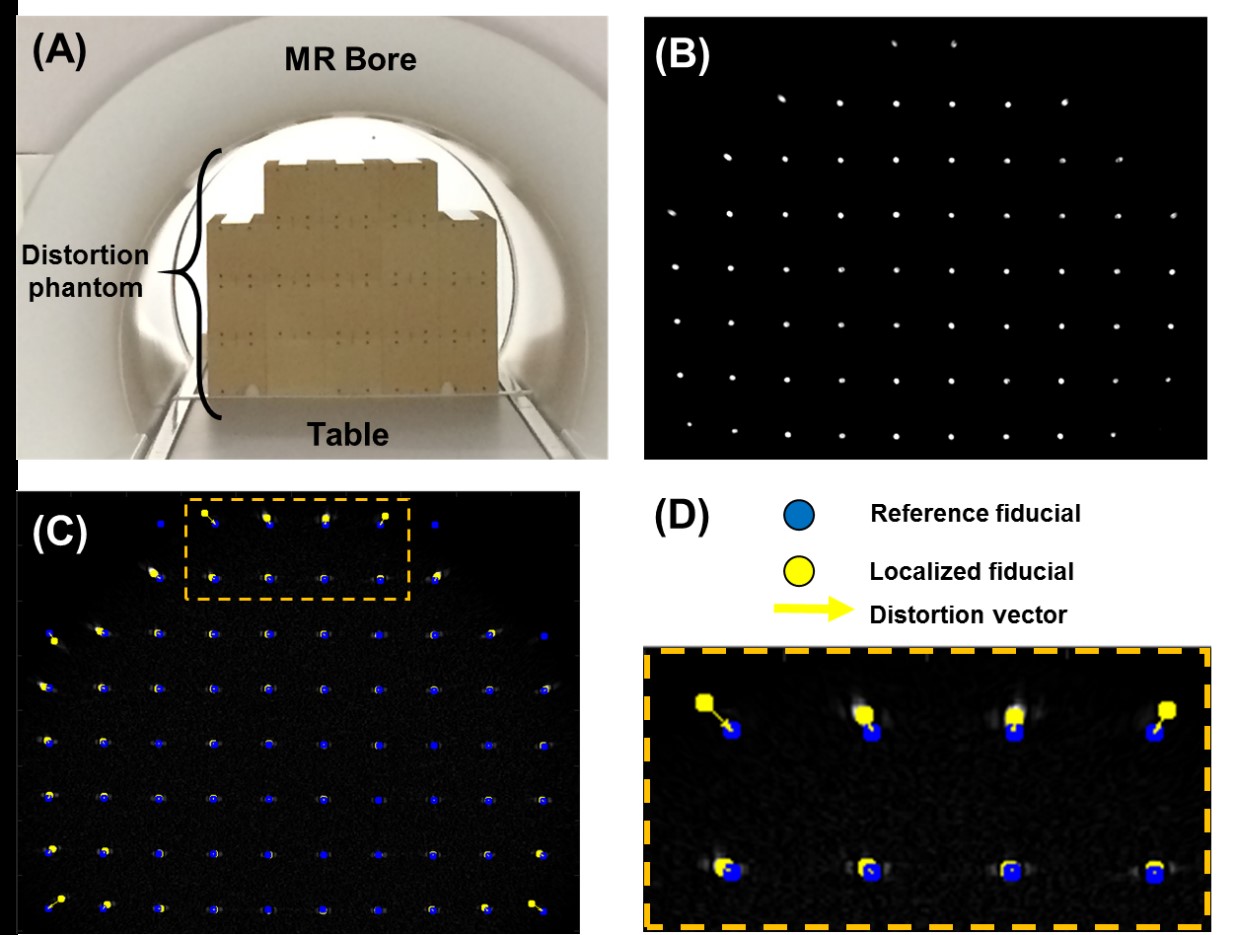
Figure 1: (A) The geometric distortion phantom
consists of 828 MR-visible fiducials distributed over a 50 cm (lateral)
by 40 cm (anterior-posterior) by 40 cm (cranial-caudal) region. (B) An example T1 axial image is shown.
(C) Fiducials are segmented and
displayed relative to reference positions. (D)
A magnified region-of-interest showcases distortion vectors that describe the
deviation of the measured fiducial positions from the reference positions.
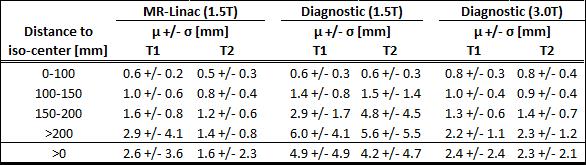
Figure 2:
Geometric distortion results for T1 and T2 weighted images are presented for a
1.5T MR-Linac, 1.5T diagnostic MR scanner, and 3.0T diagnostic MR scanner.
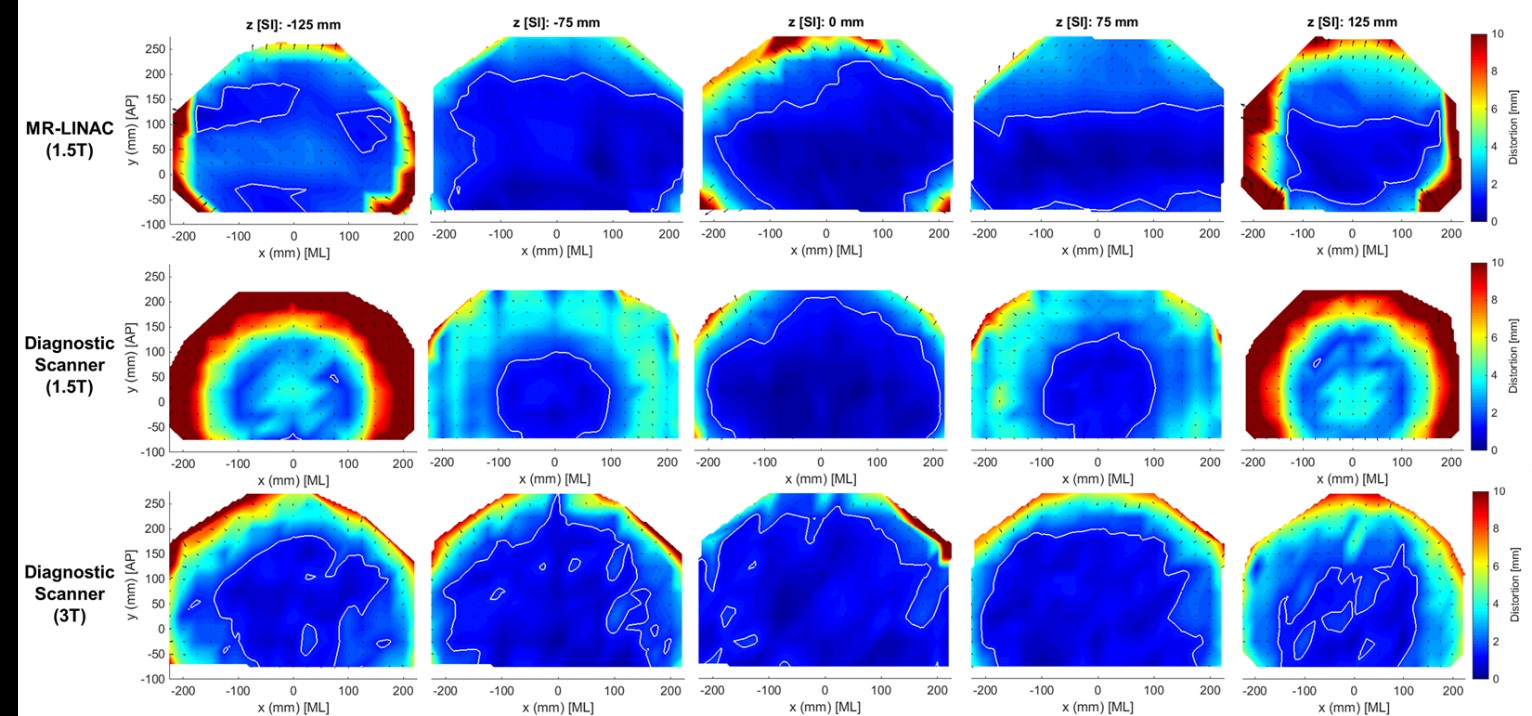
Figure 3: Heat maps present geometric
distortion for axial T1 images located at -125 mm (caudal), -75 mm, 0 mm, +75
mm, and +125 mm (cranial) for a 1.5T MR-Linac (top row), 1.5T diagnostic
scanner (middle row), and 3.0T diagnostic scanner (bottom row). The solid white
line indicates regions with absolute geometric distortion less than or equal to
1.5 mm. Distortion vectors are shown as black arrows.
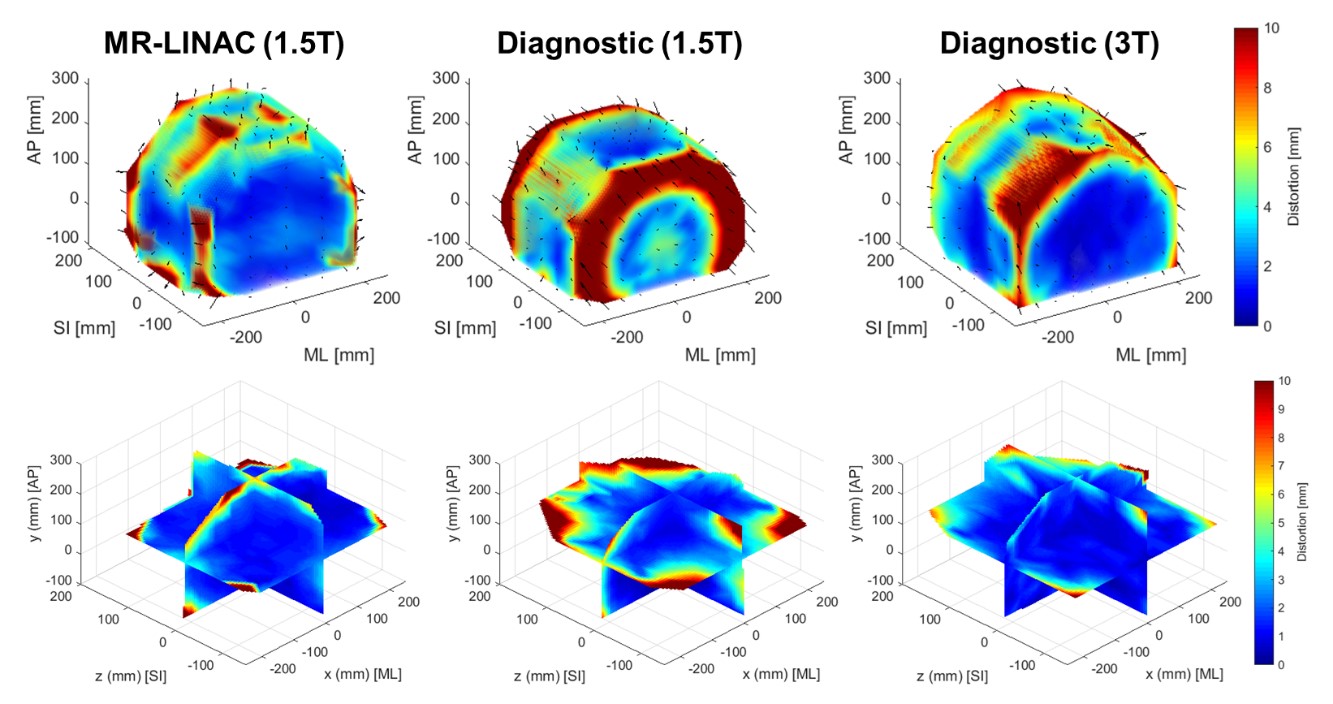
Figure 4:
Three-dimensional renderings of absolute geometric distortion for three MR
scanners are shown for T1 images. The 3D distortion vectors are shown as black
arrows (top row only).
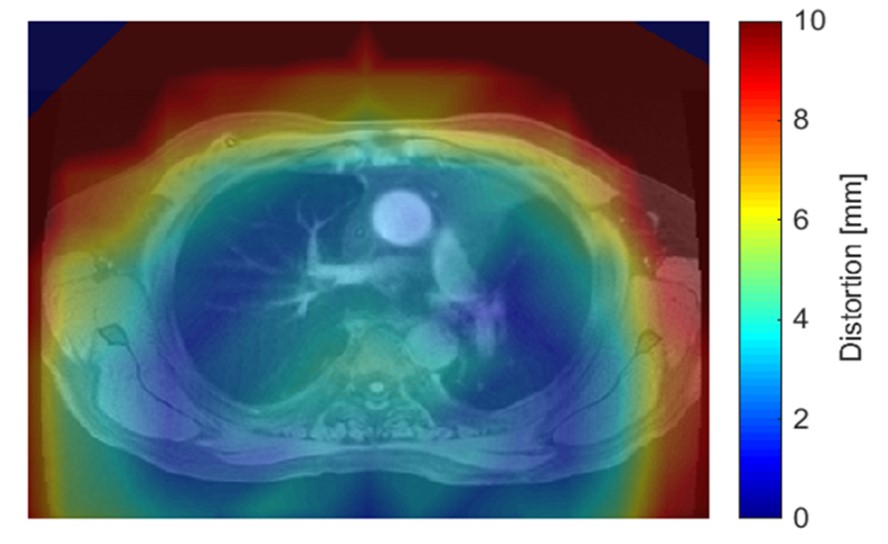
Figure 5:
Distortion maps may be registered and displayed with MR images to visualize
geometric distortion relative to anatomic structures.