3798
An Automated Multiparametric MRI Quantitative Imaging Prostate Habitat Risk Scoring System for Defining External Beam Radiotherapy Boost Volumes1Radiation Oncology, University of Miami, Miami, FL, United States, 2Statistics, University of Miami, Miami, FL, United States, 3Urology, University of Miami, Miami, FL, United States, 4Pathology, University of Miami, Miami, FL, United States
Synopsis
The standard of clinical care, Prostate Imaging, Reporting and Diagnosis System (PI-RADS), does not tap into the wealth of quantitative imaging information contained in the multiple sequences of mpMRI, nor does it elucidate intralesional spatial heterogeneity. A habitat risk score (HRS) approach that combines the quantitative information from the diffusion and perfusion mpMRI sequences is developed. HRS was devised in ten subcategories with increasing levels associated with a greater risk of harboring higher Gleason Score's and depicted as a heat map. The automated method is used to define radiotherapy (RT) boost volumes in the background of a randomized Phase II clinical trial.
INTRODUCTION:
Dose escalation above 80 Gy improves the control of intermediate to high risk prostate cancer. We hypothesize that Gross Tumor Volume (GTV) dose escalation, as opposed to whole prostate dose escalation, will improve tumor control without increasing side effects. A major obstacle is defining the GTV in a systematic reproducible way. The standard of clinical care Prostate Imaging, Reporting and Diagnosis System (PI-RADS) does not tap into the wealth of quantitative imaging information contained in the multiple sequences of mpMRI, nor does it elucidate inter- and intralesional spatial heterogeneity. A habitat risk score (HRS) approach that combines the quantitative information from the diffusion and perfusion mpMRI sequences is developed. HRS was devised in ten subcategories with increasing levels associated with a greater risk of harboring higher Gleason Score (GS) and depicted as a heat map. The automated method is used to define radiotherapy (RT) boost volumes in the background of a randomized Phase II clinical trial (BLaStM) comparing two methods of increasing dose to the mpMRI-defined habitat tumor region(s).METHODS:
An automated pixel by pixel method was optimized, using Dynamic Contrast Enhanced (DCE)-MRI and Apparent Diffusion Coefficient (ADC) sequences, to be associated with GS. Each pixel is scored independently on DCE and ADC from 1 to 10, using previously described techniques.1,2 Briefly, DCE-MRI is analyzed using pattern recognition approach.3,4 The area-under-the-curve (AUC) for the first 90 sec is calculated from the average DCE curve in the segmented region. The range of this semi-quantitative feature, normalized by the signal of the gluteus maxumis muscle, estimated in 67 patients, is mapped linearly into 10-score scale. For ADC analysis, we used previously established ADC thresholds for identifying pixels at high, intermediate and low risk of cancer: 900/800; 1100/850, and 1200/1050 µm2/s for Peripheral Zone (PZ)/Transition Zone(TZ), correspondingly. Each pixel on ADC was mapped also to 10 score scale. Finally, HRS is estimated in each pixel of the prostate as a weighted sum of DCE and ADC scores. These weights are equal in the PZ (0.5 DCE; 0.5 ADC), while in the TZ the ADC is weighted heavier (0.2 DCE; 0.8 ADC). The defined mpMRI habitats were first related to radical prostatectomy (RP) GS tumor volumes in 3-dimensions as contoured by the study pathologist. A workflow for RT planning was created in MIM image sysyetm (MIM, Clevelend, OH) where the HRS contours were migrated to the planning CT to define the GTV using rigid fusion.RESULTS:
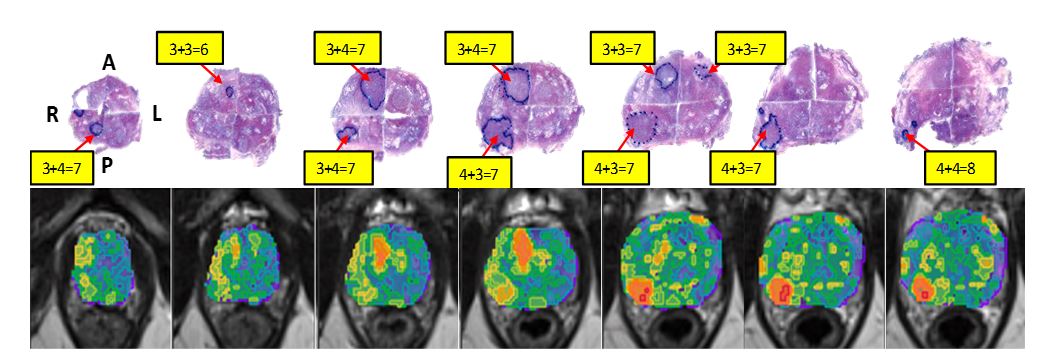
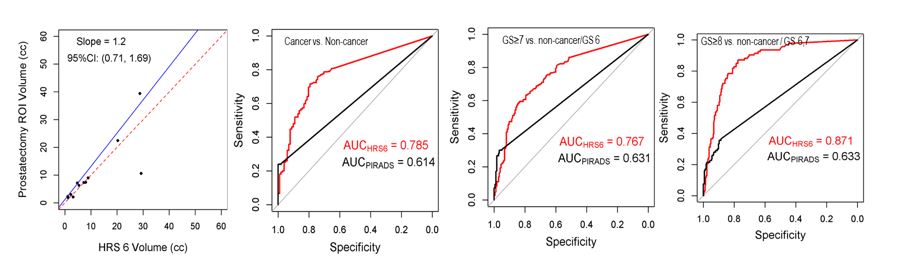
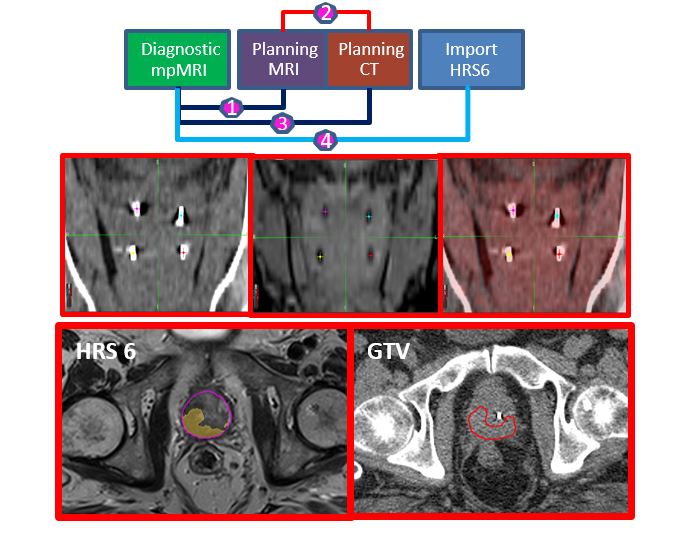
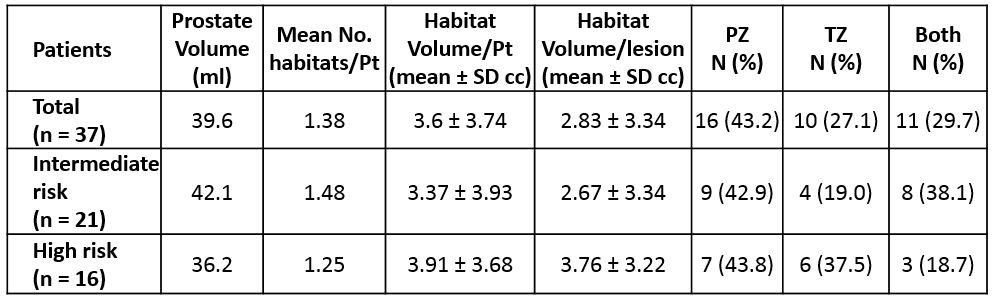
The association of HRS maps with histopathology is shown in Figure 1. Note the inter- and intralesional heterogeneity and the correlation between the red color intensities of the heat-map with the higher microscopic tumor grade. We analyzed 39 regions of interest in 12 patients who underwent RP after mpMRI; these were also assigned a PI-RADS score 4/5. We plotted the volume of GS≥7 in the prostate and found impressive agreement with HRS6 volumes within the prostate (Figure 2, left). The association between the HRS6 and three histopathology outcomes in each tumor nodule: Cancer vs No Cancer, GS≥7 vs No Cancer/GS=6 and GS≥8 vs No cancer/GS=6,7 was assessed using a generalized linear mixed model (GLMM) regression. The corresponding receiver operating characteristic curves and areas under the curve (ROC-AUCs) are shown in Figure 2 plots 2-4 together with ROC-AUCs for model based on PIRADS only. HRS 6 provided an AUC=0.767 (95%CI: 0.719-0.816) for predicting the likelihood of GS≥7. By contrast, PI-RADS had an AUC=0.631. HRS maps were created for the first 37 patients on the BLaStM trial to direct MRI-guided prostate biopsies at the time of fiducial marker placement. We have created a workflow for incorporating HRS6 maps in the planning of the BLaStM patients (Figure 3) to guide boost volumes. HRS6 was chosen because it was the most consistent at achieving our main objective of detecting significant cancers of GS ≥7. The mean number of lesions per patient was 1.38. The mean lesion volume (+/-SD) was 2.83 ± 3.34 cm3 (Table 1).CONCLUSION:
Dose escalation only to well-defined prostate habitats, as proposed in this work, has the potential to improve tumor control with less toxicity than when the entire prostate is dose escalated. An automated method has been developed to define boost volumes based on GS risk.Acknowledgements
National Institutes of Health, R01CA189295 and R01CA190105References
1. Parra NA, Chinea F, Punnen S, et al. Assessment and Localization of Aggressiveness in Prostate Cancer Using Dynamic Contrast Enhanced-MRI. Medical Physics. 2016;43(6):3704-3704.
2. Stoyanova R, Pollack A, Takhar M, et al. Association of multiparametric MRI quantitative imaging features with prostate cancer gene expression in MRI-targeted prostate biopsies. Oncotarget. 2016;7(33):53362-53376.
3. Stoyanova R, Huang K, Sandler K, et al. Mapping Tumor Hypoxia In Vivo Using Pattern Recognition of Dynamic Contrast-enhanced MRI Data. Transl Oncol. 2012;5(6):437-447.
4. Chang YCC, Ackerstaff E, Tschudi Y, et al. Delineation of Tumor Habitats based on Dynamic Contrast Enhanced MRI, Sci Rep 2017; 7:9746.
Figures