3797
Evaluation of MRI-Guided Radiotherapy Planning Target Volume Delineation for Colorectal Cancer Due to Variations in Image Contrast and Patient MotionYang Zhang1, Liming Shi2, Xiaonan Sun2, Tianye Niu2, Ning Yue3, Jeon-Hor Chen1, Tiffany Kwong1,3, Min-Ying Su1, and Ke Nie3
1Department of Radiological Sciences, University of California, Irvine, CA, United States, 2Department of Radiation Oncology, Sir Run Run Shaw Hospital, Zhejiang University School of Medicine, Hangzhou, China, 3Department of Radiation Oncology, Rutgers-The State University of New Jersey, New Brunswick, NJ, United States
Synopsis
This study evaluates the difference in defining the target volume of rectal cancer with MRI-guided radiation treatment planning. Tumors show different appearances on different MR sequences, and also the motion of patients during the scan may affect defining planning target volume. A quantitative radial distance method was developed to evaluate variations coming from image contrast and patient motion. A total of 45 patients with pre- and post-radiation treatment MRI were analyzed. The mean difference in the radial distance between ROI’s drawn on different post-contrast images was 2-3 mm, and the difference in the 90th percentile tumor pixel was 6-8 mm.
Introduction:
Chemoradiation therapy (CRT), followed by total mesorectal excision (TME), is the standard-of-care treatment for locally-advanced colorectal cancer. Currently, the tumor delineation in radiation therapy is mostly relied on CT images. With the advancement of fast acquisition of MRI scans and the possibility to obtain reliable electron density, MRI-guided treatment planning and MRI-Linac are gradually gaining its popularity in radiotherapy. Although MRI shows much better soft tissue contrast which could lead to better lesion delineation, the appearance of the tumor can vary greatly depending on the type of imaging sequence or images acquired at different times after injection of contrast agent. Furthermore, patient motion can be another source of variation that can add to the uncertainty when determining the target volume for treatment planning. In this study, we developed a quantitative method using the radial distance, defined as the distance from the center of rectum to the boundary of the tumor region, to evaluate variations of the tumor ROI. All patients had a follow-up MRI, and variations in both pre- and post- treatment MRI were studied.Methods:
A total of 45 patients (mean age 60) with stage T3 and T4 rectal cancer were studied. The MRI was done on a 3.0 Tesla scanner (GE Signa HDxt) using a phased-array body coil. In this study only the three post-contrast frames (termed as L2, L3, and L4) acquired at 15, 60, and 120 seconds after injection of Gd (0.1 mmol/kg) in the LAVA sequence were analyzed. On each set of DCE images, the tumor region of interest (ROI) was carefully drawn by a radiation oncologist (Figure 1). Using the rectum contour drawn on one slice as reference, an intensity based non-rigid Demons algorithm was applied to automatically segment the rectum in both cranial and caudal directions (Figure 2). Then the centroid of the rectum on each slice was used as the reference point to calculate the radial distance (Figure 3). A histogram was generated for the difference of the measured radial distance between L2 vs. L3, and another for L2 vs. L4. The values of the 25th, 50th, 75th, and 90th percentile pixel, and the mean value averaged over the entire tumor were obtained. In order to evaluate the difference coming from intra-fractionation patient motion, Affine registration was used to co-register two sets of images to determine the deformation matrix, e.g. L2 and L3 (Figure 4), and then the manual ROI drawn on L2 was mapped to L3. For these two ROI’s the difference was coming from the motion.Results:
Figure 4 demonstrates the difference between the manually drawn ROI on L2 and L3, the mapped ROI from L2 to L3, as well as the histogram of the difference in the radial distance in these two comparisons. Table 1 summarizes the difference in radial distance (absolute value) of the 25th, 50th, 75th, and 90th percentile pixel. The intra-fractionation patient motion was found to be within 1-2 mm. Although no-special bowel preparation was given, the patients were able to stay still during the whole scan. On the other hand, when lesions were defined using different image sequences, over 25% pixels showed over 3-5 mm differences, and over 10% pixels showed 6-8 mm differences.Conclusions:
The mean value from the entire tumor showed that the difference between L2 and L4 was higher than between L2 and L3, which was reasonable due to the longer time difference. The motion difference was higher in the post-treatment compared to pre-treatment. This was also reasonable as patients might be weaker after treatment and had more difficulty holding still during the scan. In the current CRT planning, 1 cm margin expansion is typically used to create planning target volume (PTV) from clinical target volume (CTV) which counts for both intra- and inter-fractionation motion and setup error. Previous studies assessed the inter-fractionation motion of rectal cancer patients was by average of 8 mm using daily CBCT, and concluded the 1 cm expansion should be adequate for radiotherapy planning [1-2]. However, none of previous work tried to identify the intra-fractionation motion or the variation of CTV delineation from image sequences. This is understandable as in CT based planning, different image sequences as helical mode or cine mode etc., theoretically do not cause large variations in the image contrast. But in MRI-based planning, difference in image contrast as demonstrated in this work, can lead to variations in identifying CTV. With MRI-guided radiotherapy gradually becoming available, the method developed in this work may be used to evaluate the variations in delineating tumor ROI, so a more precise treatment planning field with reasonable margin can be used to avoid side effect without compromising the tumor treatment efficacy.Acknowledgements
This study is supported in part by NIH R01 CA127927, and Rutgers-RBHS precision medicine pilot grant, The Rutgers-Cancer Institute of New Jersey P30 CA072720.References
[1]. Yamashita H, Takenaka R, Sakumi A, Haga A, Otomo K, Nakagawa K. Analysis of motion of the rectum during preoperative intensity modulated radiation therapy for rectal cancer using cone-beam computed tomography. Radiat Oncol. 2015;10:2. [2]. Chong I, Hawkins M, Hansen V, Thomas K, McNair H, O'Neill B, Aitken A, Tait D. Quantification of organ motion during chemoradiotherapy of rectal cancer using cone-beam computed tomography. Int J Radiat Oncol Biol Phys. 2011;81(4):e431-8.Figures
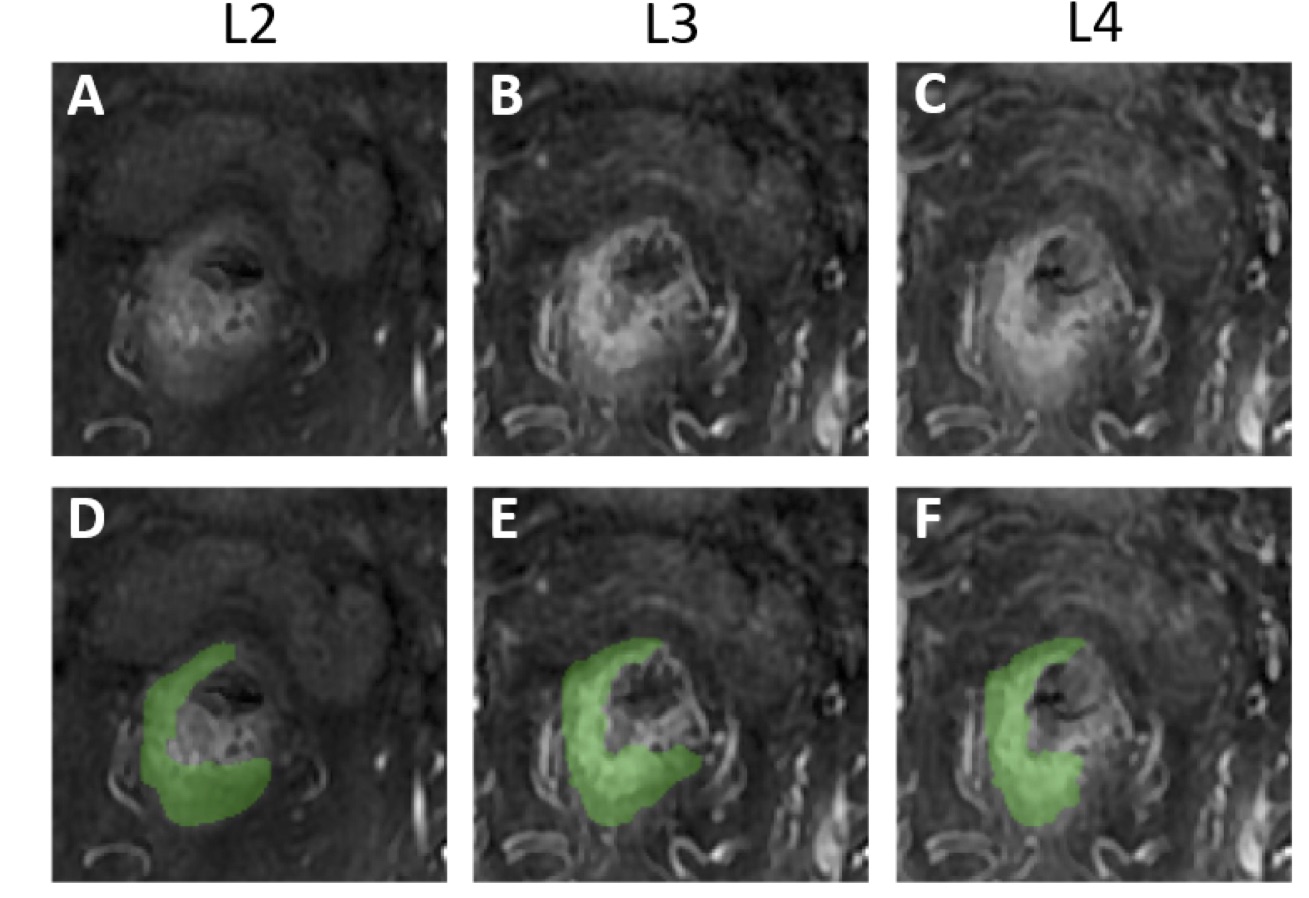
Figure
1: One case example showing the three different
post-contrast enhanced images, L2, L3, and L4 acquired using the LAVA sequence
at 15, 60, and 120 seconds, respectively, after injection of Gd contrast agent.
The tumor ROI is manually drawn by a radiation oncologist, separately, on each
image, thus shows some differences. The radial distance method can be used to
measure the distance of the outer tumor boundary to a fixed center reference
point, which allows for evaluation of the tumor ROI difference between each
pair, e.g. L2 vs. L3, and L2 vs. L4.
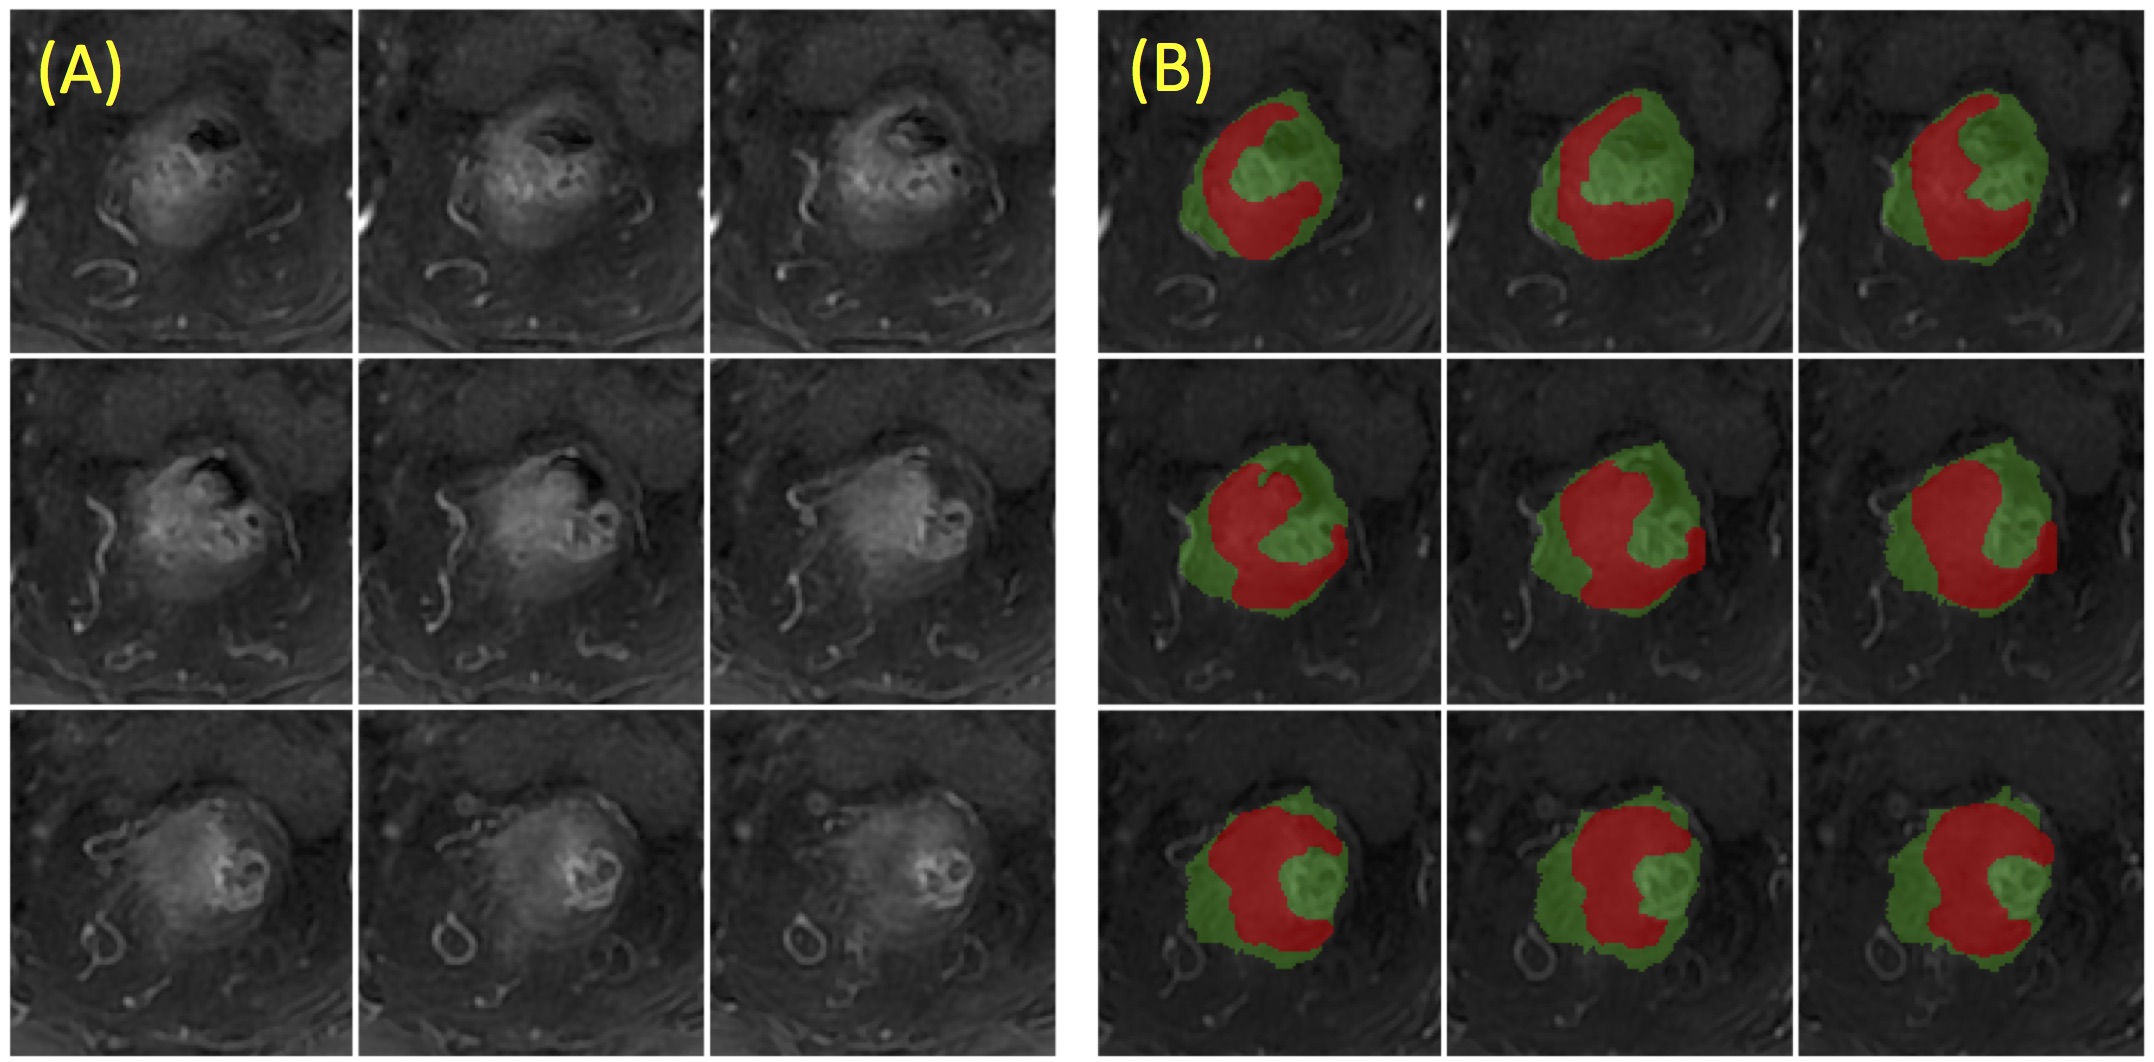
Figure
2: (A)
Original images from 9 slices; (B) The segmented rectum (in green), with the
manually drawn tumor ROI (in red). A body radiologist chooses one middle slice
that shows a clear rectum contour and manually traces the contour. This contour
is then mapped to the adjacent slices in both cranial and caudal directions as
the reference. The intensity-based non-rigid registration with the Demon
algorithm is used to segment the rectum contour on these adjacent slices, and
the process continues until all slices containing the tumor are done.
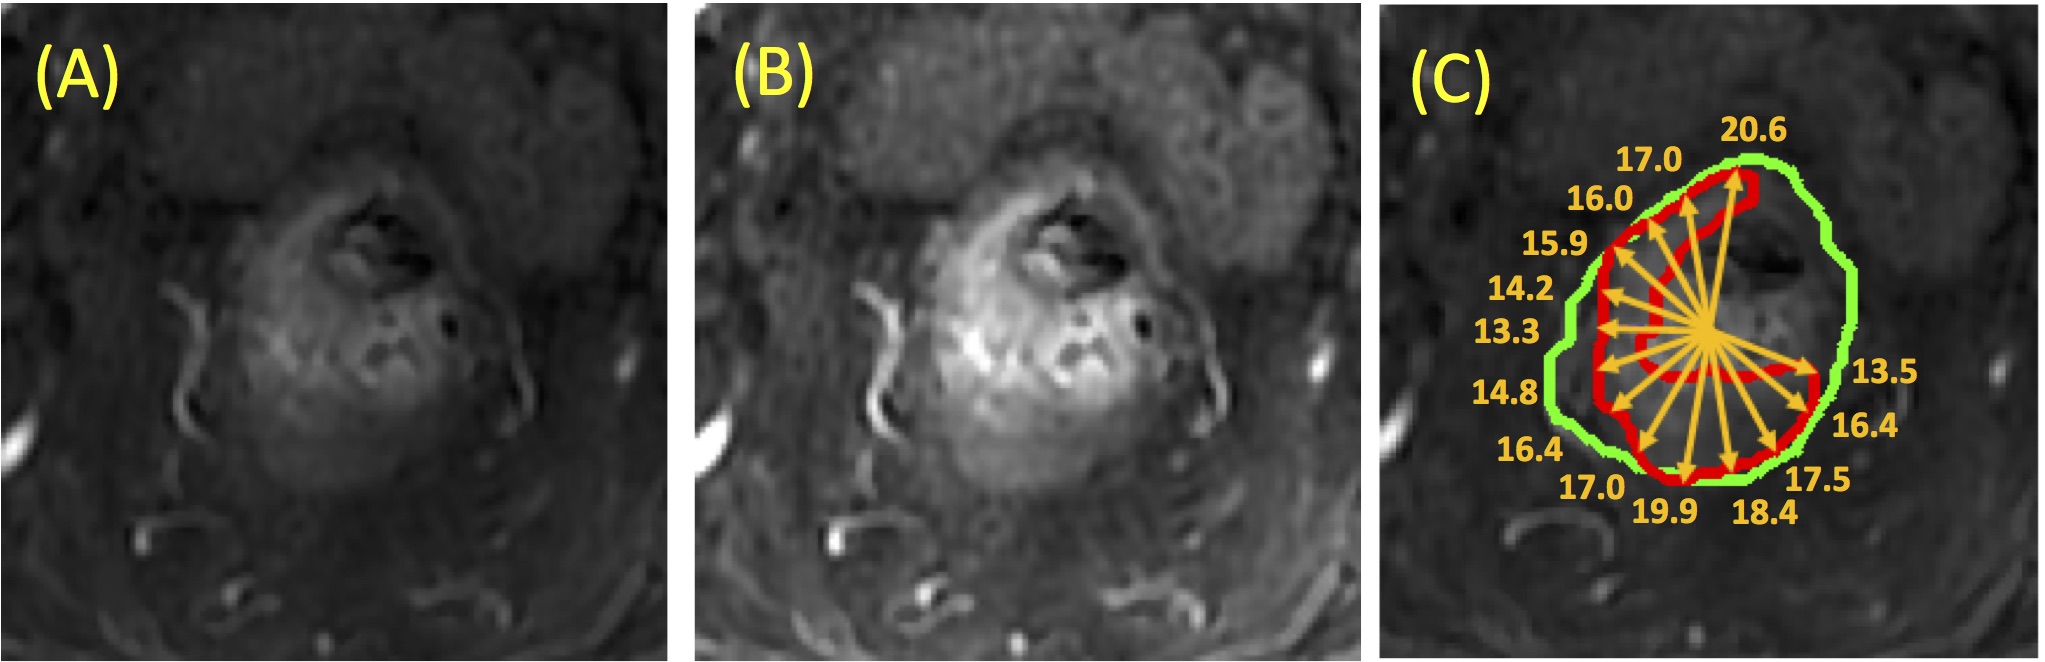
Figure
3: (A)
Pre-contrast Image; (B) Post-contrast image; (c) Rectum contour (green) with
tumor (red) to illustrate the radial distance. On each imaging slice, the centroid
of the segmented rectum is used as the reference for calculation of the radial
distance. A total of 180 radial lines are used (every 2 degrees), and only the
lines intersecting with the tumor are used. The radial distance is measured as
the distance from the outer most point intersecting with the radial line to the
center, as shown in the figure.
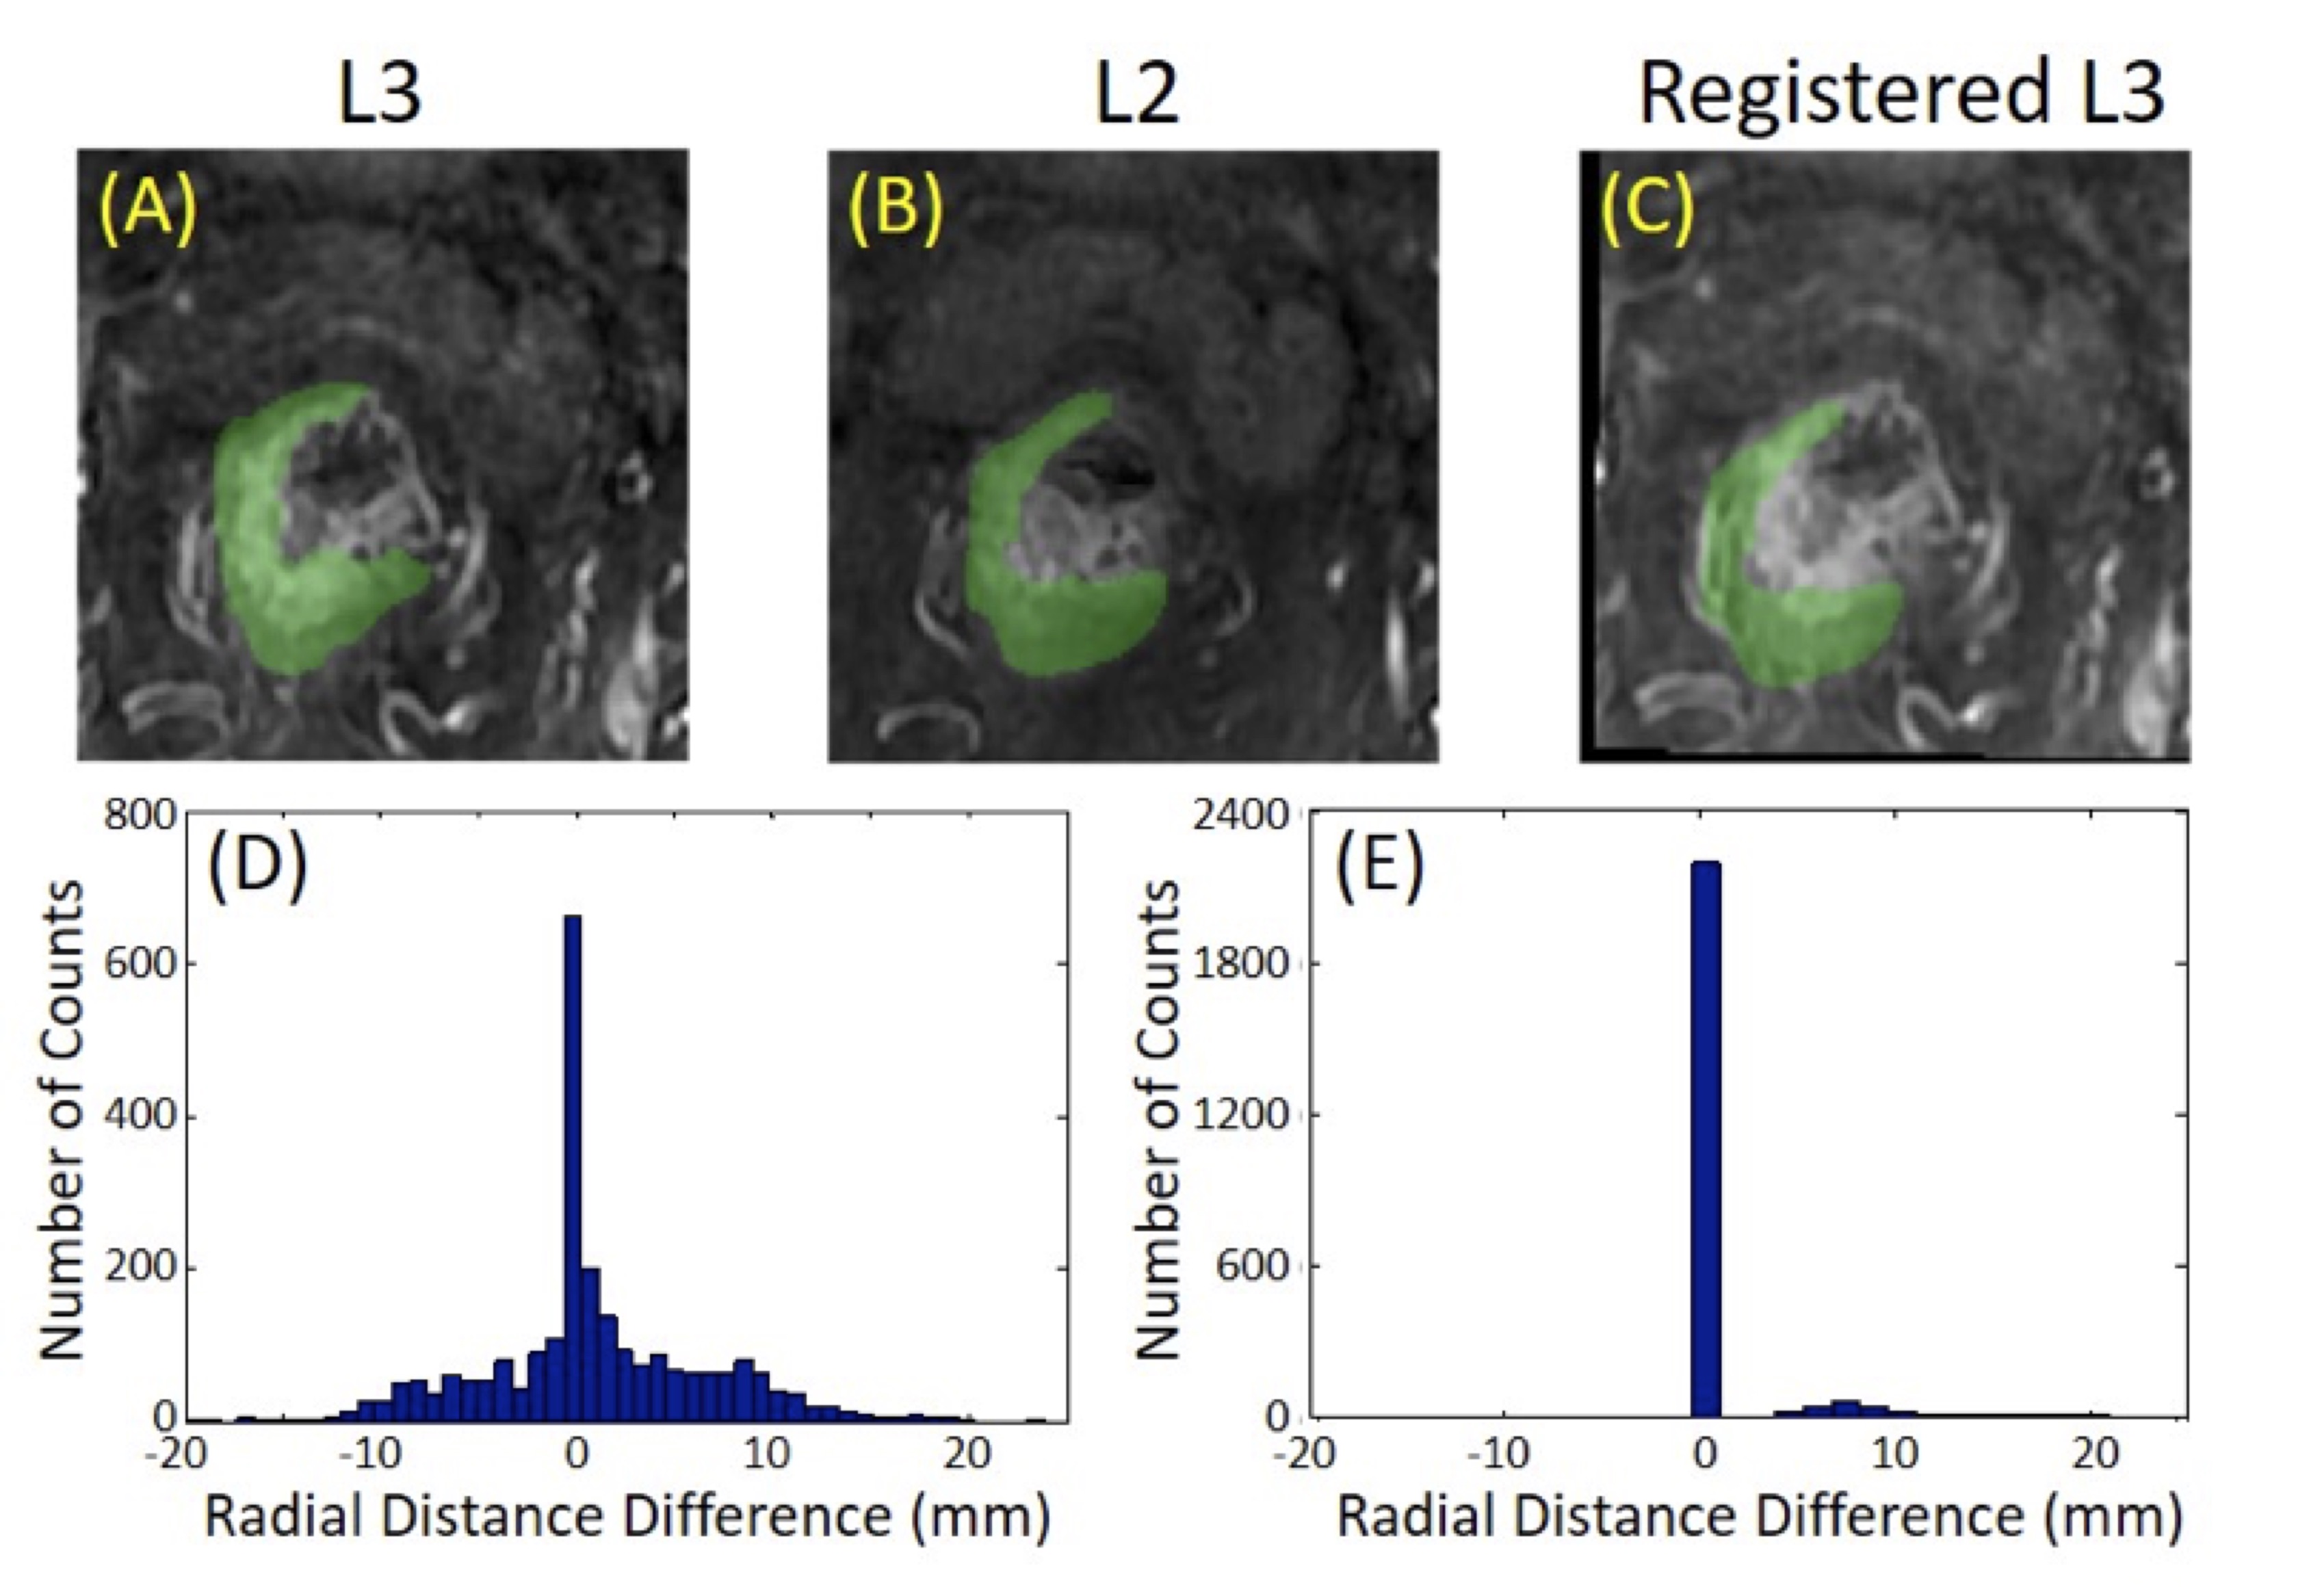
Figure
4: The
comparison of the tumor ROI between L2 and L3. (A) The manual tumor ROI on L3;
(B) The manual tumor ROI on L2; (C) The co-registered L3 to match with L2. The
deformation matrix after the Affine registration is used to map the ROI drawn
on L2 to L3. The difference between ROI on L2 and on registered L3 is used to
evaluate the motion-related difference. The radial distance is measured for
each tumor pixel on L2 and L3, and the difference of all pixels is used to generate
a histogram. (D) The histogram between manually drawn ROI on L2 and L3; (E) The
histogram for difference coming from motion between L2 and L3.
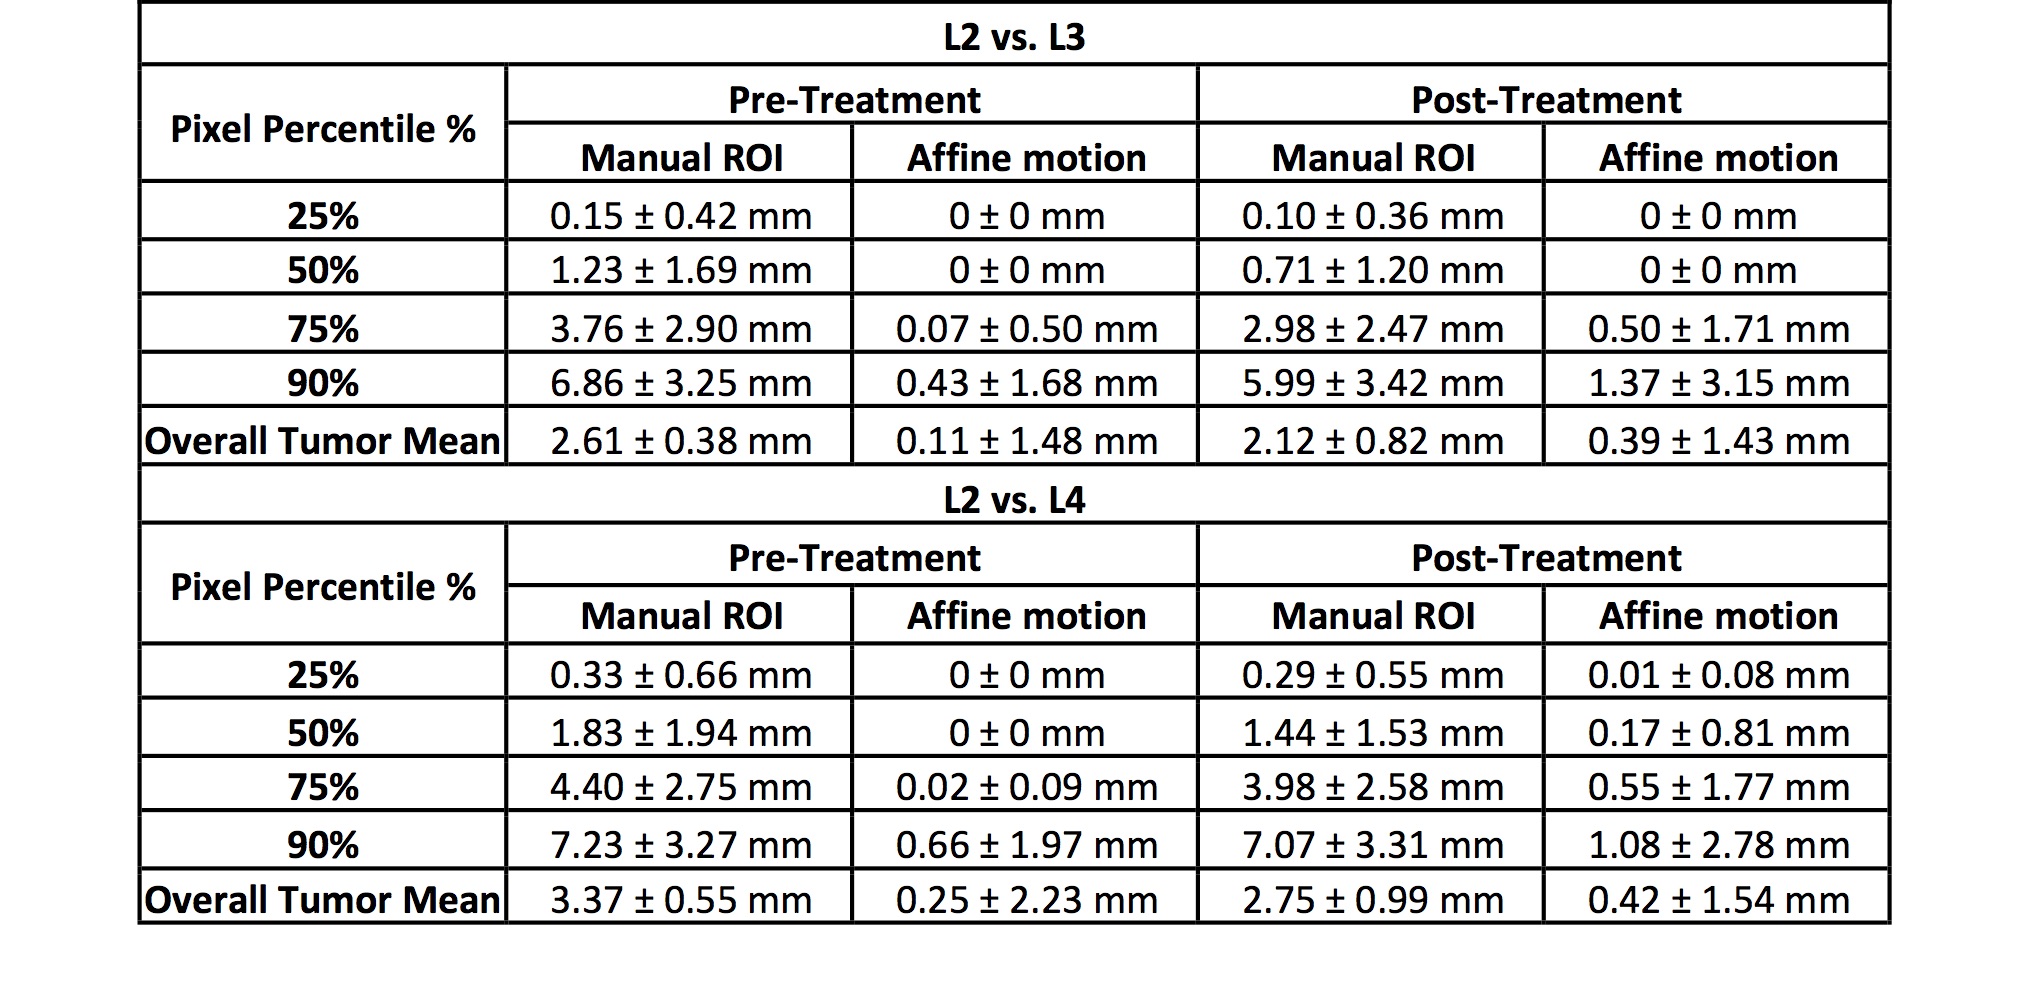
Table 1. The absolute value of the difference in the
radial distance for the 25th, 50th, 75th, and
90th percentile tumor pixel, and the overall mean averaged from all
pixels in the entire tumor, for all 45 cases.