3796
CT-based surrogates of ventilation: A comparison with hyperpolarized Helium-3 and Xenon-129 MRI in lung cancer patients undergoing radiotherapy planning1Polaris, University of Sheffield, Sheffield, United Kingdom, 2Academic Unit of Clinical Oncology, University of Sheffield, Sheffield, United Kingdom
Synopsis
Image registration of lung CT images acquired at different inflation levels has been proposed as a surrogate method to map lung ‘ventilation’ and has notable applications in functionally guided radiotherapy planning. However, the technique requires validation against established ventilation modalities such as hyperpolarized gas MRI. Here, we develop an image acquisition and analysis strategy to facilitate direct spatial correlation of several CT ventilation techniques with both hyperpolarized 3He and 129Xe MRI and apply our method to a cohort of 11 lung cancer patients undergoing radiotherapy.
Introduction
CT-based surrogates of ventilation, (‘CT-ventilation’), which are derived from deformably registered non-contrast pulmonary CT images acquired at different inflation levels have been proposed for regional assessment of ventilation and functionally-guided radiotherapy planning1. However, the physiological accuracy of CT-ventilation has yet to be validated against a direct ventilation imaging modality such as hyperpolarized gas MRI (HP-MRI). Previous comparisons of CT-ventilation with HP-MRI had compared the spatial overlap of binary thresholded images by the dice similarity coefficient2 which provides a global comparison; however, voxel-wise or region of interest (ROI) analysis may improve the comparison by assessing the correlation of the intensity distribution of corresponding regions within the lungs. Although 3He has demonstrated superb visualisation of pulmonary airspaces, due to limited global supplies, 129Xe has recently begun to play a more important role. No hitherto published study has investigated the spatial correlation of CT-ventilation against 129Xe MRI.Purpose
To develop and apply an image acquisition and analysis strategy for direct spatial correlation of several CT-ventilation algorithms with both 3He and 129Xe MRI.Methods
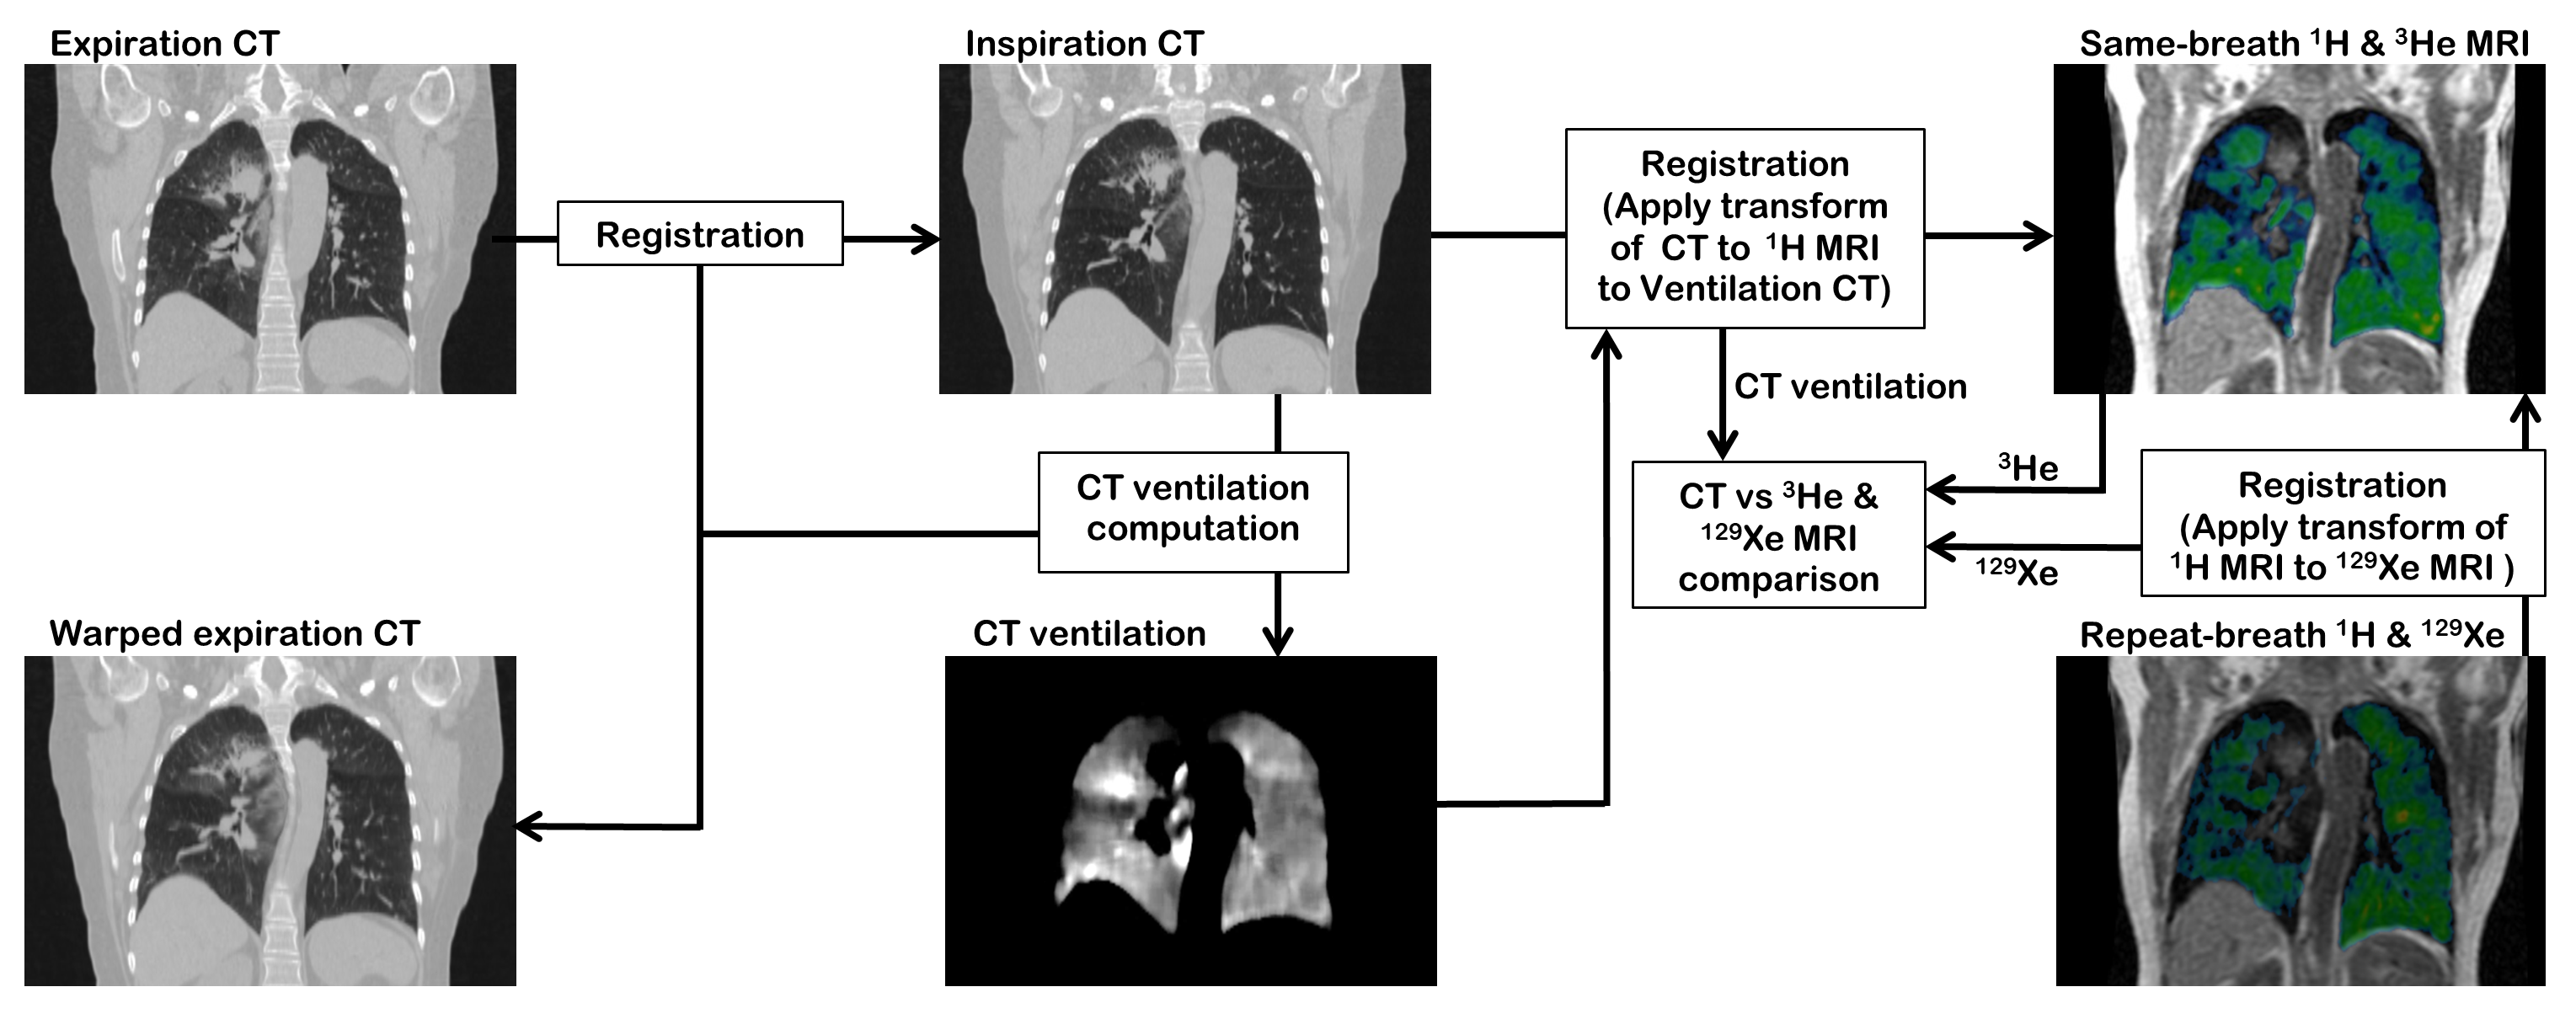
11 lung cancer patients undergoing radiotherapy underwent expiratory and inspiratory breath-hold CT at functional residual capacity (FRC) and FRC+1L, respectively. 129Xe/1H MRI were also acquired at the same inflation state as inspiratory CT. 3He/1H MRI were then acquired in the same breath and inflation state as inspiratory CT. 3He and 129Xe MRI were acquired with 3D balanced steady-state free precession sequences with inhaled doses of 200 ml 3He and 500 ml 129Xe, respectively. Expiration CT was deformably registered to inspiration CT for calculation of CT ventilation from three ventilation metrics: (i) Hounsfield unit change (CTHU), (ii) specific gas volume change (CTSGV) and (iii) the Jacobian determinant (CTJac). Inspiration CT and the 129Xe MRI’s corresponding anatomical 1H MRI were registered to 3He MRI via the same-breath 1H MRI3. Spatial correlation was assessed by computing the Spearman correlation coefficients between each CT-ventilation image and its corresponding 3He/129Xe MR image at the voxel level and for mean values in corresponding ROIs with in-plane dimensions of 5x5, 10x10, 15x15 and 20x20, located within the lungs. As a secondary analysis in order to establish scan-to-scan similarity between 3He and 129Xe MRI, Spearman coefficients were assessed as detailed above.Results
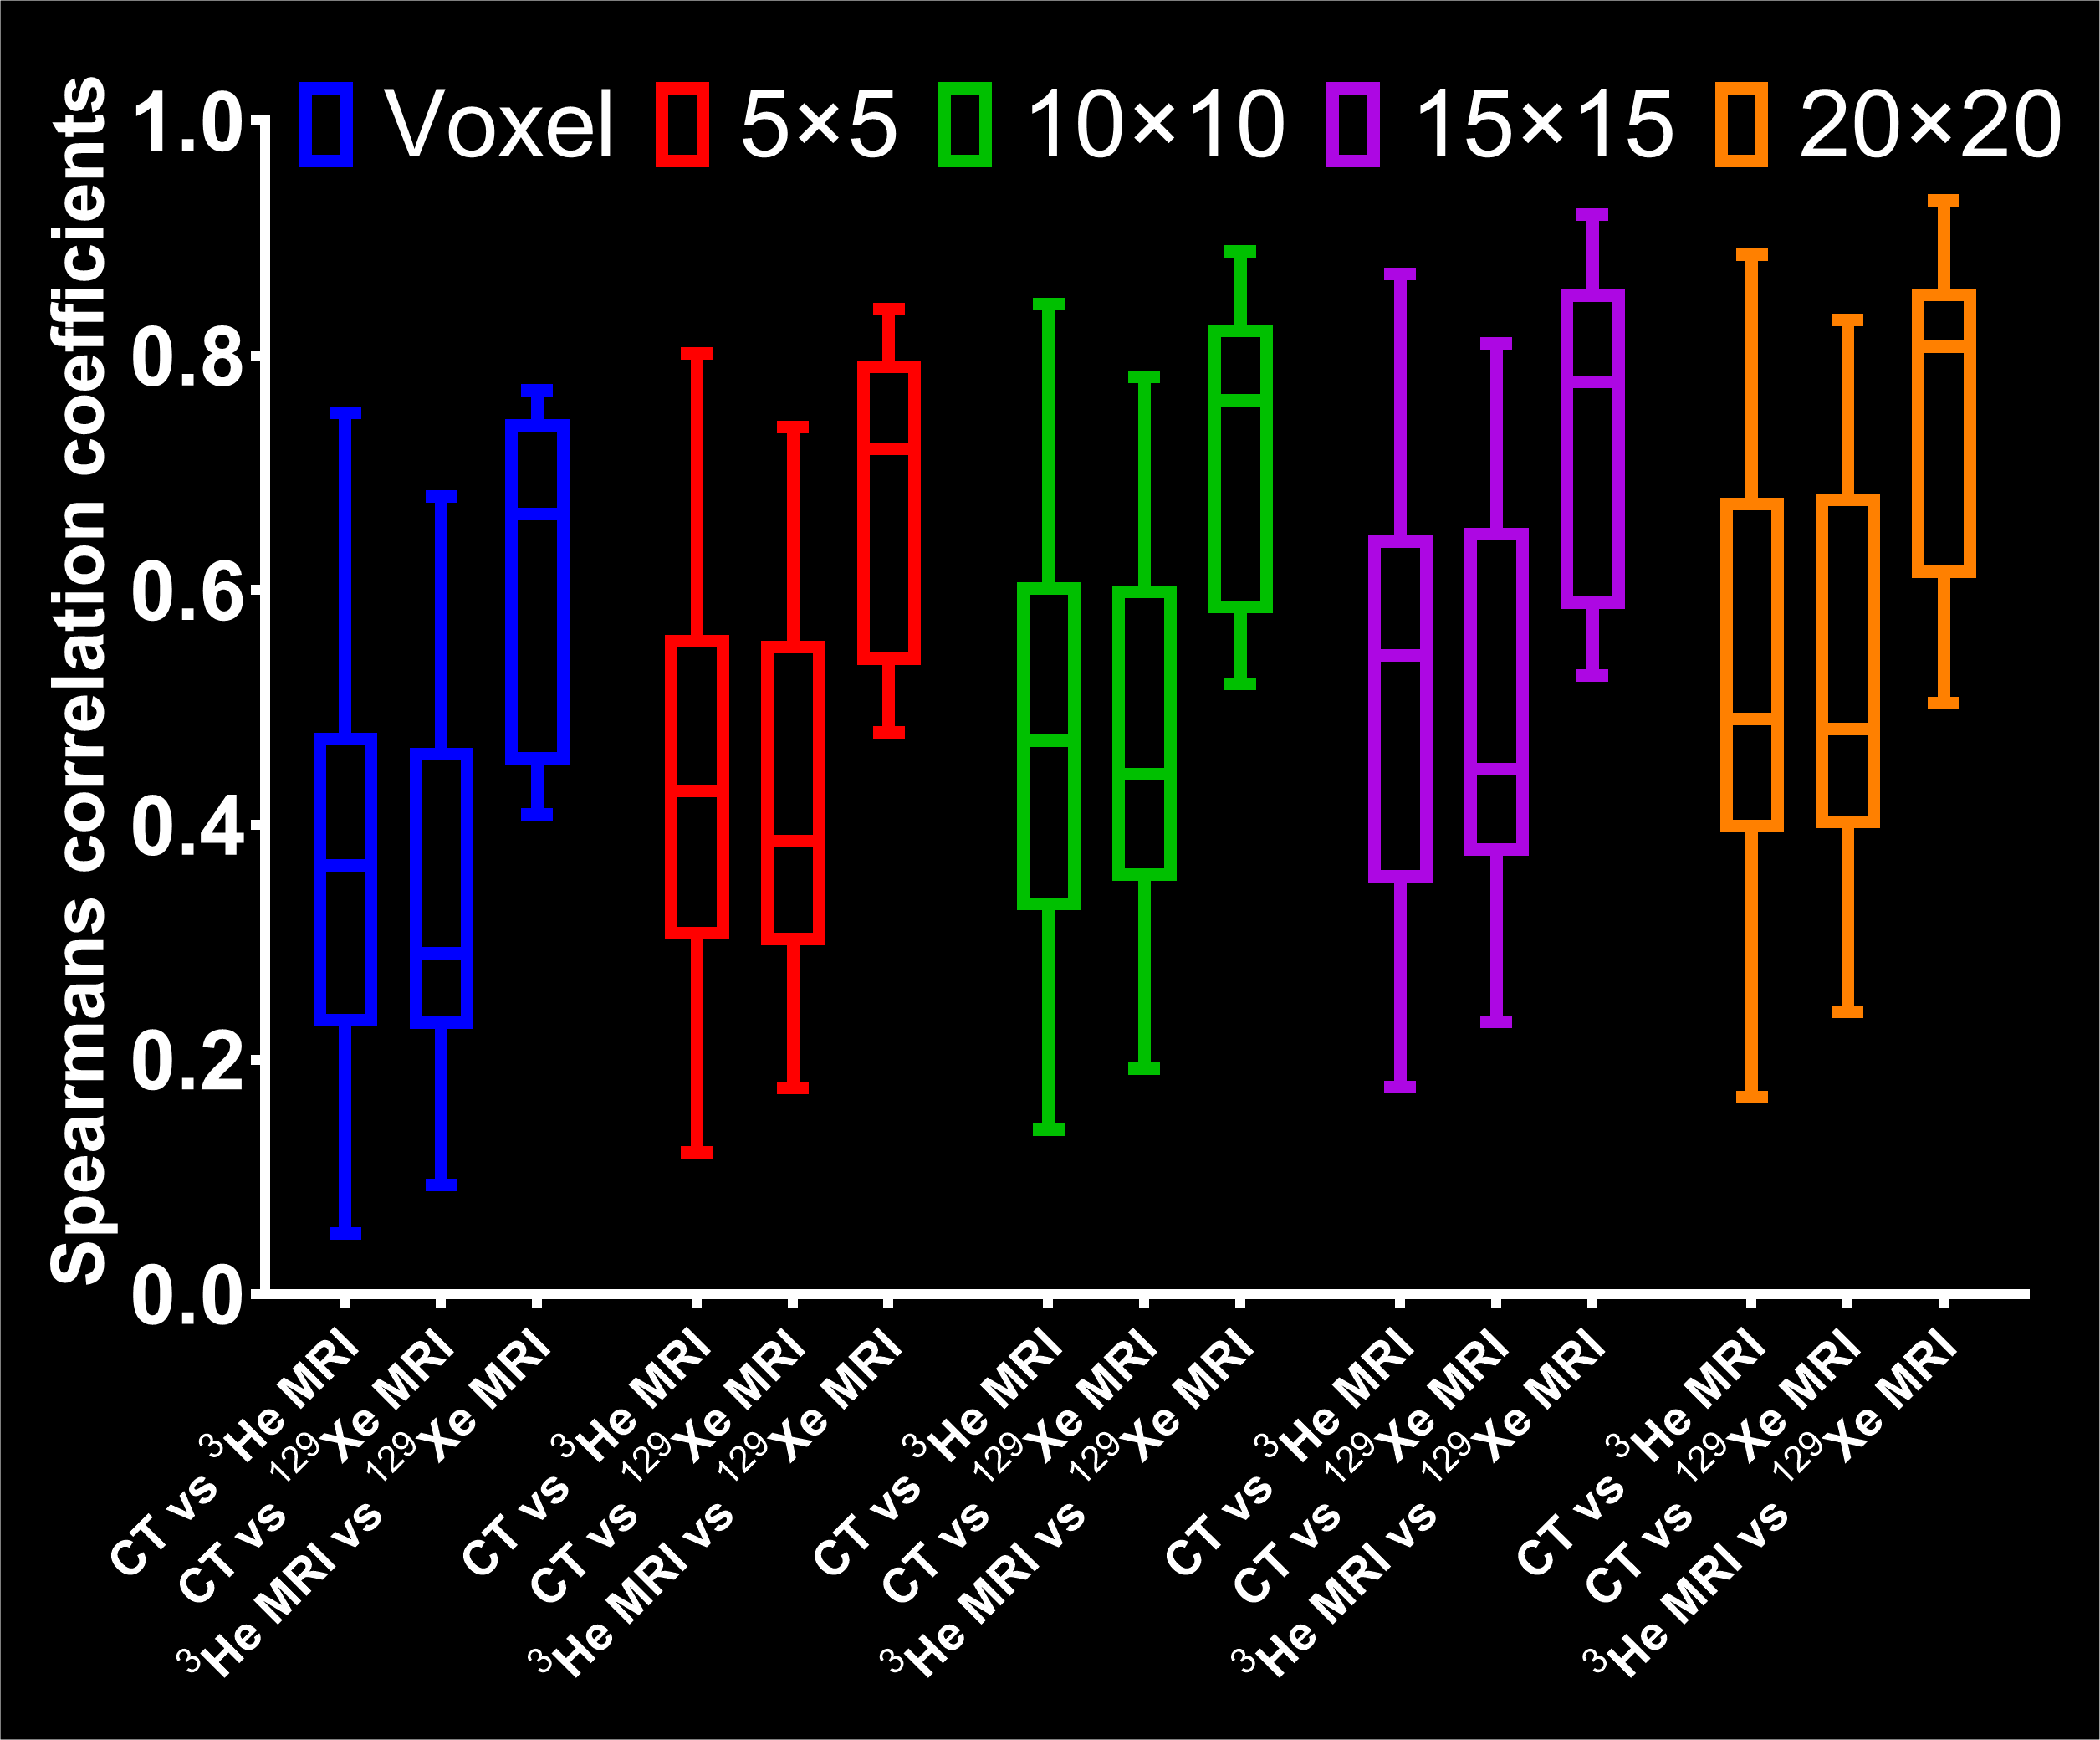
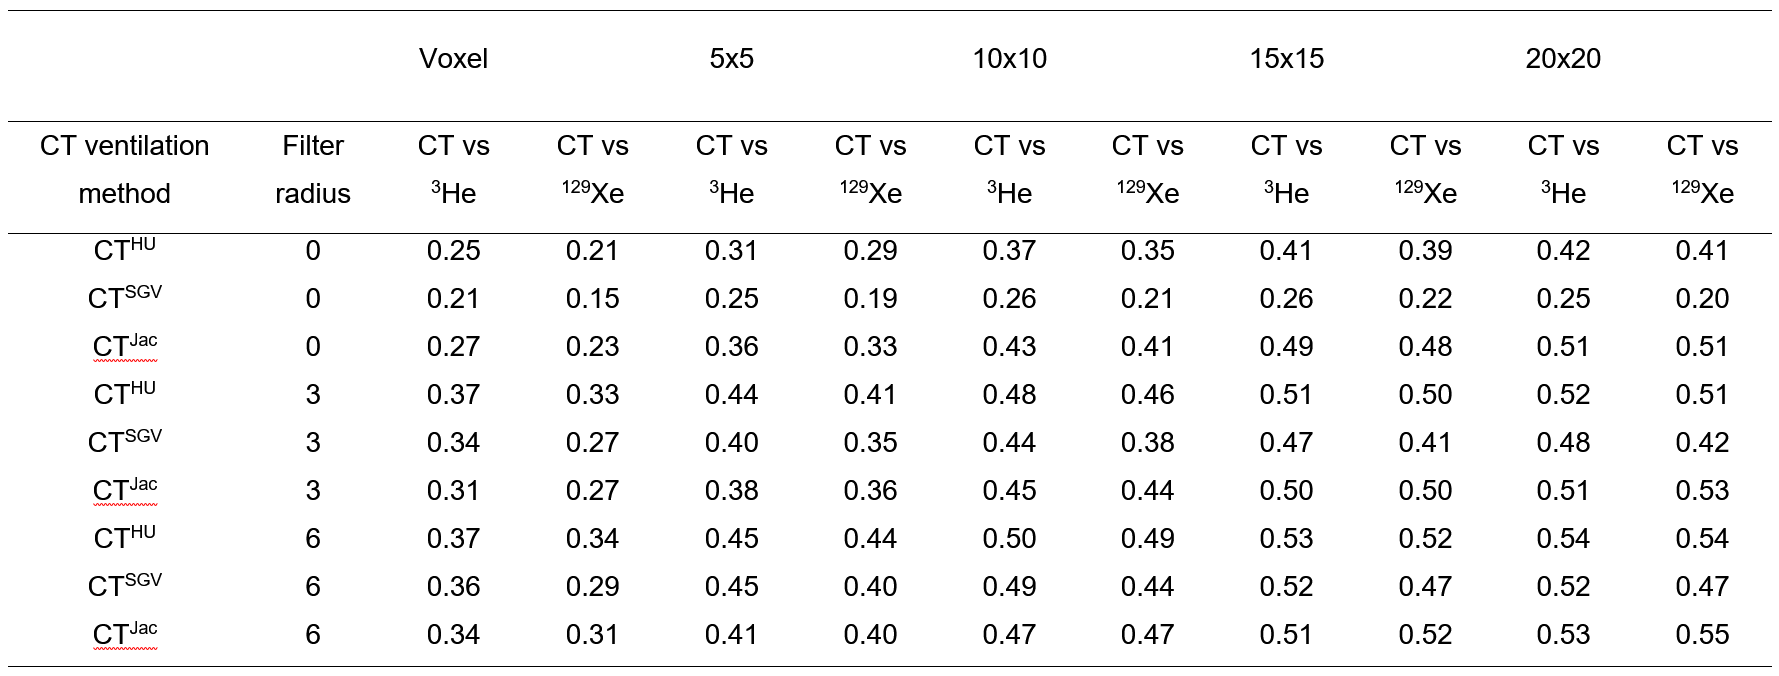
Figure 2 shows corresponding coronal slices of the three CT-ventilation methods (CTHU, CTSGV and CTJAC) filtered with a median radius of 3x3x3 voxels and 3He and 129Xe MRI for two example patients after image registration. The Spearman’s coefficients at the voxel level and for a range of corresponding ROIs between CTHU filtered with a median radius of 3x3x3 voxels against 3He and 129Xe MRI for all patients are shown in Figure 3. Table 1 shows the effects of different CT-ventilation metrics and filtering settings on the correlation of CT-ventilation against 3He and 129Xe.Discussion
The strength of spatial correlations between all CT-ventilation metrics, 3He and 129Xe MRI increase with more coarsely defined kernels with the effect being less on the correlation between 3He and 129Xe. We found that the CTHU metric performed significantly better than the other two metrics studied when filtering was applied whilst CTJac performed better for the voxel-wise comparison when no filtering was applied; CTJac is derived from the deformation field which already undergoes smoothing during the registration process and thus is more robust against outliers.
A marked increase in correlation was observed between 3He and 129Xe MRI compared to between any of the three CT-ventilation surrogates and either 3He or 129Xe MRI. Despite notable similarities, none of the CT-ventilation images were perfectly matched to HP-MRI and marked discrepancies in ventilation distribution were observed. This may be attributable to the fundamental assumption inherent in all the ventilation metrics applied in this study, namely, that changes in lung density and volume between inflation levels are due solely to the influx of air whilst lung perfusion remains regionally unaffected by lung inflation level. However, recent investigations with dual-energy CT have demonstrated that the regional distribution of pulmonary blood volume is sensitive to inflation level4.
Conclusion
We developed an image acquisition and analysis strategy to facilitate a direct spatial correlation of several CT-ventilation methods against 3He and 129Xe MRI. We tested this methodology in a cohort of lung cancer patients and observed moderately low correlations of CT at the voxel level against both gases, which increased for more courser regional analysis. In all cases, the correlation between MRI and CT was significantly less than for 3He vs 129Xe MRI, suggesting that CT-ventilation surrogates are not measuring lung ventilation alone.Acknowledgements
University of Sheffield James Morrison Fund, Sheffield Hospitals Charity, Weston Park Hospital Cancer Charity, National Institute of Health Research and Medical Research Council.References
[1] Int J Radiat Oncol Biol Phys 2005;62:630-634, [2] Acad Radiol 2012;19:1546-1553, [3] Phys Med Biol 2014;59:7267-77, [4] Radiol 2013;267:747-56Figures