3795
Automated analysis of eye tumor MR-images for an improved treatment determination1Radiology, LUMC, Leiden, Netherlands, 2Ophthalmology, LUMC, Leiden, Netherlands
Synopsis
The optimal treatment for uveal melanoma, the most common primary malignant eye tumor, depends on tumor thickness. Conventionally tumor thickness is determined with 2D ultrasound, but MRI allows for a full 3D analysis. It is, however, often difficult to determine the maximum tumor thickness due to its complex 3D shape. We propose a fully automatic framework to segment these MR-images to measure the tumor thickness accurately and evaluate it in four patients. The proposed method has a direct impact on the clinical practice, as a more accurate 3D assessment of the tumor dimensions directly influences therapy determination.
Introduction
Uveal melanoma (UM) is the most common primary malignant eye tumor in adults, which not only affects vision, but also frequently results in life-threatening metastases1. Optimal treatment mainly depends on tumor dimensions. For example, ruthenium plaque brachytherapy, maintains most of the patients’ vision, but is only feasible for tumors thinner than 7mm. Conventionally, tumor thickness is determined with 2D ultrasound. Ocular MRI potentially provides a much more accurate assessment by imaging the tumor in 3D2. However, the complex tumor shape complicates the determination of its maximum thickness. We therefore propose an automatic framework to segment these MR-images and measure tumor thickness accurately.Materials and Methods
Four UM patients were examined on a Philips Achieva 7-Tesla MRI using a custom-built eye-coil. Eye-motion artefacts were minimized by a cued-blinking protocol3. Two scans were analyzed: a 3D inversion recovery turbo gradient echo (TI/TR/TE/tip: 1280 ms/5.4/2.4 ms/7o, shot-interval:3 seconds, turbo factor 92, resolution 0.53×0.55×0.51 mm3, FOV: 40x42x38 mm3, scan time: 3 minutes) and a 3D T2-weighted fat-suppressed spin echo (TR/TE: 2500 ms/194 ms, resolution: 0.6 mm3, scan time: 3 minutes).
Figure 1 illustrates the framework to segment the tumor. The center of the eye was estimated on the T2-weighted image using the fast-radial symmetry transform4. This center was used to build a mesh to detect the outer border of the sclera and the tumor. The sclera mask was used to register the T2- and T1-weighted images using elastix, with normalized mutual information as a similarity metric5,6. Vitreous body (VB) and lens were segmented on the T1-weighted image7. These masks were subsequently subtracted from the sclera mask to segment the tumor. Finally, tumor thickness was determined by calculating the maximum distance between the tumor and sclera. The analysis algorithms were developed using the rapid-prototyping platform MeVisLab (Fraunhofer MeVis,Bremen, Germany).
Results
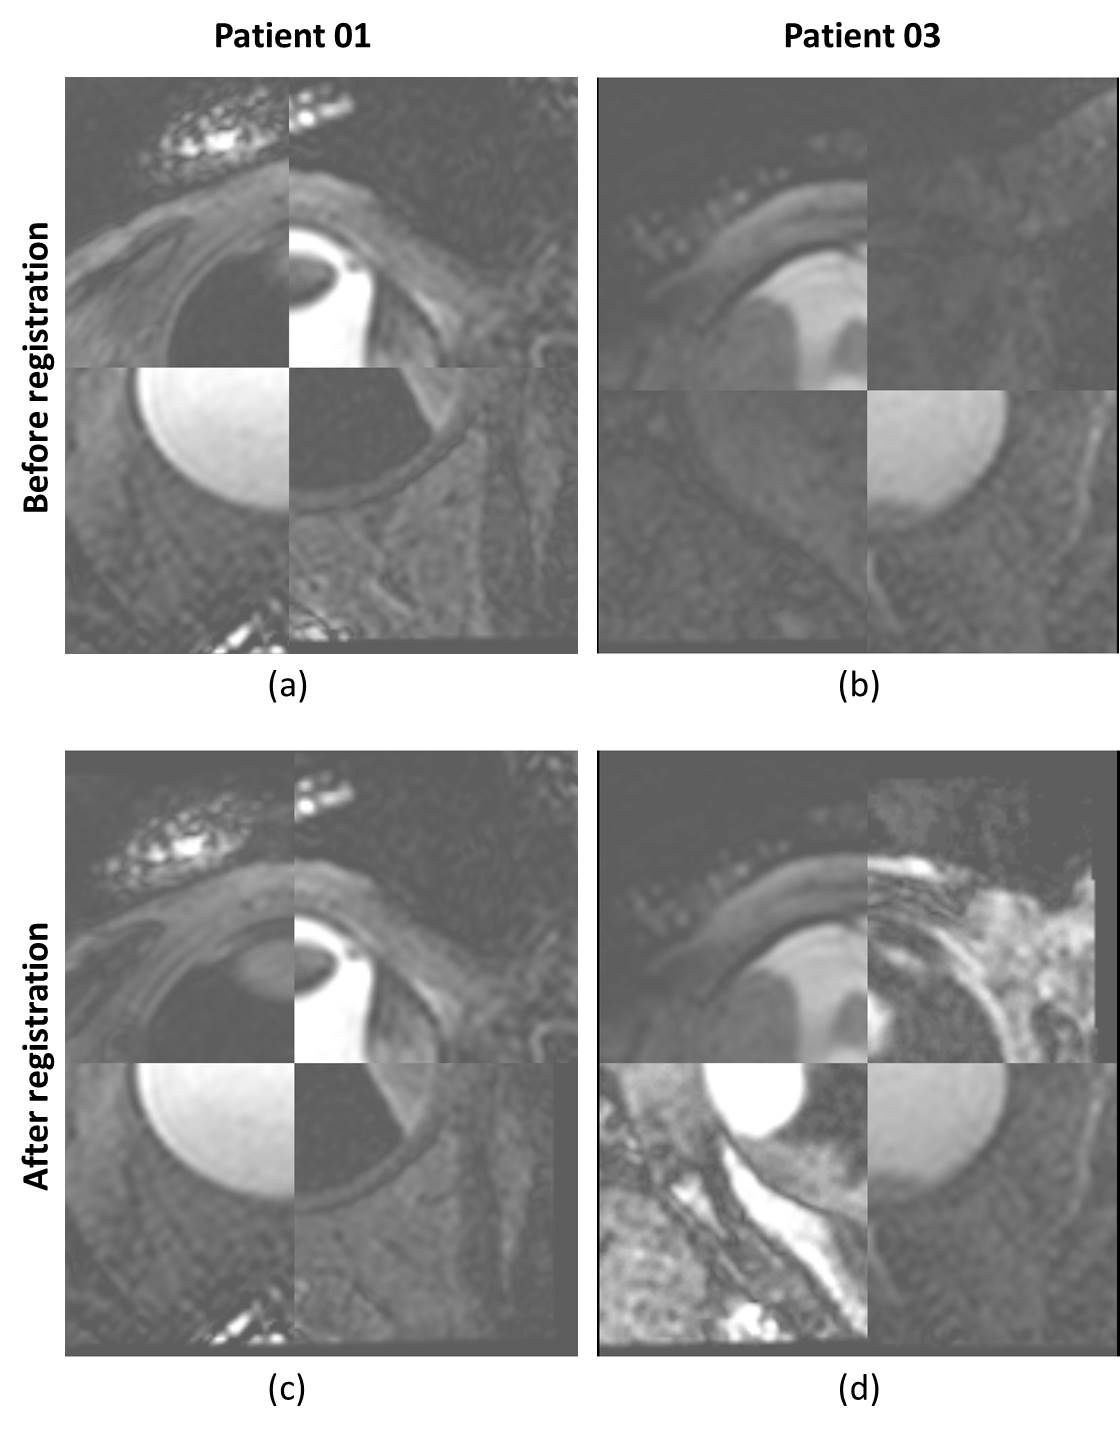
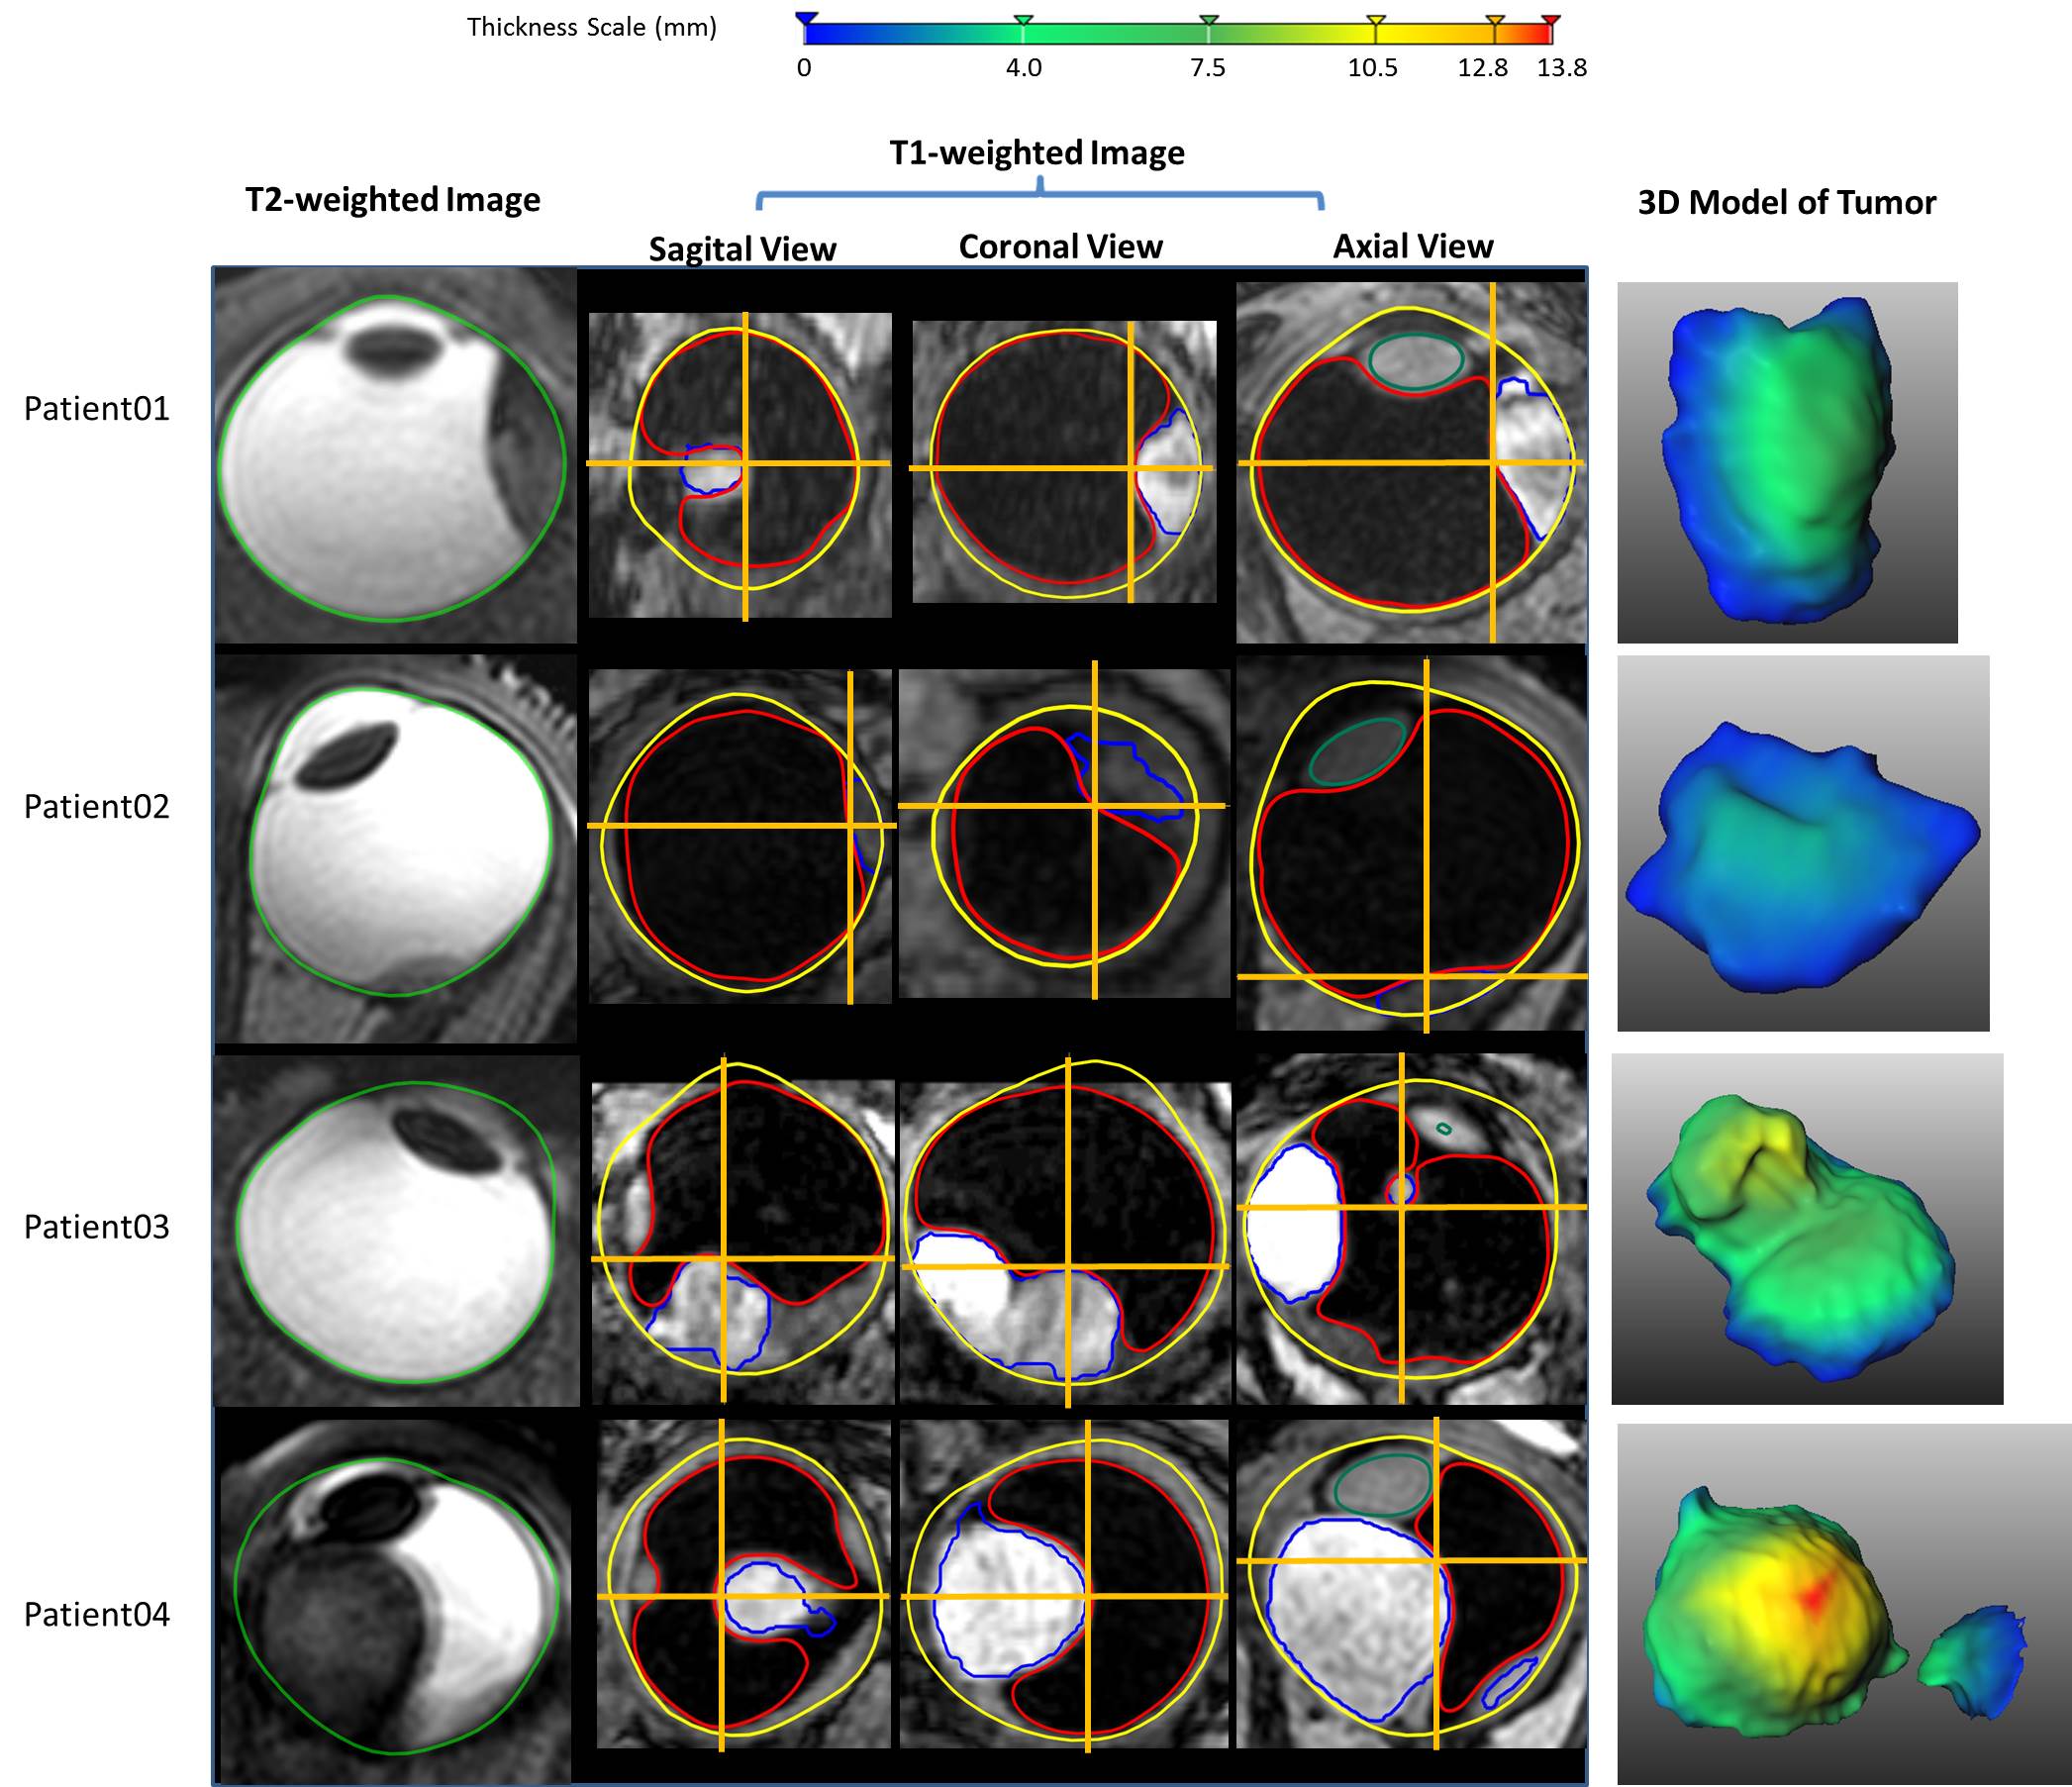
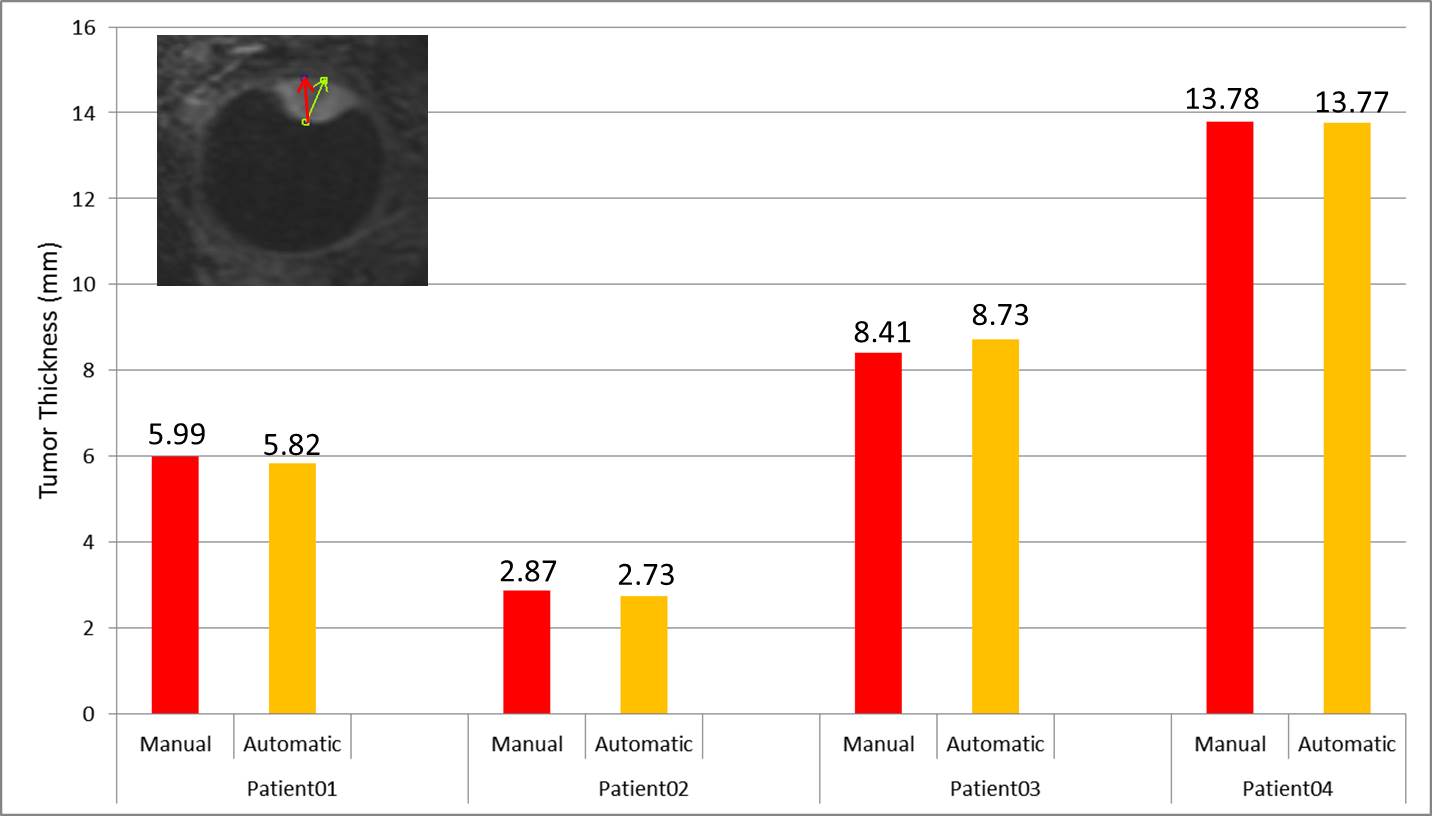
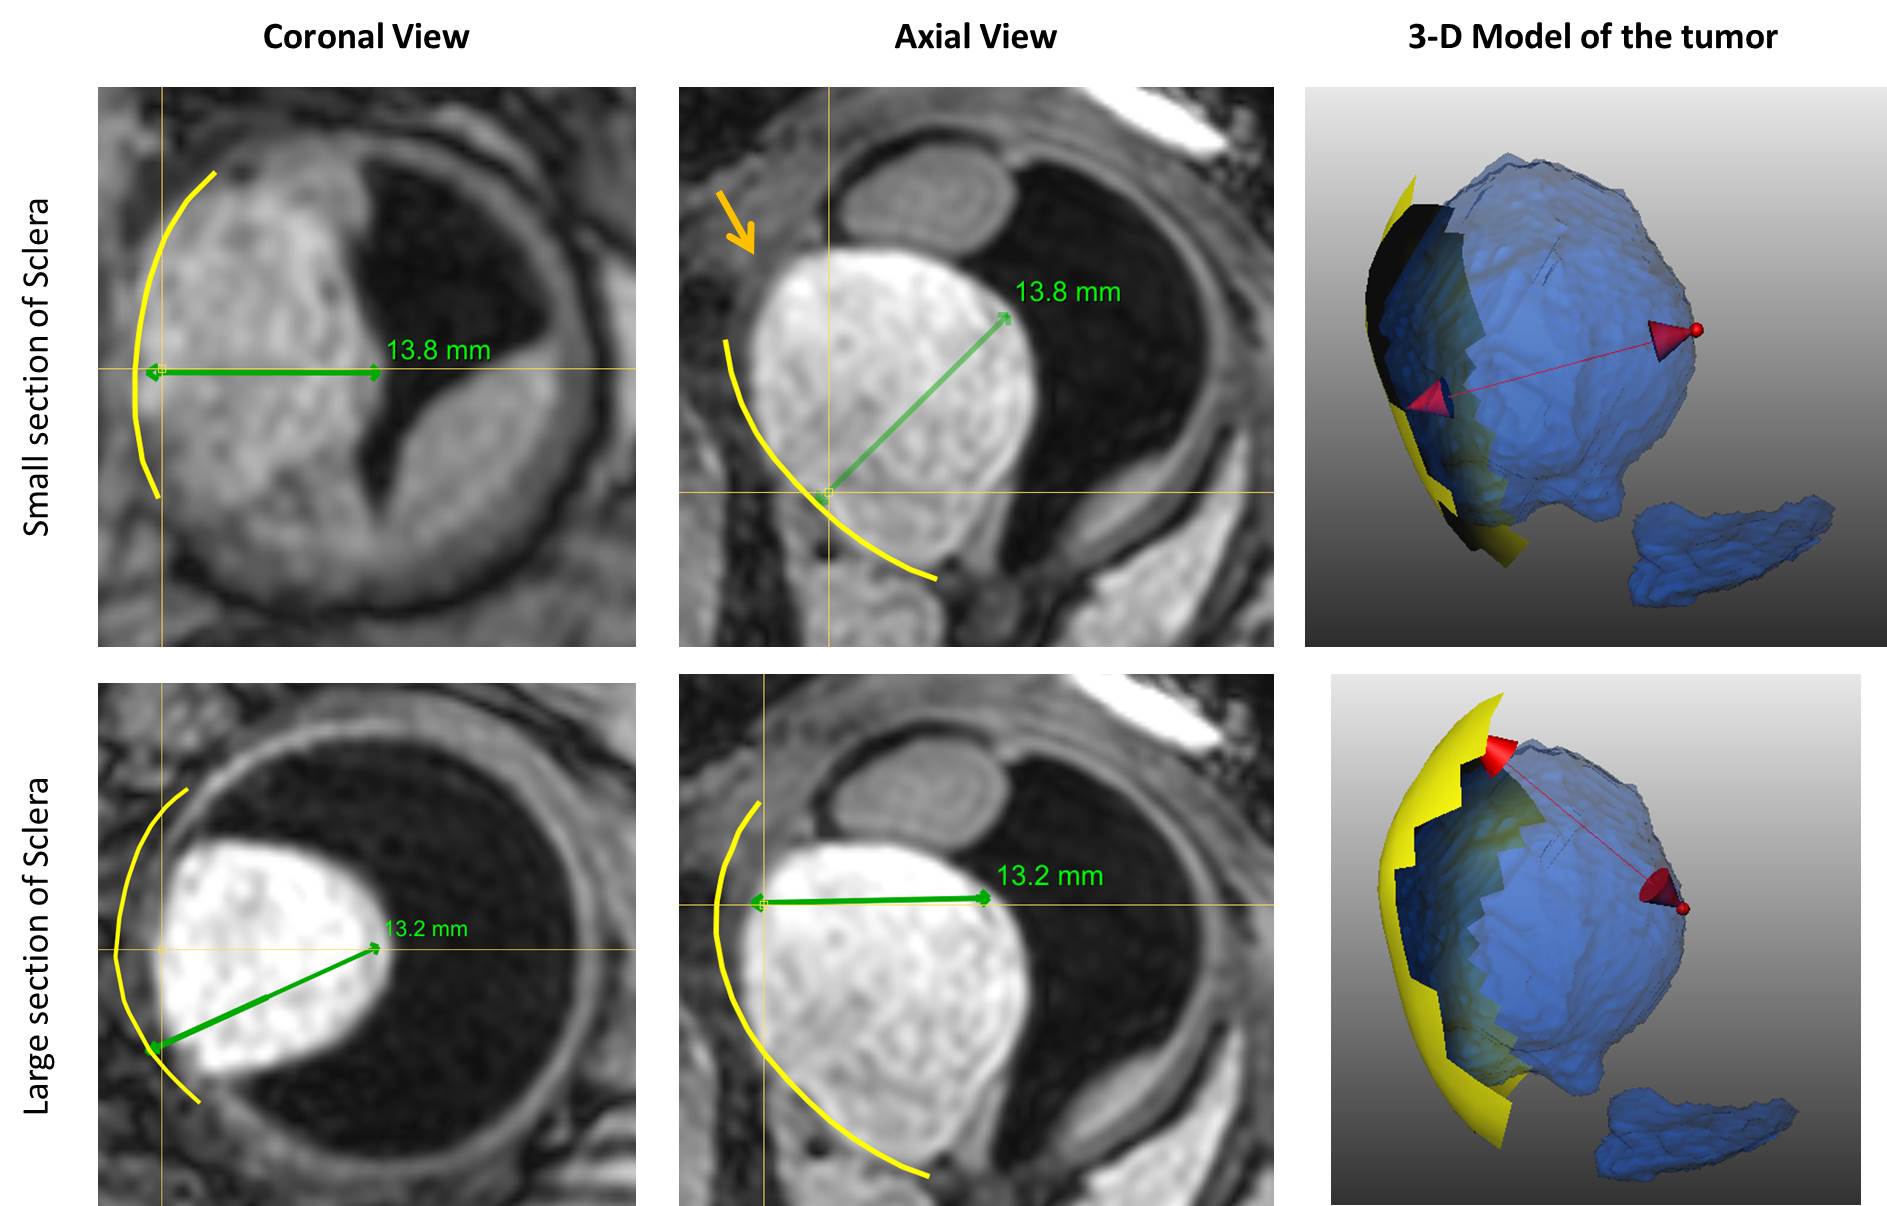
The MRI protocols resulted in high-resolution images of the eye in which the tumor and surrounding tissues could clearly be discriminated. The sclera segmentation succeeded in all subjects and Figure 2 shows an example of the subsequent image registration. The automatic tumor, lens and VB detection are shown in Figure 3, alongside with the 3D thickness maps of the tumors. In Figure 4 a comparison was made between the automatic and manual thickness measurements. Figure 5 shows the benefits of extending the included sclera in the thickness computation for complex tumors for determining the optimal plaque size.Discussion
The proposed automatic method successfully detected the sclera, tumor, lens and VB. In two patients, there was a small error in the sclera segmentation due to signal loss in the anterior part of the eye (patient 3) and motion artefacts (patient 4). However, This did not influence the subsequent steps and, if needed, can be corrected manually.
The benefit of the automatic tumor segmentation and thickness measurement is clearly illustrated in patients 2 and 3. In patient 2, the tumor is located directly on the optic nerve, making it hard to manually define the boundary between tumor and optic nerve. However, the registration of the T1- and T2-weighted images and the assumption of locally smooth sclera allow for a correct determination of the tumor boundaries. The tumor in patient 3 has a complex shape consisting of multiple lobes. For such geometry, the plane and location for the manual measurement is not known a priori. As the automatic method calculates the distance for the complete tumor boundary, it results in a more accurate measurement.
Part of the retina of patient 3 was detached, a common complication of ocular tumors. The fuzzy clustering correctly identified the tumor as the brightest region. As this may not be valid for all cases, the inclusion of a post-gadolinium scan in the analysis may provide a robust differentiation between tumor and retinal detachment.
Conventionally, the tumor thickness is determined towards the tumor base. By extending this base, however, a smaller tumor thickness can potentially be defined, which might enable more conservative therapeutic options (Figure 5).
Applying the proposed 3D segmentation can also improve proton radiation therapy (PT) planning, which currently relies on manual delineation of the tumor margins on 2D ultrasound images. A 3D MR-based model of the tumor and surrounding structures would allow for a more accurate treatment plan, sparing sensitive structures such as lens and optic nerve.
Conclusion
We have shown an automatic segmentation pipeline for MR-images for UM patients. The proposed method has a direct impact on the clinical workflow, as it enables a more accurate 3D assessment of the tumor dimensions, which directly influences therapy determination.Acknowledgements
This project was funded by The Netherlands Organisation for Scientific Research (NWO). Project name: Protons4Vision, with number 14654.References
- Singh AD, Turell ME, Topham AK. Uveal melanoma: trends in incidence, treatment, and survival. Ophthalmology. 2011;118(9):1881–1885.
- Beenakker JW, Ferreira TA, Soemarwoto KP, Genders SW, Teeuwisse WM, Webb AG, Luyten GP. Clinical evaluation of ultra-high-field MRI for three-dimensional visualisation of tumour size in uveal melanoma patients, with direct relevance to treatment planning. MAGMA. 2016;29(3):571-7.
- Beenakker JW, van Rijn GA, Luyten GP, Webb AG. High-resolution MRI of uveal melanoma using a microcoil phased array at 7 T. NMR Biomed. 2013;26(12):1864-9.
- De Zanet SI, Ciller C, Rudolph T, Maeder P, Munier F, Balmer A, Cuadra MB, Kowal JH. Landmark detection for fusion of fundus and MRI toward a patient-specific multimodal eye model. IEEE Trans Biomed Eng. 2015;62(2):532-40.
- Klein S, Staring M, Murphy K, Viergever MA, Pluim JP. elastix: a toolbox for intensity based medical image registration. IEEE Trans Med Imaging. 2010;29(1):196-205.
- Shamonin DP, Bron EE, Lelieveldt BP, Smits M, Klein S, Staring M. Fast Parallel Image Registration on CPU and GPU for Diagnostic Classification of Alzheimer’s Disease. Front Neuroinform. 2014;7(50):1-15.
- Beenakker JW1, Shamonin DP2, Webb AG3, Luyten GP4, Stoel BC. Automated retinal topographic maps measured with magnetic resonance imaging. Invest Ophthalmol Vis Sci. 2015;56(2):1033-9.
Figures