3794
MR-only Radiation Therapy Planning in the pelvis using Zero TE and LAVA-Flex based pseudo CT conversion.1GE Healthcare, Munich, Germany, 2Umeå University, Umeå, Sweden, 3GE Healthcare, Danderyd AB, Sweden
Synopsis
In this study, we demonstrate Zero TE (ZTE) and LAVA-Flex based pseudo CT conversion suitable for dose calculation for MR-only Radiation Therapy Planning (RTP) in the Pelvis. The dose planning performance of this method was evaluated in N=11 patients and compared to corresponding CT dose plans.
Introduction:
The advantage of MR-only radiotherapy planning over CT is the excellent soft tissue contrast. In addition, an MR-only workflow would avoid systematic registration errors between MRI delineated structures and the CT, particularly when dealing with prostate cancer patients [1, 2]. The purpose of this study is to demonstrate ZTE and LAVA-Flex based derivation of pseudo CT for MR-only RT planning in the Pelvis.Methods:
N=30 patients were enrolled in this study and N=11 have been evaluated at the time of writing this abstract. A 3-tesla GE SIGNA PET/MR scanner (GE Healthcare, Chicago, IL) in combination with a GEM body array coil was used for proton density weighted ZTE imaging: FA=1deg; BW=±62.5kHz; FOV=46cm; res=2.4mm. A CT scan was also provided for each patient.
A stepwise conversion of the MR data into pseudo CT images was developed. First, ZTE data were normalized by setting the soft tissue intensity peak to 1 and a local, 2nd order, signal intensity-weighted polynomial fitting was applied to correct for spatial sensitivity variations [3]. LAVA-Flex data were used to define outer body contours. These contours were applied to the ZTE data for body segmentation. A connected component analysis for ZTE values comprised between air and soft tissue values (0.1<ZTE<0.85) was applied for a first bone structure identification. A smoothed bone mask generated from 3 averaged CT pelvic bones was then rigidly co-registered to the largest connected ZTE bone structures. An iterative thresholding of increasing ZTE intensity values (up to ZTE=0.95) was then applied to the ZTE data allowing the recovery of low density bone pixels in the regions overlapping with the co-registered and smoothed CT mask. Using the mask guidance prevented also from assigning false positive bone to air pockets for example in the abdomen. Similarly, fat and water information from the LAVA-Flex acquisition was used to complete the femur head structure along the mask position. A final connected component analysis eliminated spurious small false bone agglomerates. A fixed value of -1000 HU (Hounsfield Units) and 42 HU was assigned respectively to air and soft tissue, while for bone an inverse linear scaling was used. Partial volume effects (PVE) at the boundary between soft tissue and air as for example in the skin region were identified and reclassified based on neighborhood information. Fat values from LAVA-Flex data were assigned to a fixed value of -50 HU.
Rigid registration was used to match corresponding CT scans for each patient. The ZTE based pseudo CTs were then imported into the RTP software (RayStation, RaySearch, Stockholm, Sweden). To avoid registration issues and differences in the pelvic air distribution between the CT and the MRI scans the outer body contouring and air distribution from the CT dose plan was exported to the MRI data. Any pixel outside the CT external contour was set to -1000 HU for the pseudo CT, and any gas pocket inside the external contour were set to soft tissue (42 HU) for both the pseudo CT and the CT. A treatment plan was finally computed on the CT set, evaluated on both sets and compared. Dose distributions for both evaluated plans were then exported from the treatment planning system MICE (Medical Interactive Creative Environment, [4]) to perform a gamma analysis over the full volume as defined by the CT scan.
Results:
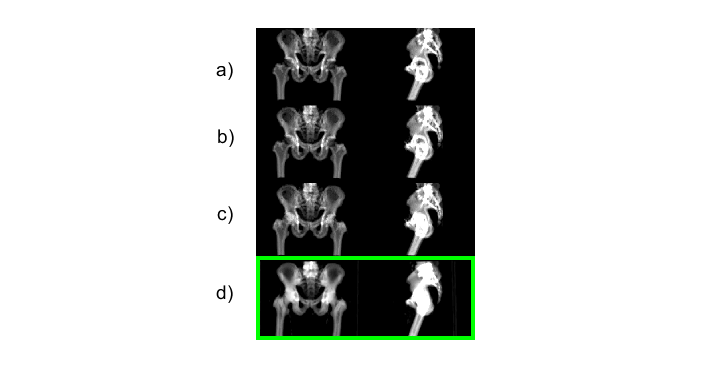
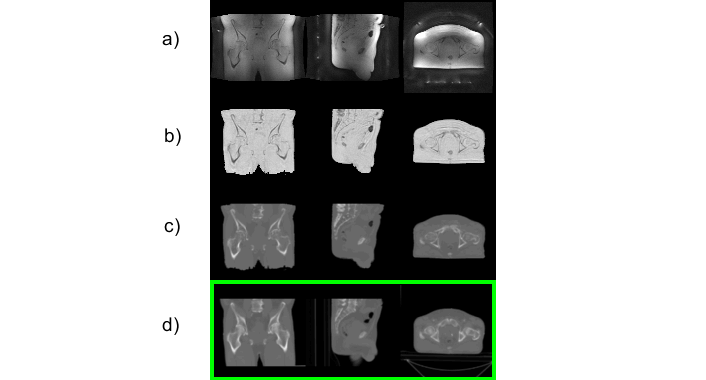
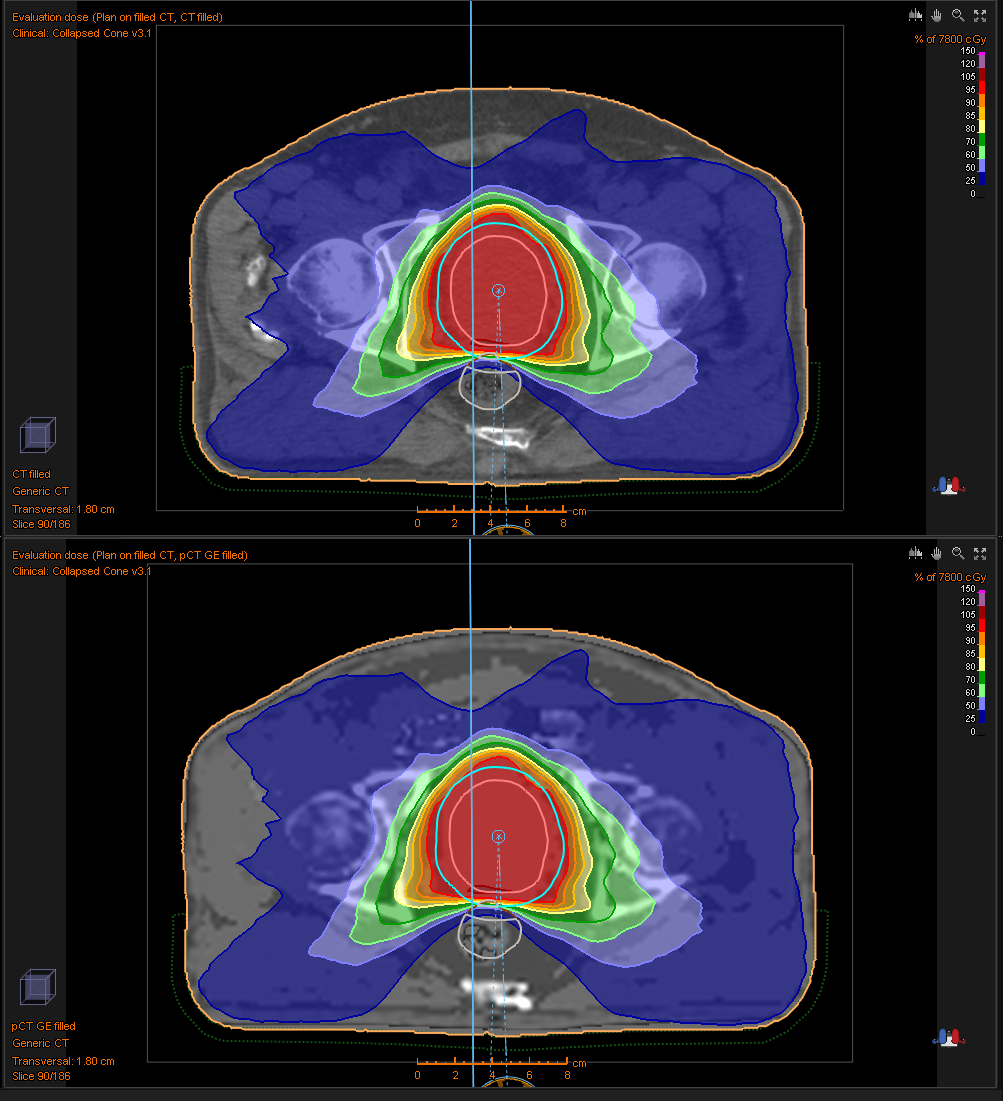
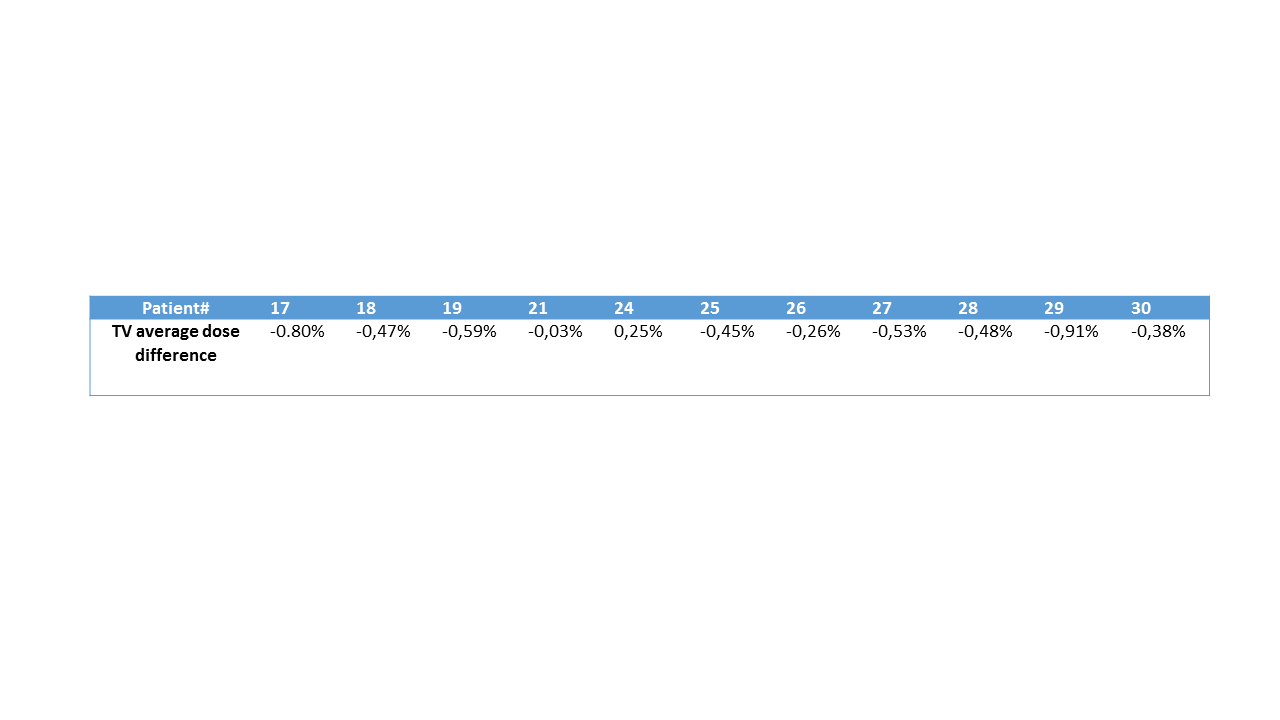
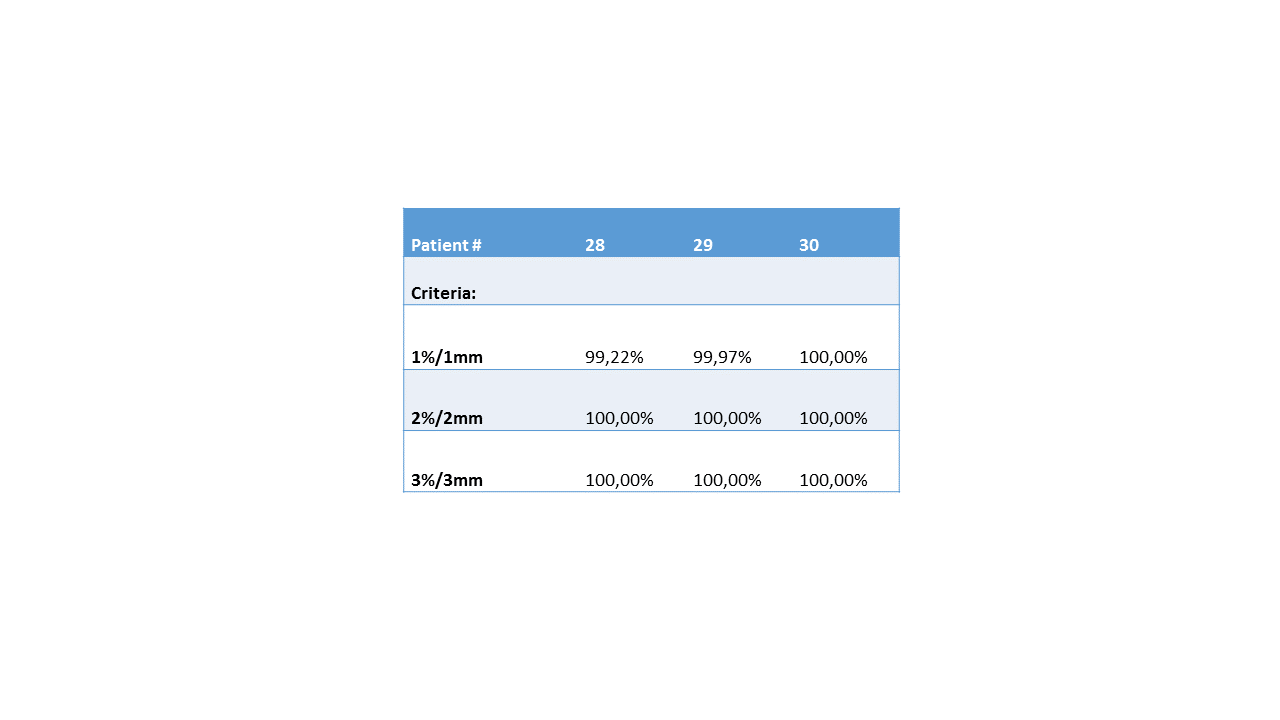
In Figure 1 the sequence of the ZTE bone identification procedure is shown and compared to the corresponding CT data at the bottom. In Figure 2 the ZTE raw data (top row), the ZTE bias corrected data (second row) as well as the pseudo CT (third row) and the original CT data (bottom row) are shown. A treatment planning example for the pseudo CT and the real CT is shown in Figure 3. The TV average dose difference for all evaluated patients is shown in Table 1. In Table 2 Gamma pass rate calculated over the full volume as defined by the CT are shown for three patients. It is important to note, that registration and motion errors are minimized by using the same CT-defined body contour and internal air distribution in both cases.Discussion and Conclusion:
The feasibility of the ZTE pseudo CT conversion for MR based Radiation Therapy planning for Pelvis was demonstrated. The correspondence between pseudo CT and real CT and the bone depiction for both imaging modes was shown. The deviations on the PTV are <1% for all analyzed patients demonstrating that the ZTE plus LAVA-Flex protocol and the derived pseudo CT are suitable for MR-only based Radiation Therapy Planning.Acknowledgements
No acknowledgement found.References
[1.] McGee, Kiaran P., et al. "MRI in radiation oncology: Underserved needs." Magnetic resonance in medicine 75.1 (2016): 11-14.
[2.] Edmund, Jens M., and Tufve Nyholm. "A review of substitute CT generation for MRI-only radiation therapy." Radiation Oncology12.1 (2017): 28.
[3.] Wiesinger, Florian, et al. "Zero TE MR bone imaging in the head." Magnetic resonance in medicine 75.1 (2016): 107-114.
[4.] T. Nyholm, et al, 3rd ESTRO Forum, 2015
Figures