3792
CT synthesis for MR-only brain radiotherapy treatment planning using convolutional neural networks1Radiation Oncology, UMC Utrecht, Utrecht, Netherlands, 2Image Sciences Institute, UMC Utrecht, Utrecht, Netherlands
Synopsis
In MR-only radiotherapy, a synthetic CT (sCT) needs to be generated from MR to allow radiation dose planning without CT acquisition. We aim for such an MR-only workflow to decrease radiotherapy preparation time. If we can plan and deliver the dose in a single day, in a ‘one stop shop’ procedure, we prevent treatment delay which is of high importance for patients with fast growing brain metastases. In this study sCTs of the head were generated in a short amount of time, that highly resemble the original CTs and that enable accurate dose calculation.
Introduction
In radiotherapy MRI is emerging as preferred imaging modality due to its superior soft tissue contrast to visualize cancer. The next step is to switch to a so-called MR-only radiotherapy (RT) workflow. In such a workflow, we omit the CT scan that is normally acquired for radiation treatment planning. This may facilitate an accelerated start of treatment and minimize tumor growth of brain metastases. To still obtain electron density information for accurate dose calculations, a synthetic CT (sCT) needs to be derived from MRI. Recently, deep learning methods have been proposed to generate sCTs with convolutional neural networks (CNN)1,2,3. These methods typically utilize conventional MRI sequences, whereas intensity-based conversion models for sCT generation often apply multiple image contrasts, including short echo time acquisitions to differentiate bone from air4. Furthermore, unlike atlas-based methods relying on time consuming registrations4, CNNs allow fast sCT generation, which is of importance in MR-guided RT. Hence, the purpose of this study is to evaluate the accuracy of dose calculation based on sCT images generated using a dilated CNN optimized for brain images.Data
We have retrospectively selected 52 patients who underwent brain RT for which a sagittal 3D T1w gradient echo MRI, FA=8º, TR/TE=4.9/2.1 ms, BW=240Hz/vox (1.5T Philips Ingenia) was available. Since this sequence was present in multiple protocols for contouring of brain tumors and organs-at-risk, a variety of tumor locations were included (38 brain metastases, 6 meningiomas, 4 pituitary gland ca, 3 vestibular schwannoma and 1 glioblastoma). CT scans (Philips Brilliance Big Bore) were acquired helically (120 kVp, 450 mAs) usually on the same day as the MRI (range: 0-4 days). To prepare the images for training, the immobilization mask was removed from the background of the CT and linear normalization was applied to the MR. CTs were rigidly aligned and resampled to the MR grid (0.87x0.87x1 mm3).Experiment
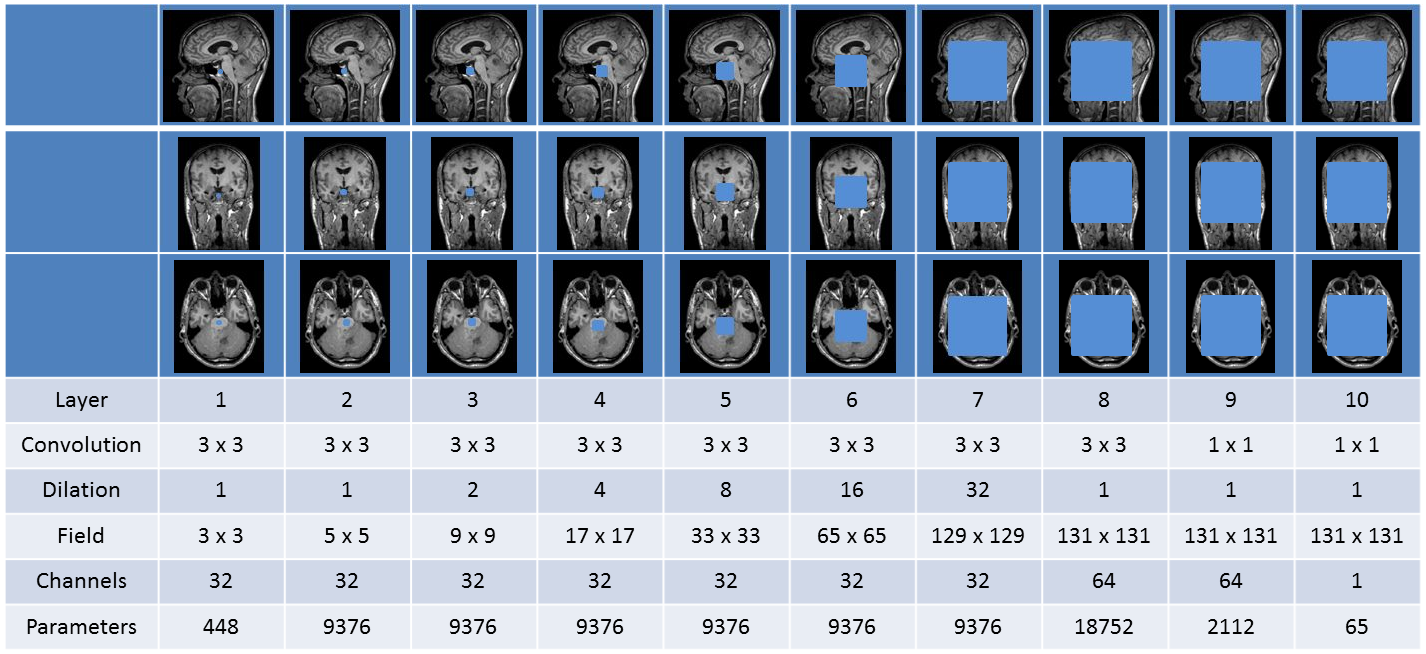
We used a dilated CNN as described by Wolterink et al.5. This network has a large receptive field (fig 1), while the number of trainable parameters is kept low, preventing potential over-fitting. The network was trained to synthesize 2D axial, sagittal and coronal CT slices based on MR slices6. After training, a volumetric sCT was created by averaging the results obtained in three directions. Hence, for each voxel in the sCT image, the synthesized HU value depended on 131x131 pixel receptive fields in three orthogonal MR planes. A two-fold cross validation experiment was performed. In both folds images of 26 patients were used for training and images of 26 patients were used for evaluation. The accuracy of the 52 sCTs was evaluated by calculating the Mean Absolute Error (MAE) and Mean Error (ME) with respect to the reference CT. Clinical dose plans were recalculated in Monaco TPS (v 5.11.02, Elekta AB, Sweden) on the resampled CT and sCT to determine dose calculation accuracy. Dose distributions were evaluated by calculating voxel-based dose differences and gamma pass rates using a 2 mm/2% criterium.Results and Discussion
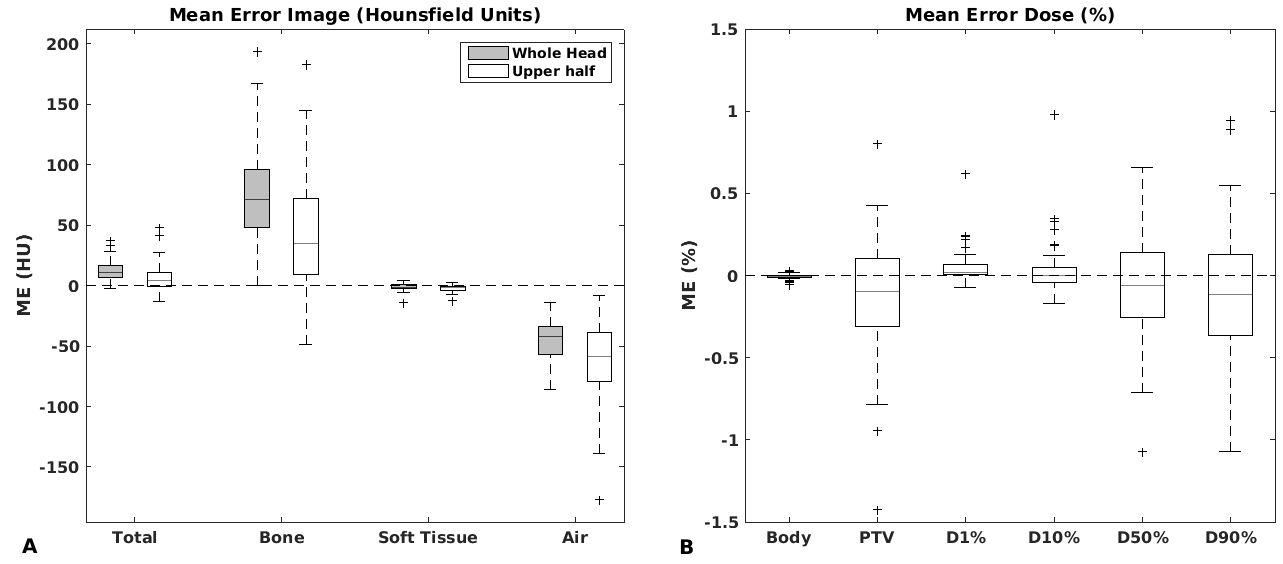
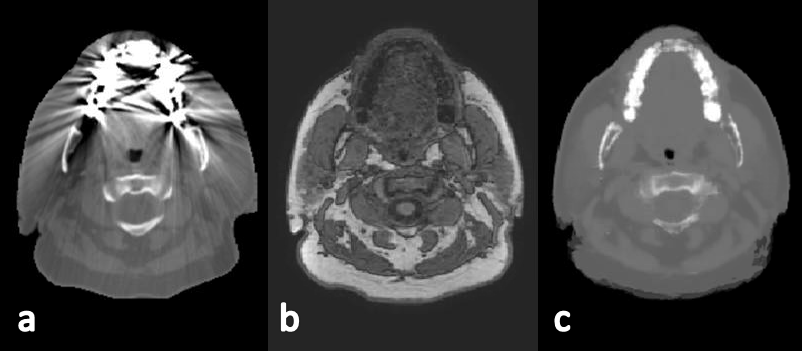
Whereas training of the CNN using a NVIDIA Titan X GPU took 30 hours, to generate an sCT volume from MRI took 1 min. The short time required for sCT generation makes this method suitable for online MR-guided RT. The average MAE of the sCT within the intersection of body contours between CT and sCT was 67±11 HU (±1SD, range :51-117). Mean errors of the sCTs seem small compared with literature (fig 2a)4. The errors were lower in the cranium, which is the region of interest in brain RT. MEs of the dose were within ±1% (fig 2b). An example of an sCT is shown for one patient (fig 3), as well as the recalculated dose distributions for this patient (fig 4). Mean gamma pass rate was 99.3%±2.1% (±1SD, range: 89.9-100%) for dose above 90% of prescription dose. Despite minor differences in Hounsfield Units, dose distributions and gamma pass rates proved high accuracy of sCT-based dose calculations demonstrating clinical acceptance levels. In addition, generating sCTs by a CNN offers a solution to patients with dental implant causing strong streaking artifacts on conventional CT (fig 5).Conclusion
Notwithstanding a wide variety of tumor locations used in this study, the radiation dose could be calculated accurately on the synthesized CTs. sCTs were created with conventional MR images in a short amount of time. This work is a first step in achieving a fast MR-only workflow to decrease time to start of treatment and burden to the patient. Future research will focus on automatic contouring of organs at risk using a CNN to further reduce preparation time.Acknowledgements
The research is funded by ZonMw IMDI Programme, project number: 1040030. The project is co-funded by Philips HealthcareReferences
1. Han. MR-based Synthetic CT generation using a deep convolutional neural network. Med. Phys. 2017;44(4):1408-1419.
2. Nie et al. Medical image synthesis with Context-Aware Generative Adversarial Networks. arXiv 1612.05362v1 2016.
3. J.M. Wolterink et al. Deep MR to CT synthesis using unpaired data. Sashimi 2017, LNCS 10557.
4. J.M. Edmund and T. Nyholm. A review of substitute CT generation for MRI-only radiation therapy. Radiat. Oncol. 2017;12(1):28.
5. J.M. Wolterink et al. Dilated convolutional neural networks for cardiovascular MR segmentation in congenital heart disease. RAMBO 2016/HVSMR 2016, LNCS 10129. 2017;95-102.
6. H.R. Roth et al. A New 2.5D representation for lymph node detection using random sets of deep convolutional neural network observations. Med. Image Comput. Comput. Assist. Interv. 2014;17(0 1):520–527.
Figures