3791
Atlas-based volumetric assessment of T2 abnormality in acute spinal cord injury predicts motor outcomes: A transforming research and clinical knowledge in spinal cord injury (TRACK-SCI) pilot study1Radiology and Biomedical Imaging, Zuckerberg San Francisco General Hospital and UCSF, San Francisco, CA, United States, 2Brain and Spinal Injury Center, San Francisco, CA, United States, 3Neurological Surgery, Zuckerberg San Francisco General Hospital and UCSF, San Francisco, CA, United States, 4Emergency Medicine, Zuckerberg San Francisco General Hospital and UCSF, San Francisco, CA, United States, 5Neurology, Zuckerberg San Francisco General Hospital and UCSF, San Francisco, CA, United States, 6Orthopedic Surgery, Orthopedic Trauma Center at ZSFG, San Francisco, CA, United States, 7San Francisco VA Medical Center, San Francisco, CA, United States, 8Weill Institute for Neurosciences, San Francisco, CA, United States
Synopsis
MR evaluation of intrinsic cord signal abnormality relies on gross morphologic imaging measures such as T2-hyperintense lesion length and subjective patterns of T2 signal abnormality. In the current study, we register T2w images and manually segmented lesions from acute SCI patients to a spinal cord (SC) anatomical template in order to calculate volumes of damaged tissue in 22 probabilistic anatomical subdomains of the SC. We identify specific anatomic subdomains in the SC which serve as MR biomarkers of motor impairment and indirectly support neuro-protective strategies targeting ventral horn and lateral column white matter tissue for maximizing motor function after SCI.
Introduction
Measures of intrinsic spinal cord (SC) signal abnormality on T2-weighted (T2w) MRI correlate better with injury severity and outcome after acute spinal cord injury (SCI) than measures of cord compression1,2. However, current MR evaluation of intrinsic cord signal abnormality relies on gross morphologic imaging measures such as T2-hyperintense lesion length and subjective patterns of T2 signal abnormality3. Recent advances in SC analysis have led to the development of a robust anatomic atlas incorporated into an open-source platform referred to as the Spinal Cord Toolbox (SCT)4. In the current study, we register T2w images and manually segmented lesions from acute SCI patients to the spinal cord (SC) anatomical template in order to calculate volumes of damaged tissue in 22 probabilistic anatomical subdomains. Using a cross-validated elastic net regression model we identify key SC anatomic subdomains, which are associated with initial motor scores acutely after injury and with chronic motor impairment.Methods
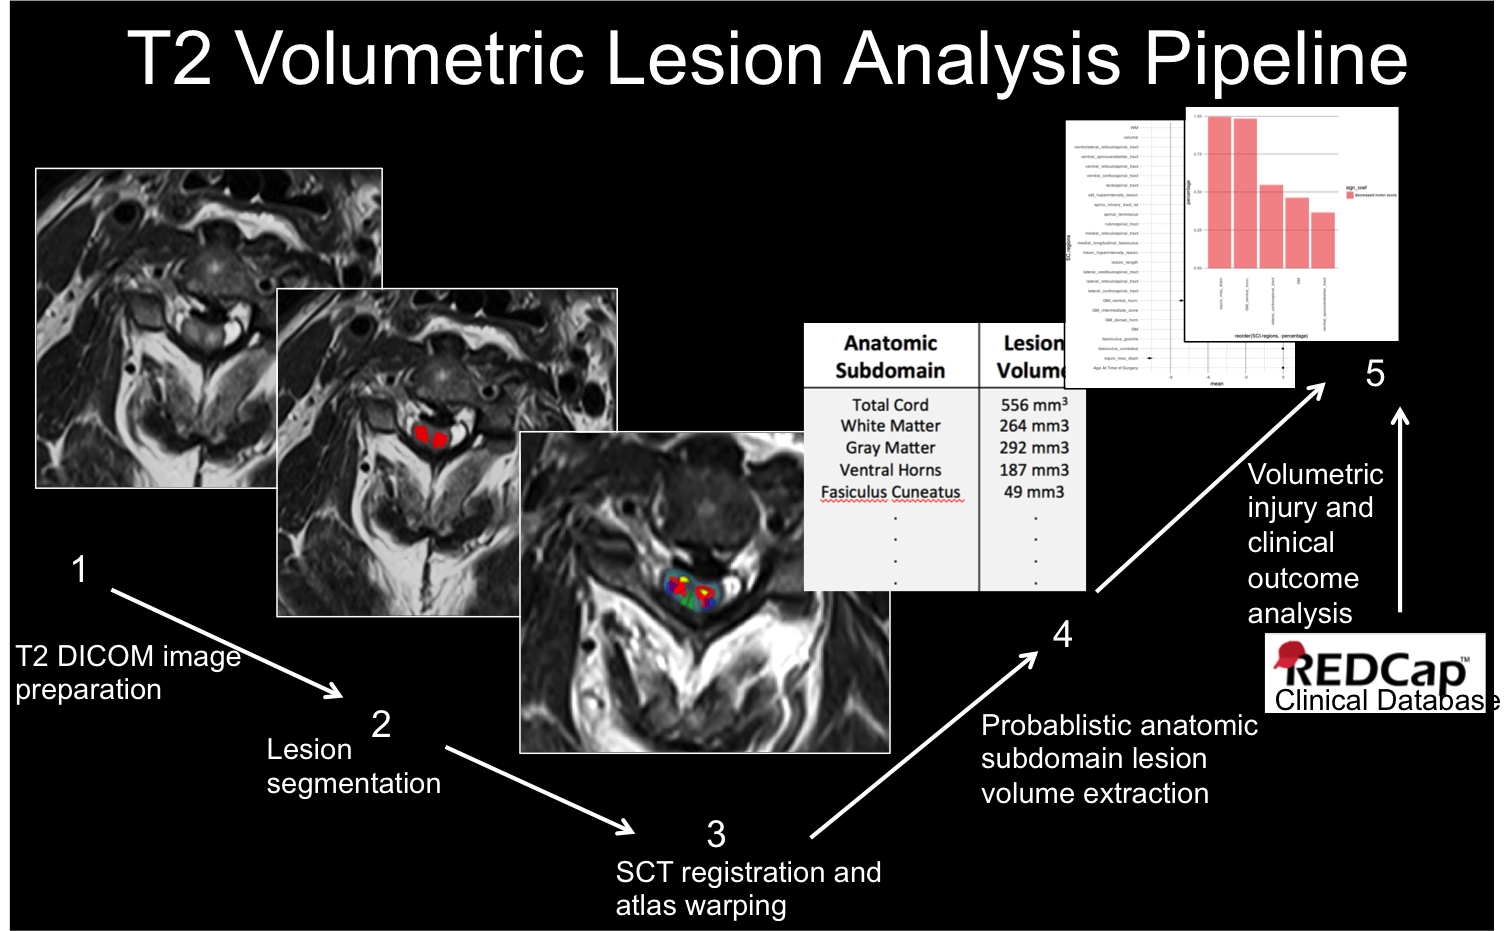
This IRB-approved prospective cohort study involved image analysis of 50 blunt SCI patients enrolled in the TRACK-SCI clinical research protocol. Axial T2w MRI data obtained within 24 hours of injury (TR=3800ms, TE =102ms, section thickness=3.3-4.4mm) were processed using the SCT4. See Figure 1 for analysis pipeline. Briefly, (i) SC was automatically segmented using Propseg5 and manually corrected by a neuro-radiologist, (ii) the PAM50 template6 was then registered to the T2w data, (iii) the template white matter (WM) and gray matter (GM) maps were used to identify 22 anatomical subdomains in the subject space, and (iv) a lesion mask was manually created and used to calculate the probabilistic volume of lesion in each anatomic subdomain using the analyze lesion function in the SCT. Lesion volume data were used as predictor variables in a resampled linear elastic net regression (GLMnet), which was trained on 80% of the data to predict initial motor scores at admission and motor scores at 6-12-month follow-up. Hyper-parameters of the model were calculated using 10-fold cross-validation (CV) to identify the best combination of L1 and L2 parameters that reduce the root mean squared error (RMSE) of the training set. The left-out 20% were used to test the model and mean square error (MSE) was calculated for the test set. Mean error (ME) is reported as square-root of MSE. To ensure stable parameter estimates from the elastic-net model, data were resampled 500 times by CV. At each iteration of the CV, the data were randomly split into a training and test set and an elastic-net model was fit. The counts for each predictor, predictor coefficients, and MSE of the model to predict motor scores on the left-out test set were collected at each iteration. Top SC anatomic subdomains according to elastic-net modeling were tested using standard multivariate regression modeling to identify statistically significant associations.Results
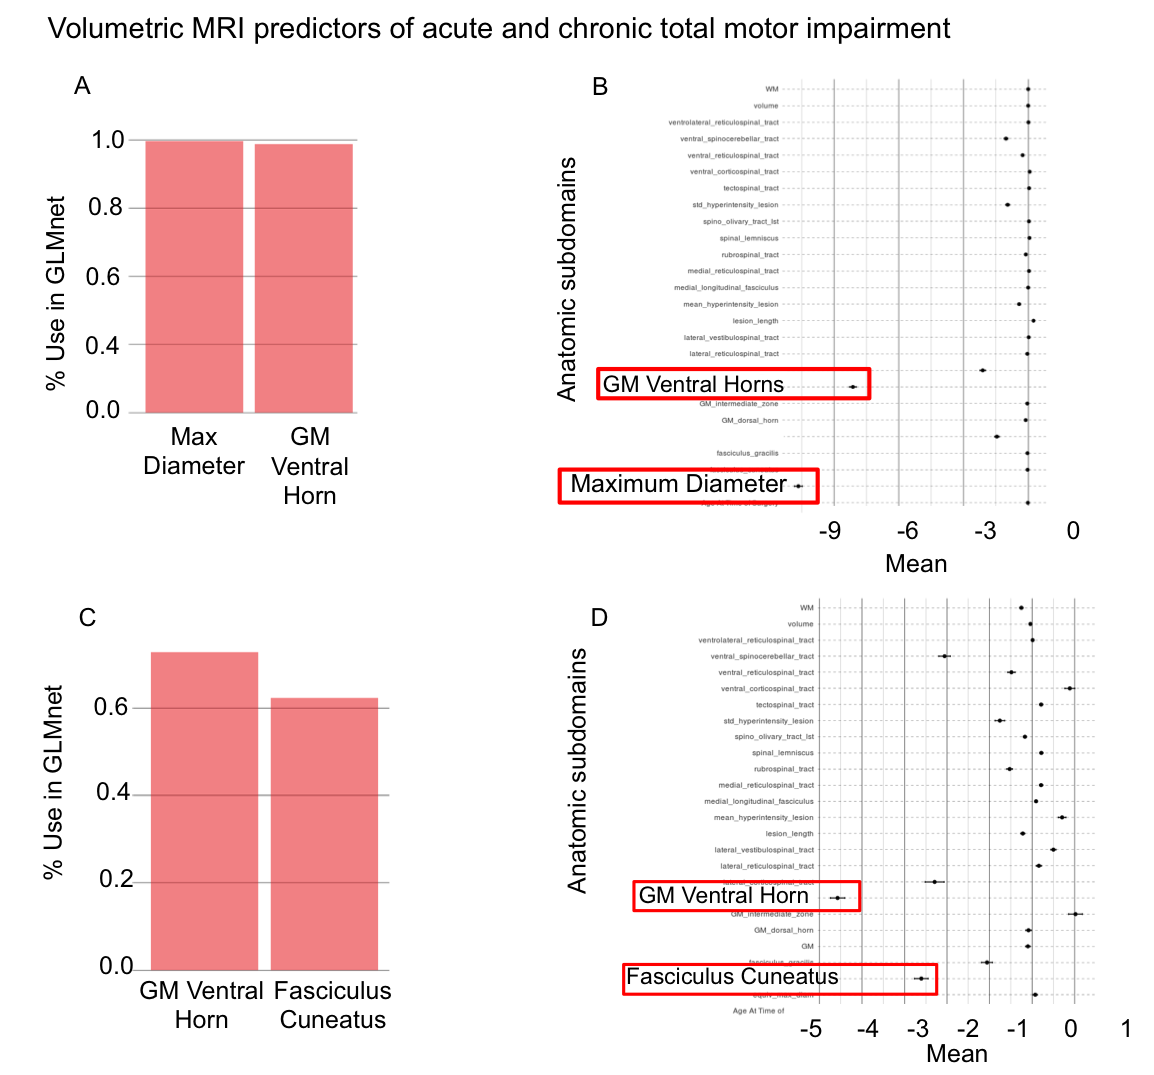
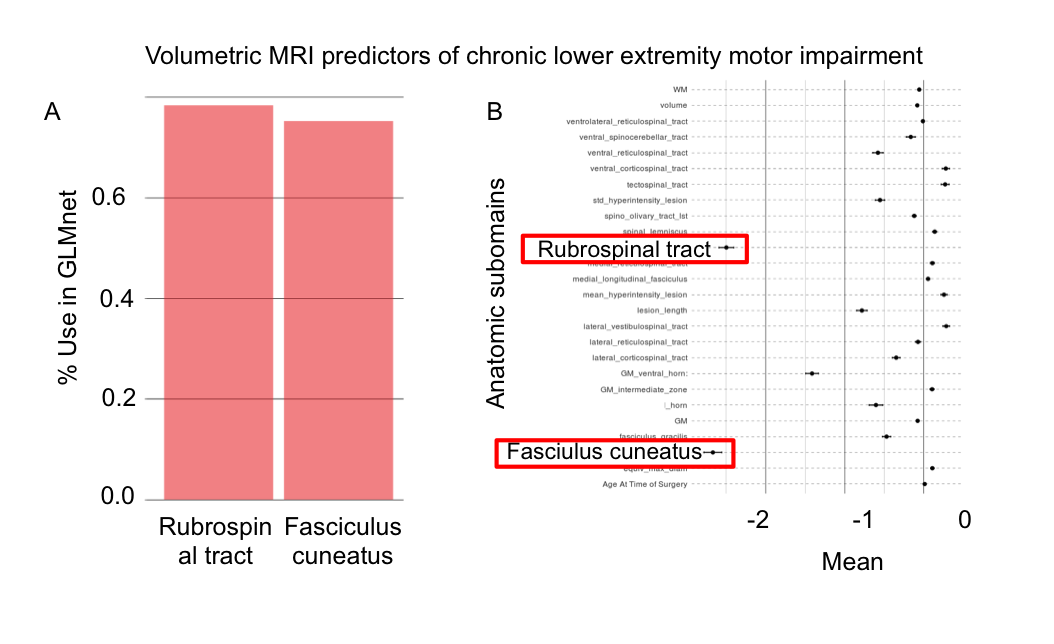
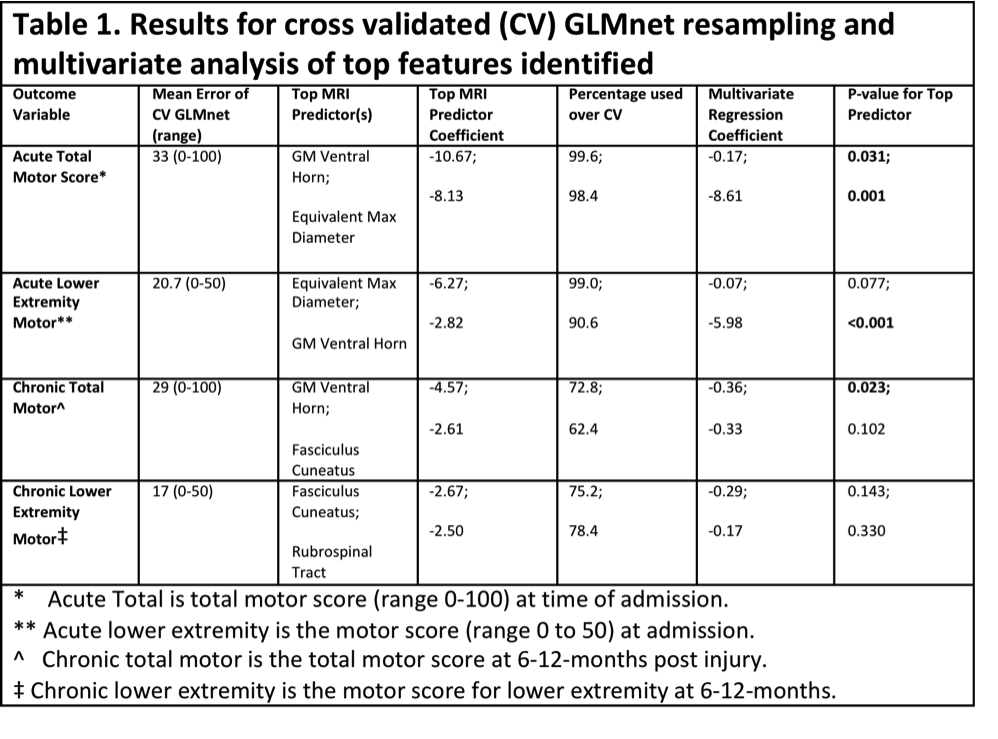
All results are summarized in Table 1. With GLMnet, volumetric MRI measures of lesion more accurately predict chronic total motor scores (ME=29, range 0-100) than acute (ME of 32.6, range 0-100). Similarly, for lower extremity motor function, MRI measures are more accurate for chronic (ME=17, range 0-50) than acute (ME=20, range 0-50). Figures 2 and 3 show the frequency of volumetric subdomain being used in modeling initial and chronic motor scores respectively over the CV resampling. Ventral horn lesion volume was identified as a top predictor of acute and chronic total motor scores while rubrospinal tract and fasiculus cuneatus were top predictors of lower extremity motor score in the chronic time point. Multivariate regression showed statistically significant association between ventral motor horn lesion volume with acute and chronic total motor scores (p=0.031 and p=0.023 respectively). See Table 1 for summary statistics.Discussion
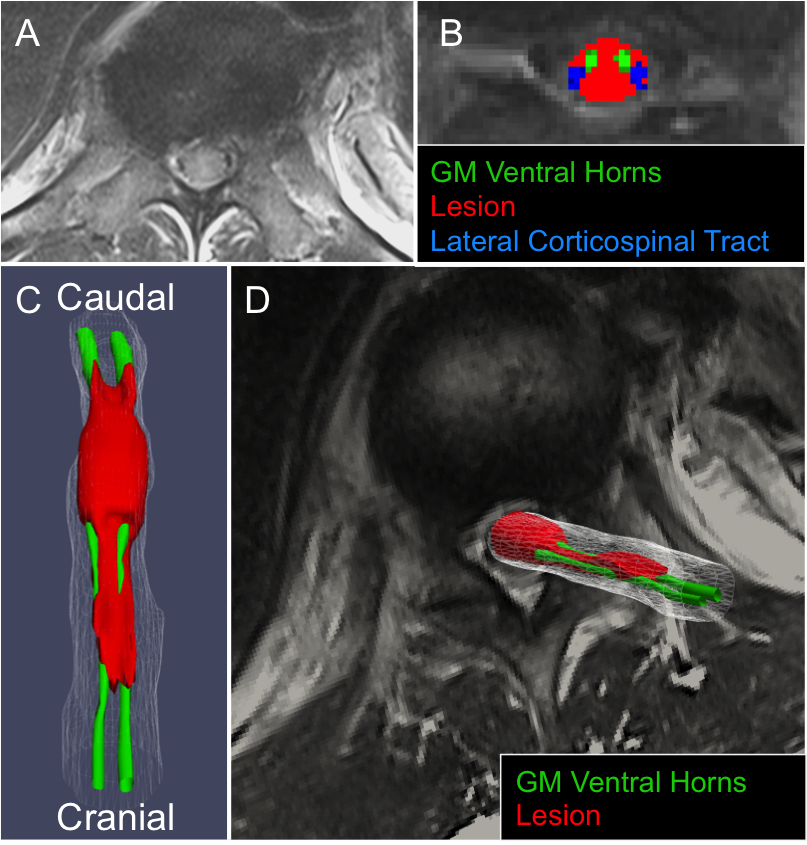
Atlas-based volumetric assessment of T2-abnormality in the spinal cord from MRI performed acutely after injury identifies the ventral horns as an anatomic subdomain within the spinal cord that is highly predictive of both acute and chronic motor impairment. Specifically, the volume of injured ventral horn GM tissue on T2w MRI is significantly and independently associated with motor impairment at acute and chronic time-points after injury. The presence of motor neuron pools within the ventral horns intuitively supports these quantitative results. Compared with total motor score, white matter volumetric measures more accurately predict lower extremity motor scores with the rubrospinal tract as the highest predictor of lower extremity motor impairment. The analysis methods employed identify specific anatomic subdomains for MRI based prognosis of SCI and more indirectly support neuro-protective strategies targeting ventral horn and lateral column white matter tissue for maximizing motor function after SCI. Larger scale, multi-institutional studies are needed to validate these pilot study findings.Acknowledgements
This work was supported by R01NS067092 (ARF), R01NS088475 (ARF), the Craig H. Neilsen Foundation (ARF; JCB), Wings for Life Foundation (ARF), DOD grant SC120259 (MSB; JCB).References
1. Haefeli J, Mabray MC, Whetstone WD, et al. Multivariate Analysis of MRI Biomarkers for Predicting Neurologic Impairment in Cervical Spinal Cord Injury. AJNR American journal of neuroradiology 2017;38:648-55.
2. Talbott JF, Whetstone WD, Readdy WJ, et al. The Brain and Spinal Injury Center score: a novel, simple, and reproducible method for assessing the severity of acute cervical spinal cord injury with axial T2-weighted MRI findings. Journal of neurosurgery Spine 2015;23:495-504.
3. Bozzo A, Marcoux J, Radhakrishna M, Pelletier J, Goulet B. The role of magnetic resonance imaging in the management of acute spinal cord injury. Journal of neurotrauma 2011;28:1401-11.
4. De Leener B, Levy S, Dupont SM, et al. SCT: Spinal Cord Toolbox, an open-source software for processing spinal cord MRI data. NeuroImage 2017;145:24-43.
5. De Leener B, Kadoury S, Cohen-Adad J. Robust, accurate and fast automatic segmentation of the spinal cord. NeuroImage 2014;98:528-36.
6. De Leener B, Fonov VS, Collins DL, Callot V, Stikov N, Cohen-Adad J. PAM50: Unbiased multimodal template of the brainstem and spinal cord aligned with the ICBM152 space. NeuroImage 2017;165:170-9.
Figures