3788
Aberrant Brain Iron Deposition in Gray Matter Nuclei and Hippocampus in Alzheimer Disease with Type 2 Diabetes Mellitus: A Quantitative Susceptibility Mapping Study1The First Affiliated Hospital of Dalian Medical University, Dalian, China
Synopsis
In this study, brain iron contents in basal nuclei, thalamus and hippocampus of AD+T2DM patients and AD-T2DM patients was quantified with susceptibility values by QSM, and further to explore the correlation between brain iron deposition and cognition level and clinical factors. From the study results, we conclude that the susceptibility values were generally decreased due to aberrant iron deposition in gray matter nuclei in AD+T2DM patients relative to AD-T2DM patients. The susceptibility values of right GP has a better correlation with cognition, which administers to monitor the development of cognitive impairment.
Introduction
The previous studies shows excessive brain iron deposition associated with cognitive impairment occurs in Alzheimer Disease(AD)[1,2]. Type 2 diabetes mellitus(T2DM) might be a risk factor for cognitive impairment progressing into AD. For AD patients, it is unclear whether hyperglycemia aggravates brain iron deposition or not? In this study, brain iron contents in basal nuclei, thalamus and hippocampus of AD was quantified with susceptibility values by QSM, and further to explore the correlation between brain iron deposition and cognition level and clinical factors.Methods
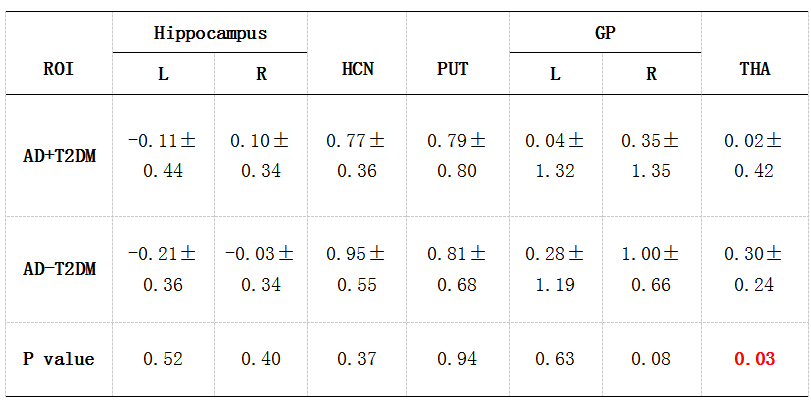
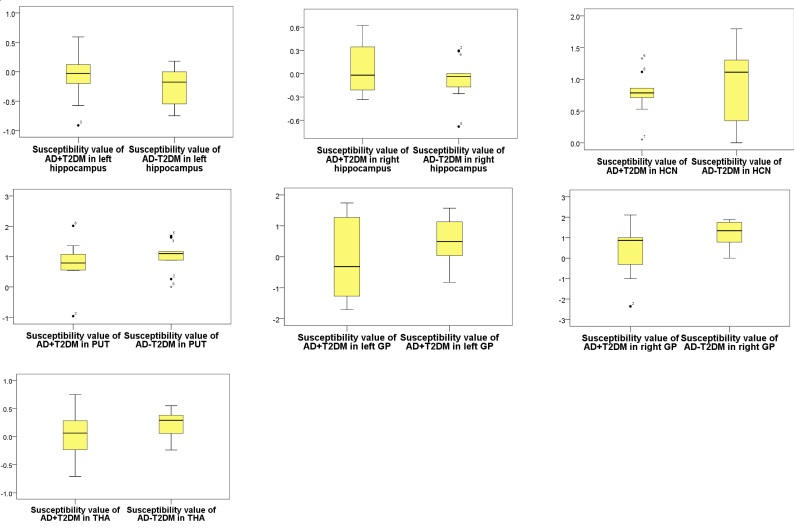
Nine AD patients with Type 2 diabetes mellitus (AD+T2DM) and twenty-one AD patients without Type 2 diabetes mellitus (AD-T2DM) were recruited to undergo MRI scan including QSM. Bilateral susceptibility values in head of caudate nucleus(HCN), putamen(PUT), globus pallidus(GP), thalamus(THA) and hippocampus were manually measured three times with GE ADW4.6 workstation, and the mean value of measurement three times was used to calculate. All the subjects were evaluated with MMSE and MoCA by two neurologists before MRI scan and the clinical factors including fasting glucose, blood pressure, triglyceride, cholesterol, age, disease course and homocysteine were recorded. Because of normal distribution of data, paired sample t-test was performed to compare the lateral difference of susceptibility values of all subjects, independent sample t-test was used to compare the difference of susceptibility values between AD+T2DM and AD-T2DM groups. The correlation between MMSE, MoCA, scores and each clinical factors and susceptibility value were analyzed by partial correlation analysis.Results and Discussion
For all AD patients, the susceptibility values were lower in left side than that in right side in hippocampus(P=0.03) and GP(P=0.02), there was no significant lateral difference in the other regions.
Previous studies have found that QSM conduces to iron quantitation in brain nuclei[3]. Compared with AD-T2DM patients, the susceptibility values of AD+T2DM patients were generally decreased in gray matter nuclei, especially in THA(P=0.03), reflecting increased iron deposition, which may be suggest that it is related to microvascular lesions and increased blood brain barrier permeability induced by T2DM[4].
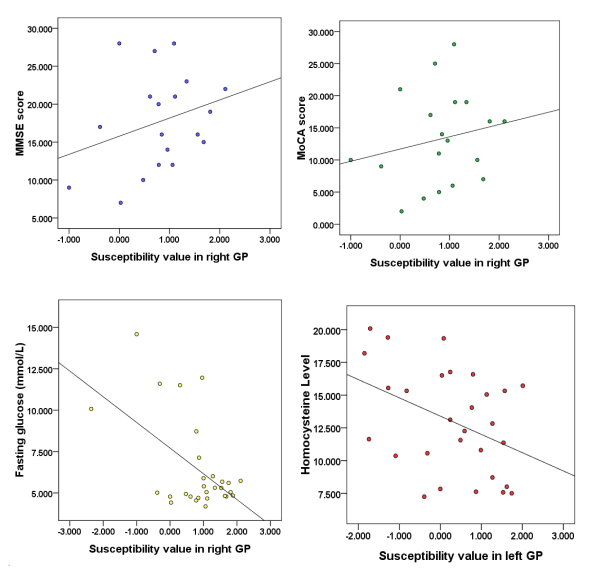
A positive correlation between susceptibility values and MMSE, MoCA scores of all AD patients was found in right GP(rMMSE=0.682, P=0.04; rMoCA=0.724, P=0.03), which helps to monitor the cognitive impairment. In addition, a negative correlation between fasting glucose and susceptibility values in right GP was also present (r=-0.49, P=0.02). Moreover, homocysteine was negatively correlated with susceptibility values in left GP(r=-0.48, P=0.03). It can be concluded that fasting glucose and homocysteine are the influencing factors of brain iron deposition.
Conclusion
From the present study, we conclude that the susceptibility values were generally decreased due to aberrant iron deposition in gray matter nuclei in AD+T2DM patients relative to AD-T2DM patients. The susceptibility values of right GP has a better correlation with cognition, which administers to monitor the development of cognitive impairment.Acknowledgements
No acknowledgement found.References
[1].Kim HG, Park S, Rhee HY, et al. Quantitative susceptibility mapping to evaluate the early stage of Alzheimer's disease. Neuroimage Clin, 2017, 16:429-438.
[2].Moon Y, Han SH, Moon WJ. Patterns of Brain Iron Accumulation in Vascular Dementia and Alzheimer's Dementia Using Quantitative Susceptibility Mapping Imaging. J Alzheimers Dis, 2016, 51(3):737-45.
[3].Liu C, Li W, Tong KA, et al. Susceptibility-Weighted Imaging and Quantitative Susceptibility Mapping in the Brain. J Magn Reson Imaging, 2015, 42(1): 23–41.
[4].Lee JY, Lee YJ, Park DW, et al. Quantitative susceptibility mapping of the motor cortex: a comparison of susceptibility among patients with amyotrophic lateral sclerosis, cerebrovascular disease, and healthy controls. Neuroradiology, 2017.
Figures