3782
Associations between tissue sodium concentration, age and cross-sectional area in the healthy spinal cord1Queen Square MS Centre, UCL Institute of Neurology, Faculty of Brain Sciences, University College London, London, United Kingdom, 2Translational Imaging Group, Centre for Medical Image Computing (CMIC), Department of Medical Physics and Bioengineering, University College London, London, United Kingdom, 3Department of Brain and Behavioural Sciences, University of Pavia, Pavia, Italy, 4Brain MRI 3T Research Centre, C. Mondino National Neurological Institute, Pavia, Italy
Synopsis
Tissue sodium concentration has recently come into the spotlight for a number of neurological conditions, given its potential role in neurodegeneration and due to the advances in MRI technology. This has led to many studies in the brain, but there is a shortage of studies characterising sodium in the spinal cord. Here we use 23Na-MRS to measure sodium in the healthy spinal cord and look at the association between tissue sodium concentrations with age and spinal cord cross sectional area.
Introduction
Sodium channels have recently undergone intense scrutiny in neuropathology, due to their potential role in axonal conduction, and therefore energy failure and axonal degeneration. 23Na-MRI has been used successfully to study neurological conditions including Multiple Sclerosis (MS) and Alzheimer’s disease1,2. However, evidence of similar applications of 23Na-MRI in the spinal cord (SC) are lacking due to the small size of the structure and the intrinsically low SNR. Here we overcome these challenges to report on sodium concentrations in the SC of a healthy control cohort, together with measures of age and cross-sectional area (CSA), and find whether: a) inter-subject variations in cervical SC sodium in a healthy population are related to age; b) a correlation between spinal cord CSA and sodium exists, given the known effect of age on spinal cord atrophy, and c) if sodium concentration in the cervical SC can be predicted based on age and CSA.Methods
Subjects: Twenty-four healthy control subjects (age range 23-68y) were recruited. All participants gave informed written consent.
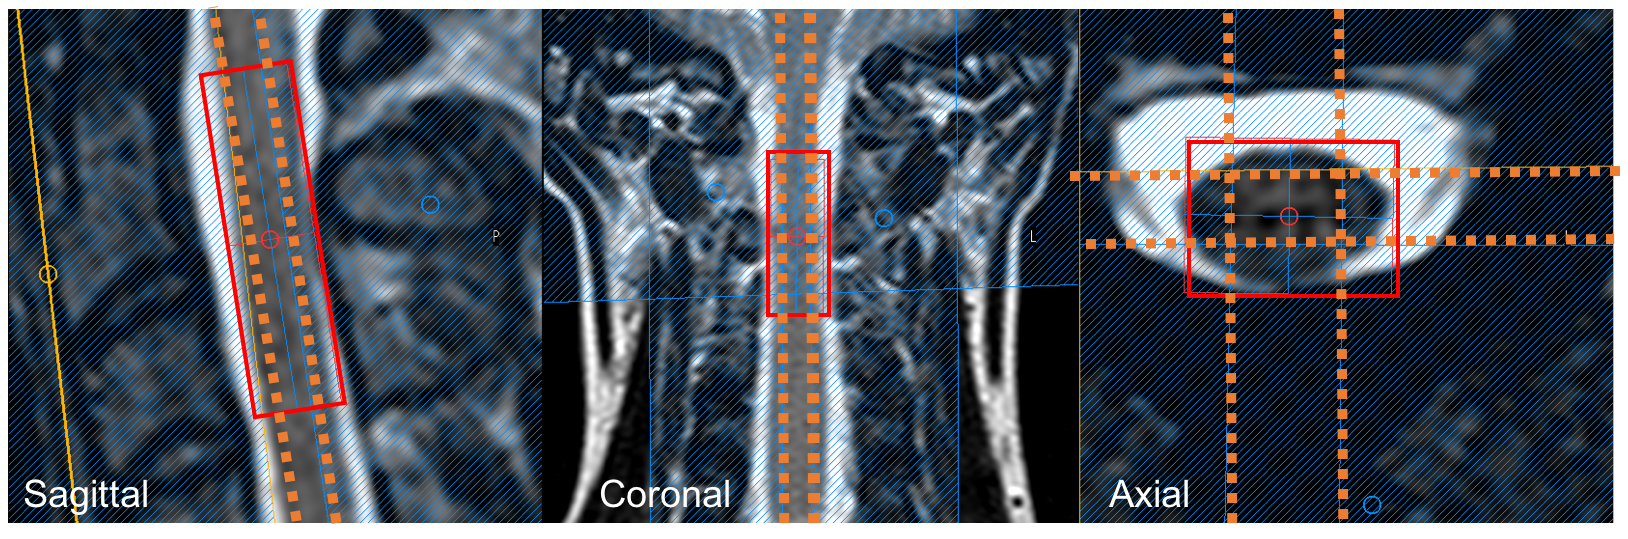
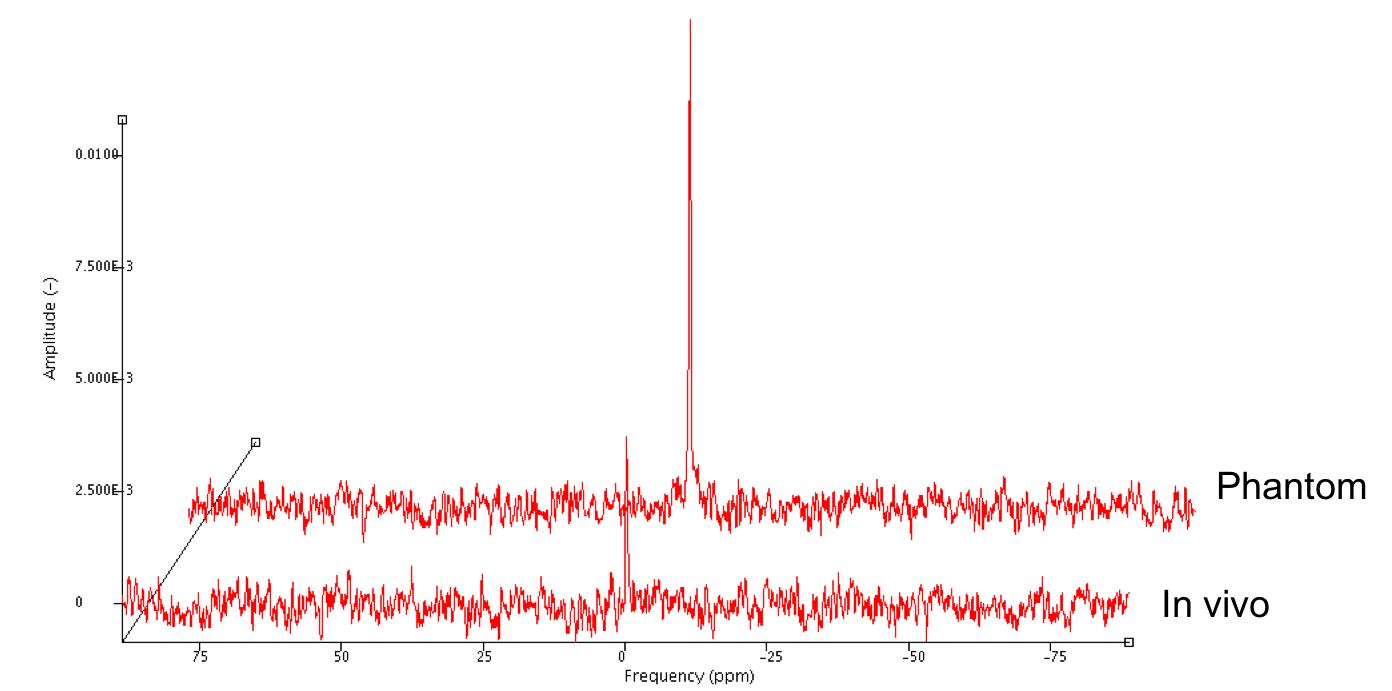
23Na-MRS: All MRI scans were acquired on a 3T Achieva TX system (Philips Healthcare, Best). Sodium data were acquired using fixed-tuned transmit-receive sodium head coil (Rapid, Germany). Using the Q-body coil, 1H images were first acquired in the sagittal and coronal planes for MRS planning. Using ISIS, a voxel (9x12x35mm3) centered at the level of the C2-3 intervertebral disc was planned to measure sodium concentration, TR=300ms, effective TE=0.26ms, nex=800 (Figure 1). Saturation pulses were placed to extend over the edges of the voxel to suppress signal from cerebrospinal fluid (CSF) and the effects of any protruding intervertebral disc3. An example sodium spectrum is shown in Figure 2.
23Na Quantification: Immediately following the 23Na-MRS, volunteers were removed from the scanner and replaced with an external concentration reference phantom containing 44.8mM 23Na, on which an identical scan was performed. Data were processed with jMRUI, using first and second order phasing, apodisation=20Hz, and zerofilling=2048. Signal amplitudes for volunteers and phantom were measured using the AMARES algorithm. Differences in the performance of the ISIS sequence due to differing T1s’ and T2s’ between phantom and tissue were also accounted for, using values from healthy brain tissue. The ratio of the two corrected signals was used to quantify the sodium concentration for each volunteer4,5.
1H-MRI: A high-resolution 1H 3D-gradient echo scan, covering the same area as the MRS voxel, was acquired using a 16-channel neurovascular coil for measurement of CSA. Ten contiguous axial images were acquired, with FOV=240x180mm2, TR=23ms, TE=5ms, flip angle α=7°, nex=8 and 0.5x0.5x5mm3 resolution.
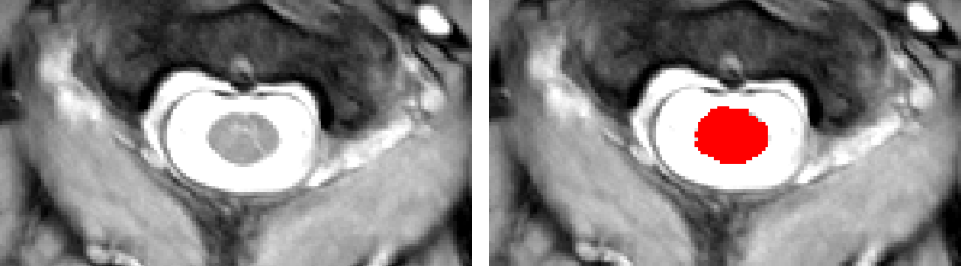
Measurement of CSA: CSA was computed for each volunteer using an automatic segmentation method6 that provided a mask for each slice (Figure 3). These masks were then used to find the average CSA of the five slices covering the 23Na-MRS voxel.
Analysis: Correlations between sodium and age and sodium and CSA were investigated using the Pearson correlation coefficient. In addition, multiple regression analysis was run to examine whether sodium concentration in the cervical SC could be predicted based on CSA and age.
Results
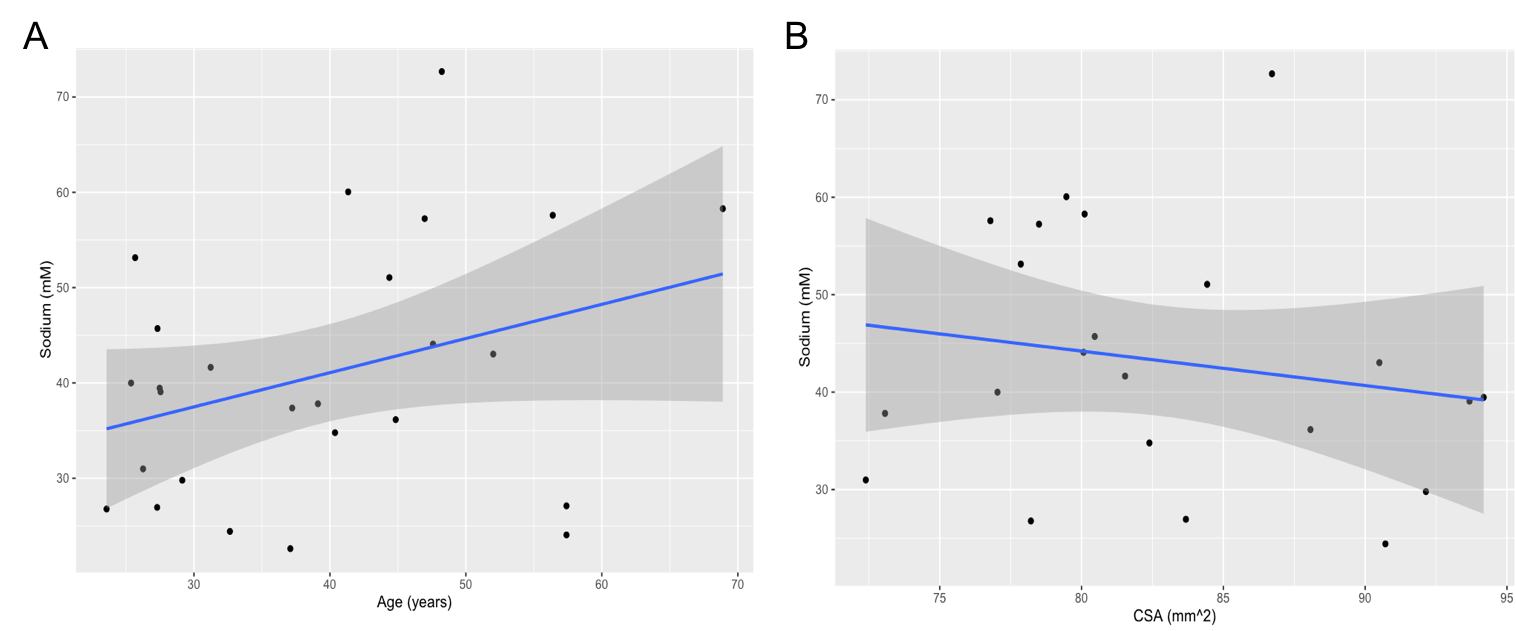
Figure 4a and 4b show the distribution of sodium with age and CSA. Mean(±SD) total sodium was 40.8±13mM, age 39±12years, and CSA was 83±6mm2. As can be seen in figure 4a and b the correlation between sodium and age, or sodium and CSA appeared weak with Pearson coefficients of 0.34 (p>0.05) and -0.18 (p>0.05) respectively. However, using multiple regression analysis, it was found that age and CSA statistically significantly predicted cervical SC sodium concentration, F(2, 95) = 5.916, p = 0.01, R2 = 0.384. Using this model a significant relationship between sodium and age was uncovered, p =0.004.Discussion
Our findings show that age related changes add statistically significantly to the prediction of spinal cord sodium concentration (p=0.004). Whilst the mean sodium concentration in the SC is higher than expected when compared to brain white matter values using a 3D-cones imaging technique (40.8±13mM versus 31.4±2.3mM), it is similar to cortical grey matter (41.8±3.2mM) and deep grey matter (34.4±2.5mM), and considering its standard deviation it is not dissimilar to brain concentrations7. The higher standard deviation is probably due to age as well as differing amounts of white and grey matter and varying extracellular volume fractions, which would contribute to a higher sodium concentration.Conclusion
Structurally related changes have a lower impact on sodium concentration in the cord than age. This knowledge will inform future studies looking to use this technique to measure sodium in the SC for neurological conditions such as MS and spinal cord injury.Acknowledgements
Wings for Life and the MS SocietyReferences
1) Paling D, Solanky BS, Riemer F, Tozer DJ, Wheeler-Kingshott C A, Kapoor R, Golay X, Miller DH, Sodium accumulation is associated with disability and a progressive course in multiple sclerosis. Brain, 2013 Jul, 136(Pt7), 2305-17
2) Mellon EA, Pilkington DT, Clark CM, Elliott MA, Witschey WR 2nd, Borthakur A, Reddy R, Sodium MR Imaging Detection of Mild Alzheimer Disease: Preliminary Study, Am J Neuroradiol. (2009) , 30(5), 978-984
3) Solanky BS, Reimer F, Golay X, Wheeler-Kingshott CA, Sodium quantification in the spinal cord at 3T. Magn Reson Med. 2013 May, 69(5) 1201-8
4) Riemer F, Solanky BS, Clemence M, Wheeler-Kingshott CAM, Golay X, Bi-Exponential 23Na T2* Components Analysis in the Human Brain ,Proc. 20th ISMRM, 2012, 2322
5) Solanky BS, Reimer F, Wheeler-Kingshott CA, Golay X, Evaluation of Cerebrospinal Fluid Suppression Techniques in Sodium MRI at 3T, Proc. 20th ISMRM, 2012, 1702
6) Prados F, Cardoso MJ, Yiannakas M, Hoy L, Tebaldi E, Kearney H, Liechti MD, Miller DH, Ciccarelli O, Gandini Wheeler-Kingshott CAM, Ourselin S , Fully automated grey and white matter spinal cord segmentation, Scientific Reports, 2016
7) Cawley N, Solanky BS, Prados F, Collorone S, Kanber B, Ourseli, S, Wheeler-Kingshott CAMG, Miller DH, Thompson AJ, Toosy A, Ciccarelli O, Increased total sodium concentration in asymptomatic T2 lesions in clinically isolated syndrome, Presented at: 32nd Congress ECTRIMS, London, 2016, P505
Figures