3780
In-vivo Quantitative Structural Imaging of the Superior Colliculus at 9.4T1Biomedical Magnetic Resonance, University Hospital Tübingen, Tübingen, Germany, 2High Field Magnetic Resonance, Max Planck Institute for Biological Cybernetics, Tübingen, Germany, 3Division of Neuropsychology, Centre for Neurology, Hertie-Institute for Clinical Brain Research, Tübingen, Germany, 4Department of General Psychiatry and Psychotherapy, University Hospital Tübingen, Tübingen, Germany
Synopsis
We investigated the possibility to observe the anatomical details of the superior colliculus (SC), a layered structure located on the tectum of the midbrain, by in vivo MRI at 9.4T. Through image analysis in native space, several brain structures of the mid brain could be identified. The signal variation of all imaging modalities (T1, R2* and QSM) along and across the superior colliculus consistently highlighted the deep white layer VII, adjacent to the periaqueductal grey; the myelinated fibres in the superficial optic layer (layer III) and an iron-rich layer attributed to the intermediate grey layer (IV).
Introduction
The superior colliculus (SC) is located in the tectum of the midbrain and is composed of a regular pattern of alternating myelinated fibers and neuronal cell bodies of different size and shape that can be subdivided into 7 layers [1-2], with distinct functions related to the visual, sensory, auditory and motor domains. Alterations within the SC have been reported to occur in several diseases, like Alzheimer's disease, progressive supranuclear palsy, amyotrophic lateral sclerosis, and cervical dystonia as well as in patients with Parkinson's disease with visual and oculomotor impairment.
Recent advancements in MRI at high magnetic field strengths enable detection of brain microstructure linked with the underlying cyto and myeloarchitecture. In the present study we used quantitative MRI at 9.4T to identify and delineate several structures in the midbrain and explored the possibility to detect single SC layers in vivo.
Subjects&Methods
Fourteen healthy volunteers (age range 21-34 years; 3 females) volunteered to participate in this ERB approved study and were scanned at 9.4T using a 16ch Tx/31ch Rx array [3]. Static field homogeneity and transmit field (measured the Actual Flip Angle method [4] using a nominal flip angle of 60°; TR1/TR2=20/100ms; TE=7ms, voxel size=3x3x5mm³; TA=3min45s) were optimized on a slice covering the midbrain.
Whole brain T1 relaxometry was made with MP2RAGE (TI1/TI2: 900/3500ms; flip angle: 4/6°; TR: 6 ms; volume TR: 9s; TE: 2.3ms; 0.8mm isotropic voxels; GRAPPA: 3; partial Fourier factor, PF: 6/8; TA: 9min40s [5]. R2* relaxometry was made with 3D FLASH multi-echo and mono-polar gradients with FA: 15°; TR: 41ms; TE: 6-30 ms in steps of 6 ms, 0.4mm isotropic voxel size, GRAPPA: 2; PF: 6/8; TA: 13min34 s. QSM maps were generated from an acquisition weighted sequence (AW) [6] with FA: 8, TR: 24 ms, TE: 16.5 ms, voxel size: 0.132x0.132x0.6 mm³; TA = 14 min 45 s. For each subject between-modality coregistration and normalization to MNI space was performed in SPM12 [7].
Results and Discussion
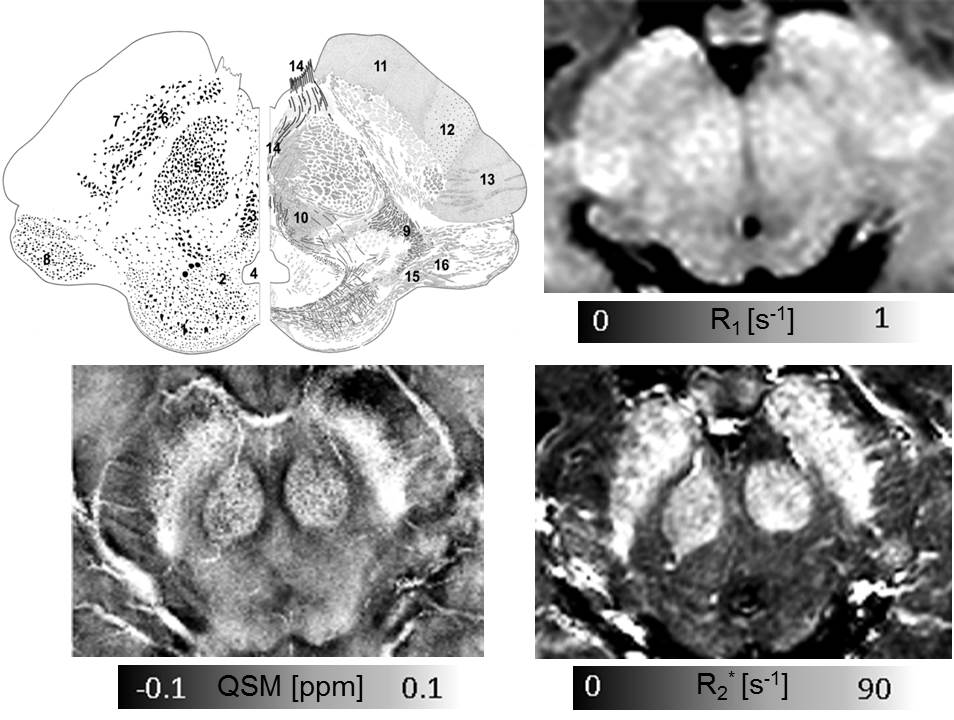
Several structures could be identified by virtue of their previously described cyto- and myeloarchitecture [8]. These structures are shown in Fig. 1 with dominant cytoarchitectonic features in SC (1); Periaqueductal gray (PAG) (2); oculomotor nucleus (3); CA (4); parvocellular (5) and magnocellular (18) portion of RN; pars compacta (6) and pars reticulata (7) of the SN; medial geniculate body (8); and with dominant myeloarchitectural features in the medial lemniscus (9); central tegmental tract (10); frontopontine tract (11); pyramidal tract (12); parietotemporopontine tract (13); oculomotor nerve (14); brachium of the SC (15); commissure of the SC (16); brachium of the inferior colliculus (17).
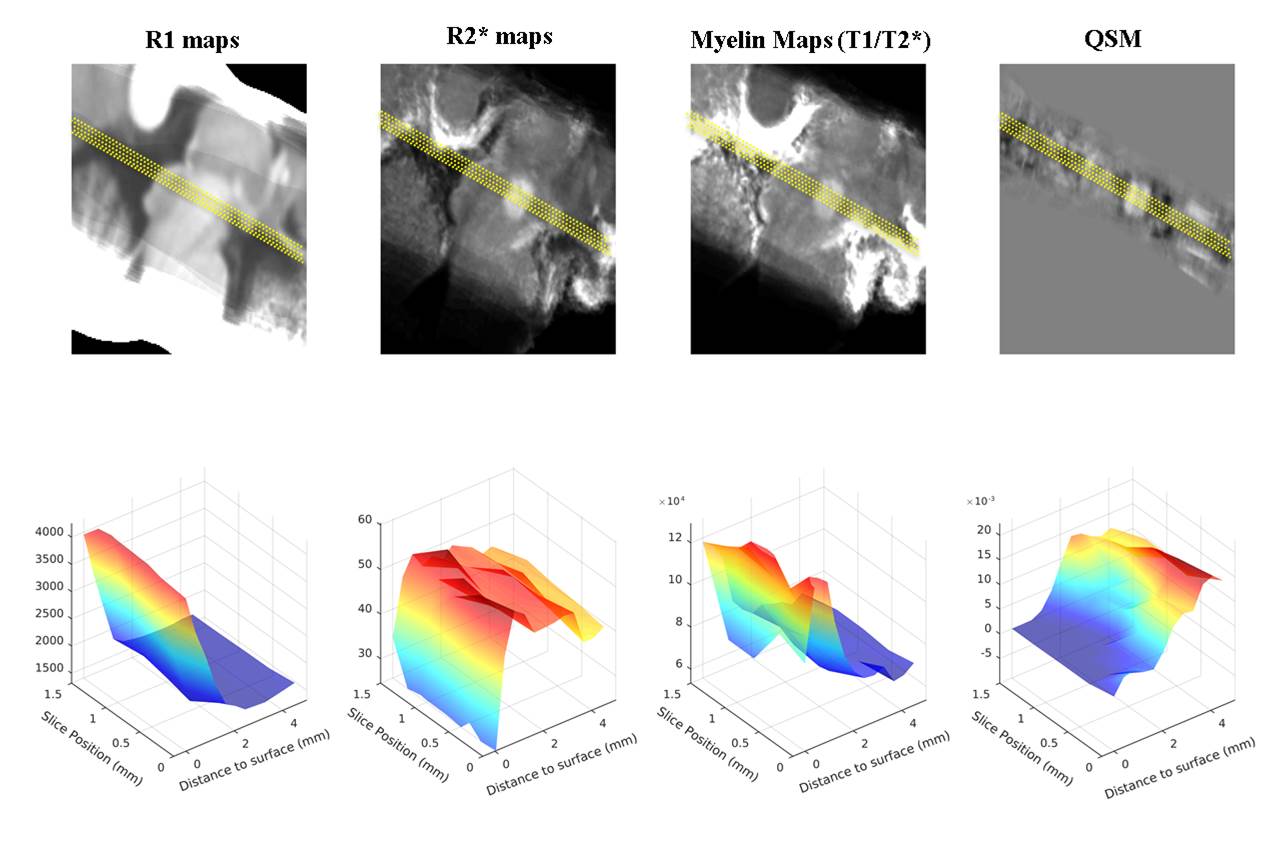
Depth profiles along and across the superior colliculus (Fig 2) facilitated the identification of features in the MRI images that could be assigned to previous described subdivision of SC into layers [1-2]. In general, the R1 maps were hyperintense in areas characterized by the presence of abundant myelinated fibers, and likely enabled detection of the deep white layer VII adjacent to the periaqueductal gray. While R1 maps failed to reveal finer details, possibly due to the relatively coarse spatial sampling used for this modality, these could be recovered in R2* maps and in QSM. In the central part of the SC along its rostro-caudal axis, increased R2* values and decreased susceptibility values were observed 2mm below the SC surface, likely reflecting the myelinated fibers in the superficial optic layer (layer III). Towards the deeper layers, a second increase in R2* was paralleled by a paramagnetic shift in QSM suggesting the presence of an iron-rich layer about 3mm below the surface of the SC, attributed to the intermediate gray layer (IV) composed of multipolar neurons. These results are concordant with observations in histological specimens and animal studies of the superior colliculus [8-11] and suggest that high-resolution multi-modal MRI at 9.4T can reveal several microstructural features of the SC in vivo.
Conclusion
Our results are in agreement with previous observations in histological specimens and animal studies and suggest that high-resolution multi-modal MRI at 9.4T can reveal several microstructural features of the superior colliculus in vivo.Acknowledgements
The study was funded by the Max Planck Society, the ministry of Science, Research and the Arts of Baden-Württemberg; and by the Carl Zeiss FoundationReferences
[1] Kanaseki T, Sprague J, J. Comp. Neurol. 1974; 158, 319-337 [2] Ma TP et al., J. Comp. Neurol 1990; 295, 92-110. [3] Shajan G., et al., Magn Reson Med; 2013; 71(2):870-9 [4] Yarnykh VL. Magn Reson Med 2007; 57(1):192-200. [5] Hagberg GE et al., NeuroImage 2017; 144:203-216. [6] Budde J., et al., NeuroImage 2014; 86:592-598. [7] http://www.fil.ion.ucl.ac.uk/spm/software/spm12/. [8] Nieuwenhuys R et al., The human central nervous system: a synopsis and atlas. Springer, 2008 [9] May PJ, Progr. Brain Res. 2006; 151:321-378. [10] Naidich T. Duvernoy’s Atlas of the Human Brain Stem and Cerebellum. Am Soc Neuroradiology, 2009. [11] Tardif E et al., Exp. Brain Research 2005; 166:316-324.Figures