3778
Assessment of white matter de-differentiation in mild cognitive impairment using tract covariance matrix derived from diffusion spectrum imaging1Institute of Medical Device and Imaging, National Taiwan University, Taipei, Taiwan, 2Department of Psychology, National Taiwan University, Taipei, Taiwan, 3Molecular Imaging Center, National Taiwan University, Taipei, Taiwan
Synopsis
In this study, we compared the degree of white matter de-differentiation between the patients with mild cognitive impairment (MCI) and normal-aging population using diffusion spectrum imaging (DSI) and whole brain tract-based automatic analysis (TBAA). The degree of de-differentiation, defined as the global level of generalized fractional anisotropy (GFA) covariance between each white matter tract, was found to be significantly higher in the MCI group, as revealed by two-sample T test of partial correlation matrices of the two subject groups. Further analysis showed that covariance was higher among projection tracts.
Introduction:
MCI is deemed an intermediate state of cognitive function between normal aging-related changes and dementia, usually Alzheimer’s disease1,2. The cognitive decline seen in MCI is especially prominent in memory. Although it does not cause significant disability 1, it has received considerable attention in clinical practice3. Moreover, a previous study using tract covariance matrix suggested that the aging population presents a higher degree of white matter de-differentiation than the young population4. In the present study, we tested the hypothesis that white matter de-differentiation is different between MCI patients and normal-aging population. The analysis was conducted using TBAA-transformed DSI data obtained from MCI and normal-aging subjects.Methods:
Subjects: Two groups of participants were recruited in this study: 24 healthy older adults (age: 71.3 ± 5.37 years, 12 males and 12 females), 28 MCI group (age: 72.8 ± 6.89 years, 15 males and 13 females). The severity of white matter hyperintensity was assessed using the Fazekas scale. Imaging: All participants received T1-weighted imaging and DSI on a 3T Siemens Tim Trio MRI System (Siemens Medical, Erlangen, Germany) with 32-channel head coil in National Taiwan University Hospital. The parameters were as follow: T1-weighted: three-dimensional magnetization-prepared rapid gradient-echo (MPRAGE) sequence, TR/TE = 2000/3 ms, FOV = 256 x 192 x 208 mm^3, flip angle = 9°, resolution = 1 x 1 x 1 mm^3; DSI: echo planer imaging (EPI) sequence, 102 diffusion encoding gradients with bmax = 4000 s/mm^2, TR/TE = 9600/130 ms, matrix size = 80 x 80, FOV = 200 x 200 mm^2, resolution = 2.5mm. Image Quality Assurance (QA): Only images with signal-to-noise ratio (SNR) higher than 20 and WM-GFA correlation coefficient higher than 0.5 were included for subsequent analysis. Analysis: We used whole brain TBAA to obtain a 2D connectogram for each DSI dataset5. The connectogram provides generalized fractional anisotropy (GFA) profiles of 76 white matter tract bundles. We averaged the GFA values of each tract profile to obtain mean GFA for each tract. Tract covariance was defined as the partial correlation of GFA values across subjects between each pair of tracts, using age, sex, and Fazekas scale as confounders. The covariance matrices were Fisher z-transformed, and the bottom half of the matrices were divided into six parts based on the classification of interactions between fiber systems (i.e. projection fibers, association fibers, commissure fibers; Figure 1). The partial correlation coefficients of the two groups were then compared both globally and in each part using two-sample T test.Results:
Compared to the control group, the z-transformed partial correlation coefficients of white matter tracts were significantly higher in the MCI group (p < 0.01; Figure 2). Furthermore, the higher partial correlation coefficients tend to aggregate in the projection-projection (PP) part of the covariance matrix, as indicated by a lower p value of the PP-part in comparison with the AA-, CA- and CC-parts. This result indicates that the microstructural properties of projection tracts are highly-correlated compared to other types of tracts in the MCI group (Figure 3).
Discussion:
The present study demonstrates a higher degree of white matter de-differentiation, particularly among the projection fibers, in the MCI group than healthy controls. A possible explanation for white matter de-differentiation proposed in an earlier study is that some “systemic, detrimental effect” renders the tract-specific variations less prominent 4. Our results suggest that white matter de-differentiation might play a role in the cognitive decline observed in MCI patients. The functional significance of higher de-differentiation among projection fibers remains to be investigated.Conclusion:
Compared to the normal-aging group, the tract de-differentiation, particularly among the projection fibers, was significantly more prominent in the MCI group.Acknowledgements
No acknowledgement found.References
1. Petersen, Ronald C. "Mild cognitive impairment." New England Journal of Medicine 364.23 (2011): 2227-2234.
2. Medina, David, et al. "White matter changes in mild cognitive impairment and AD: A diffusion tensor imaging study." Neurobiology of aging 27.5 (2006): 663-672.
3. Petersen, Ronald C., et al. "Mild cognitive impairment: ten years later." Archives of neurology 66.12 (2009): 1447-1455.
4. Cox, Simon R., et al. "Ageing and brain white matter structure in 3,513 UK Biobank participants." Nature communications 7 (2016): 13629.
5. Chen, Yu‐Jen, et al. "Automatic whole brain tract‐based analysis using predefined tracts in a diffusion spectrum imaging template and an accurate registration strategy." Human brain mapping 36.9 (2015): 3441-3458.
Figures
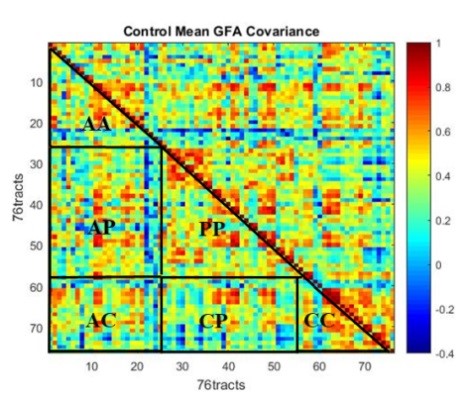
Figure 1: The six parts of the covariance matrix. AA (Association fiber-Association fiber), AP (Association fiber-Projection fiber), PP (Projection fiber-Projection fiber), AC (Association fiber-Commissure fiber), CP (Commissure fiber- Projection fiber), CC (Commissure fiber- Commissure fiber).
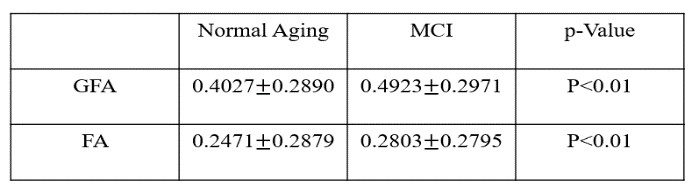
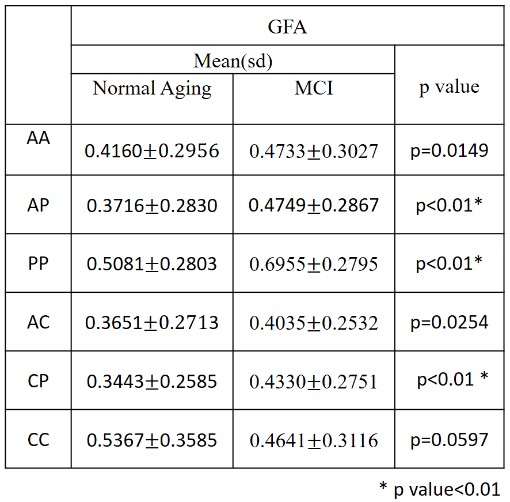
Figure 3: The z-transformed partial correlation coefficients of the AP, PP and CP parts were significantly different between the two groups compared to the AA, CA and CC parts.