3777
Increased Deposition of Iron in Deep Cerebral Gray Matter Structures in Hemodialysis Patients: A Longitudinal, Susceptibility-Weighted Image Mapping Study1Radiology Department, Tianjin First Central Hospital, Tianjin, China, 2The first Central Hospital Affiliated to Nankai University, Tianjin, China, 3The MRI Institute for Biomedical Research, Waterloo, ON, Canada, 4Department of Hemodialysis, Tianjin First Central Hospital, Tianjin, China, 5MR Collaboration NE Asia, Siemens Healthcare, beijing, China, 6Department of Radiology, Wayne State University, Detroit, MI, United States
Synopsis
The aim of this study was to explore the changes in abnormal iron deposition in hemodialysis patients by longitudinal follow-up MR exam with susceptibility-weighted image mapping (SWIM). SWIM was reconstructed from the magnitude and phase data of SWI to quantify the susceptibility of deep gray matter nuclei in patients with a baseline examination and follow-up examination, and in healthy controls. The results suggest that iron deposition in the gray matter nuclei in patients increased over time, and this process may be a risk factor for neurocognitive dysfunction. The independent risk factors for abnormal iron deposition included the follow-up interval, creatinine, and abnormal calcium-phosphorus metabolism.
Purpose
Excessive iron can lead to lipid peroxidation and neurotoxicity, the weakening of neuronal function, and damage to neural connectivity1. Abnormal iron deposition is implicated in some neurodegenerative diseases including Alzheimer’s disease and Parkinson’s disease2, and it is also correlated with neurocognitive impairment3. Therefore, the measurement of iron deposition may be a new biomarker for the monitoring of the presence and progression of neurodegenerative diseases and neurocognitive impairment. The purpose of this study was to explore changes in iron deposition in hemodialysis patients and the correlation with neurocognitive function and clinical risk factors by longitudinal follow-up MR exam with susceptibility-weighted image mapping (SWIM).Methods
A total of 34 patients and 30 age-, gender-, and education-matched healthy controls (HCs) participated in this study. The mean follow-up interval of patients was 21.8±6.96 months. MRI data were collected on a MAGNETOM Trio Tim System 3T MR scanner (Siemens Healthcare, Erlangen, Germany), including routine head scan and susceptibility-weighted imaging. The parameters of SWI were as follows: TR/TE = 27/20 ms; field of view = 230×200 mm2; voxel resolution = 0.5×0.5×2 mm3; number of slices = 56; flip angle = 15°; receiver bandwidth = 120 Hz/pixel; and acquisition time = 179 s. SWIM was reconstructed using both the phase and magnitude data using SMART (Susceptibility Mapping and Phase Artifacts Removal Toolbox, Detroit, Michigan, USA) software. The susceptibility of bilateral cerebral nuclei (caudate nucleus, globus pallidus, putamen, thalamus, pulvinar of thalamus, substantia nigra, red nucleus, and dentate nucleus) was measured using SPIN (signal processing in nuclear magnetic resonance, Detroit, Michigan, USA) software (Fig. 1). Consecutive slices of the nuclei were drawn, and the identifiable blood vessels in the nuclei were excluded. The clinical laboratory data of the patients was collected, and all patients and HCs underwent neurocognitive testing.
Pearson’s correlation was used to investigate the agreement between the susceptibility of the nuclei of HCs in our study and the iron concentration of these nuclei from postmortem study reported by Hallgren and Sourander4. The differences in the susceptibility of the nuclei and MMSE scores between the patients with the baseline MRI examination, the follow-up examination, and the HCs were calculated using analysis of covariance (ANCOVA). The differences in susceptibility, MMSE scores, and clinical risk factors of the patients between these two examinations were investigated using the paired t-test. The correlation between the susceptibility of the nuclei and the MMSE scores in the baseline and follow-up examinations was investigated using Pearson’s correlation. In addition, Pearson’s correlation and a stepwise multiple regression analysis between the changes of susceptibility in the nuclei, the changes in the MMSE scores, and clinical risk factors were performed.
Results
The comparison of susceptibility in the nuclei between the hemodialysis patients with a baseline MRI examination, patients with a follow-up examination, and the HCs is presented in Fig. 2. In the baseline examination, the MMSE scores were significantly negatively correlated with the susceptibility of LCN, RCN, LPUT, RPUT, and RRN (all P<0.001). In the follow-up examination, the MMSE scores were significantly negatively correlated with the susceptibility of LCN, RCN, LPUT, RPUT, LRN, RRN, LDN, and RDN (all P<0.05) (Fig. 3). The MMSE scores of the patients with the follow-up examination were also significantly lower than those with the baseline examination (P=0.002). The follow-up interval significantly correlated with changes in the susceptibility of the RCN, RPUT, LSN, and RDN (all P<0.01) (Fig. 4). Changes in the serum BUN, creatinine, iron, calcium, and phosphorus were significantly correlated with changes in the susceptibility of the RPT, LPT, RDN, LSN, RPUT, RRN, and LDN (all P<0.05) (Fig. 4). We found that the follow-up interval, creatinine, phosphorus, and calcium were independent risk factors for the increased susceptibility of some nuclei, including RPUT, RDN, LPT, RRN, LSN, and LDN (all P<0.05) (Fig. 5).
Discussion
Compared with the baseline patients and HCs, decreased MMSE scores were observed in the follow-up patients, suggesting that hemodialysis may have caused the neurocognitive impairment. The correlation between the susceptibility of the nuclei and the MMSE scores in the baseline and follow-up examinations indicated that iron deposition may be a risk factor for neurocognitive impairment. However, there was no correlation between increased susceptibility in the nuclei and decreased MMSE scores in the longitudinal study. This may be due to the short follow-up interval and a gradual, even fluctuating process of neurocognitive impairment for the patients, which may be exacerbated by a relatively long dialysis process.
Conclusion
Iron deposition in the gray matter nuclei in hemodialysis patients increased over the longitudinal SWIM study. Such deposition of iron may be a risk factor for neurocognitive impairment. The follow-up interval, creatinine, and abnormal calcium-phosphorus metabolism were independent risk factors for the abnormal iron deposition.
Acknowledgements
We appreciated Linlin Fan for her help in the statistics analysis.References
1. Bilgic B, Pfefferbaum A, Rohlfing T, Sullivan EV, Adalsteinsson E. MRI estimates of brain iron concentration in normal aging using quantitative susceptibility mapping. Neuroimage 2012;59:2625–2635.
2. Thomas M, Jankovic J. Neurodegenerative disease and iron storage in the brain. Curr Opin Neurol 2004;17:437–442.
3. Ghadery C, Pirpamer L, Hofer E, et al. R2* mapping for brain iron: associations with cognition in normal aging. Neurobiol Aging 2015;36:925–932.
4. Hallgren B, Sourander P. The effect of age on the non-haemin iron in the human brain. J Neurochem 1958;3:41–51.
Figures
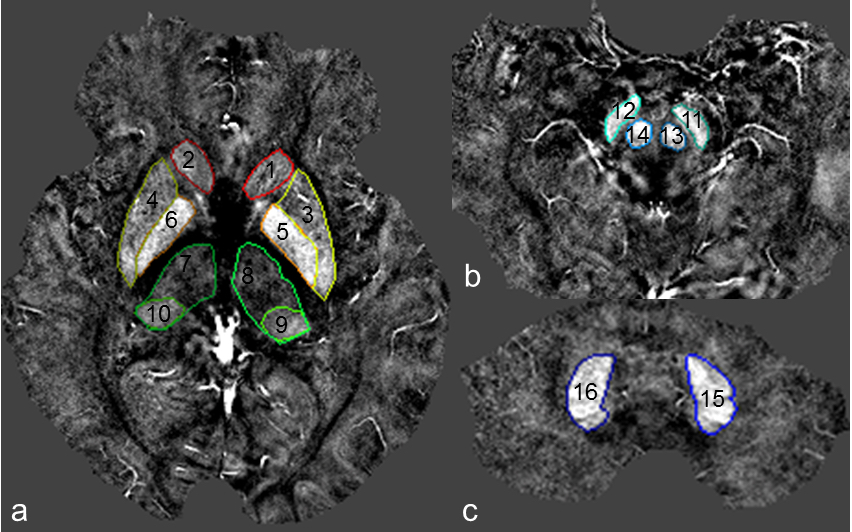
Fig. 1. The volumes of interest of different gray matter nuclei outlined in the susceptibility-weighted image mapping.
a. the level of basal ganglia; b. the level of mid-brain; c. the level of cerebellum. 1 and 2, LCN and RCN (caudate nucleus); 3 and 4, LPUT and RPUT (putamen); 5 and 6, LGP and RGP (globus pallidus); 7 and 8, RTH and LTH (thalamus); 9 and 10, LPT and RPT (pulvinar of thalamus); 11 and 12, LSN and RSN (substantia nigra); 13 and 14, LRN and RRN (red nucleus); 15 and 16, LDN and RDN (dentate nucleus).
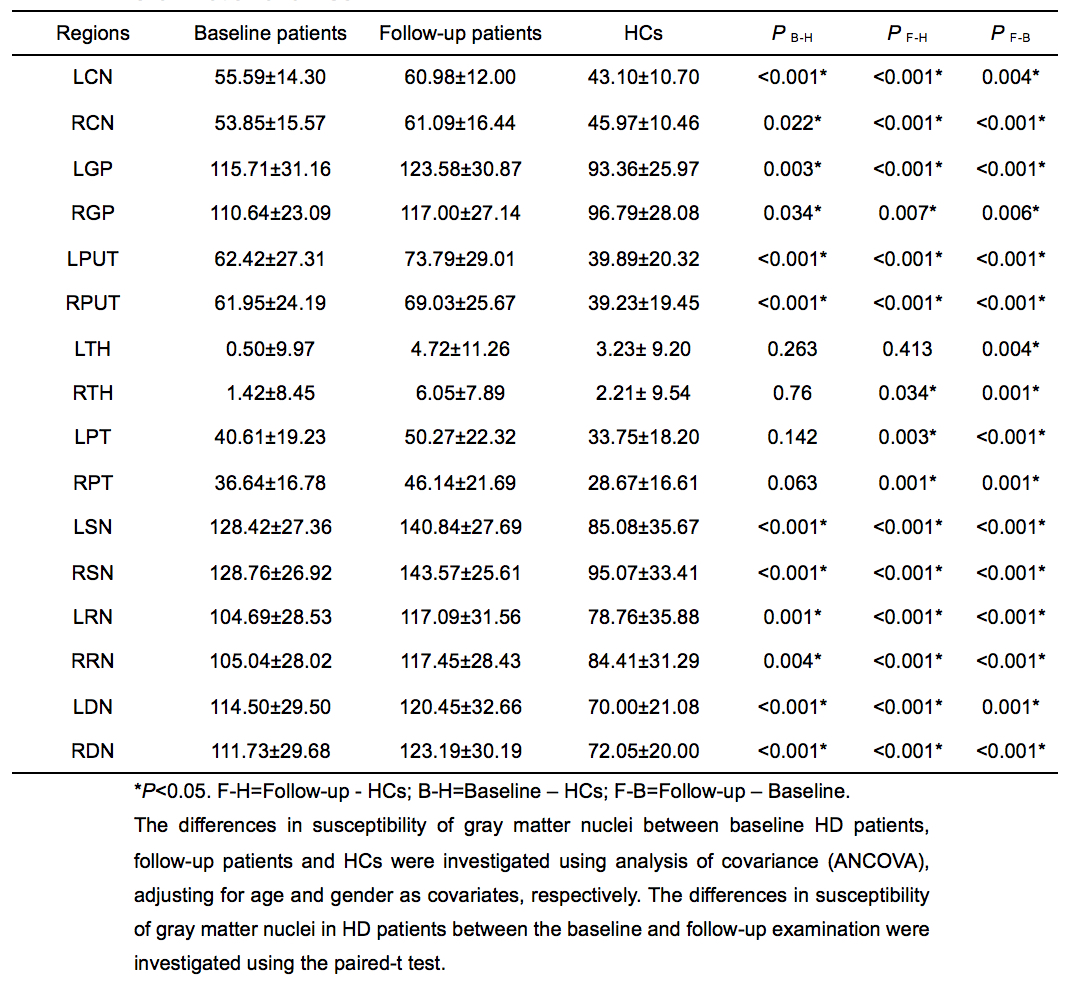
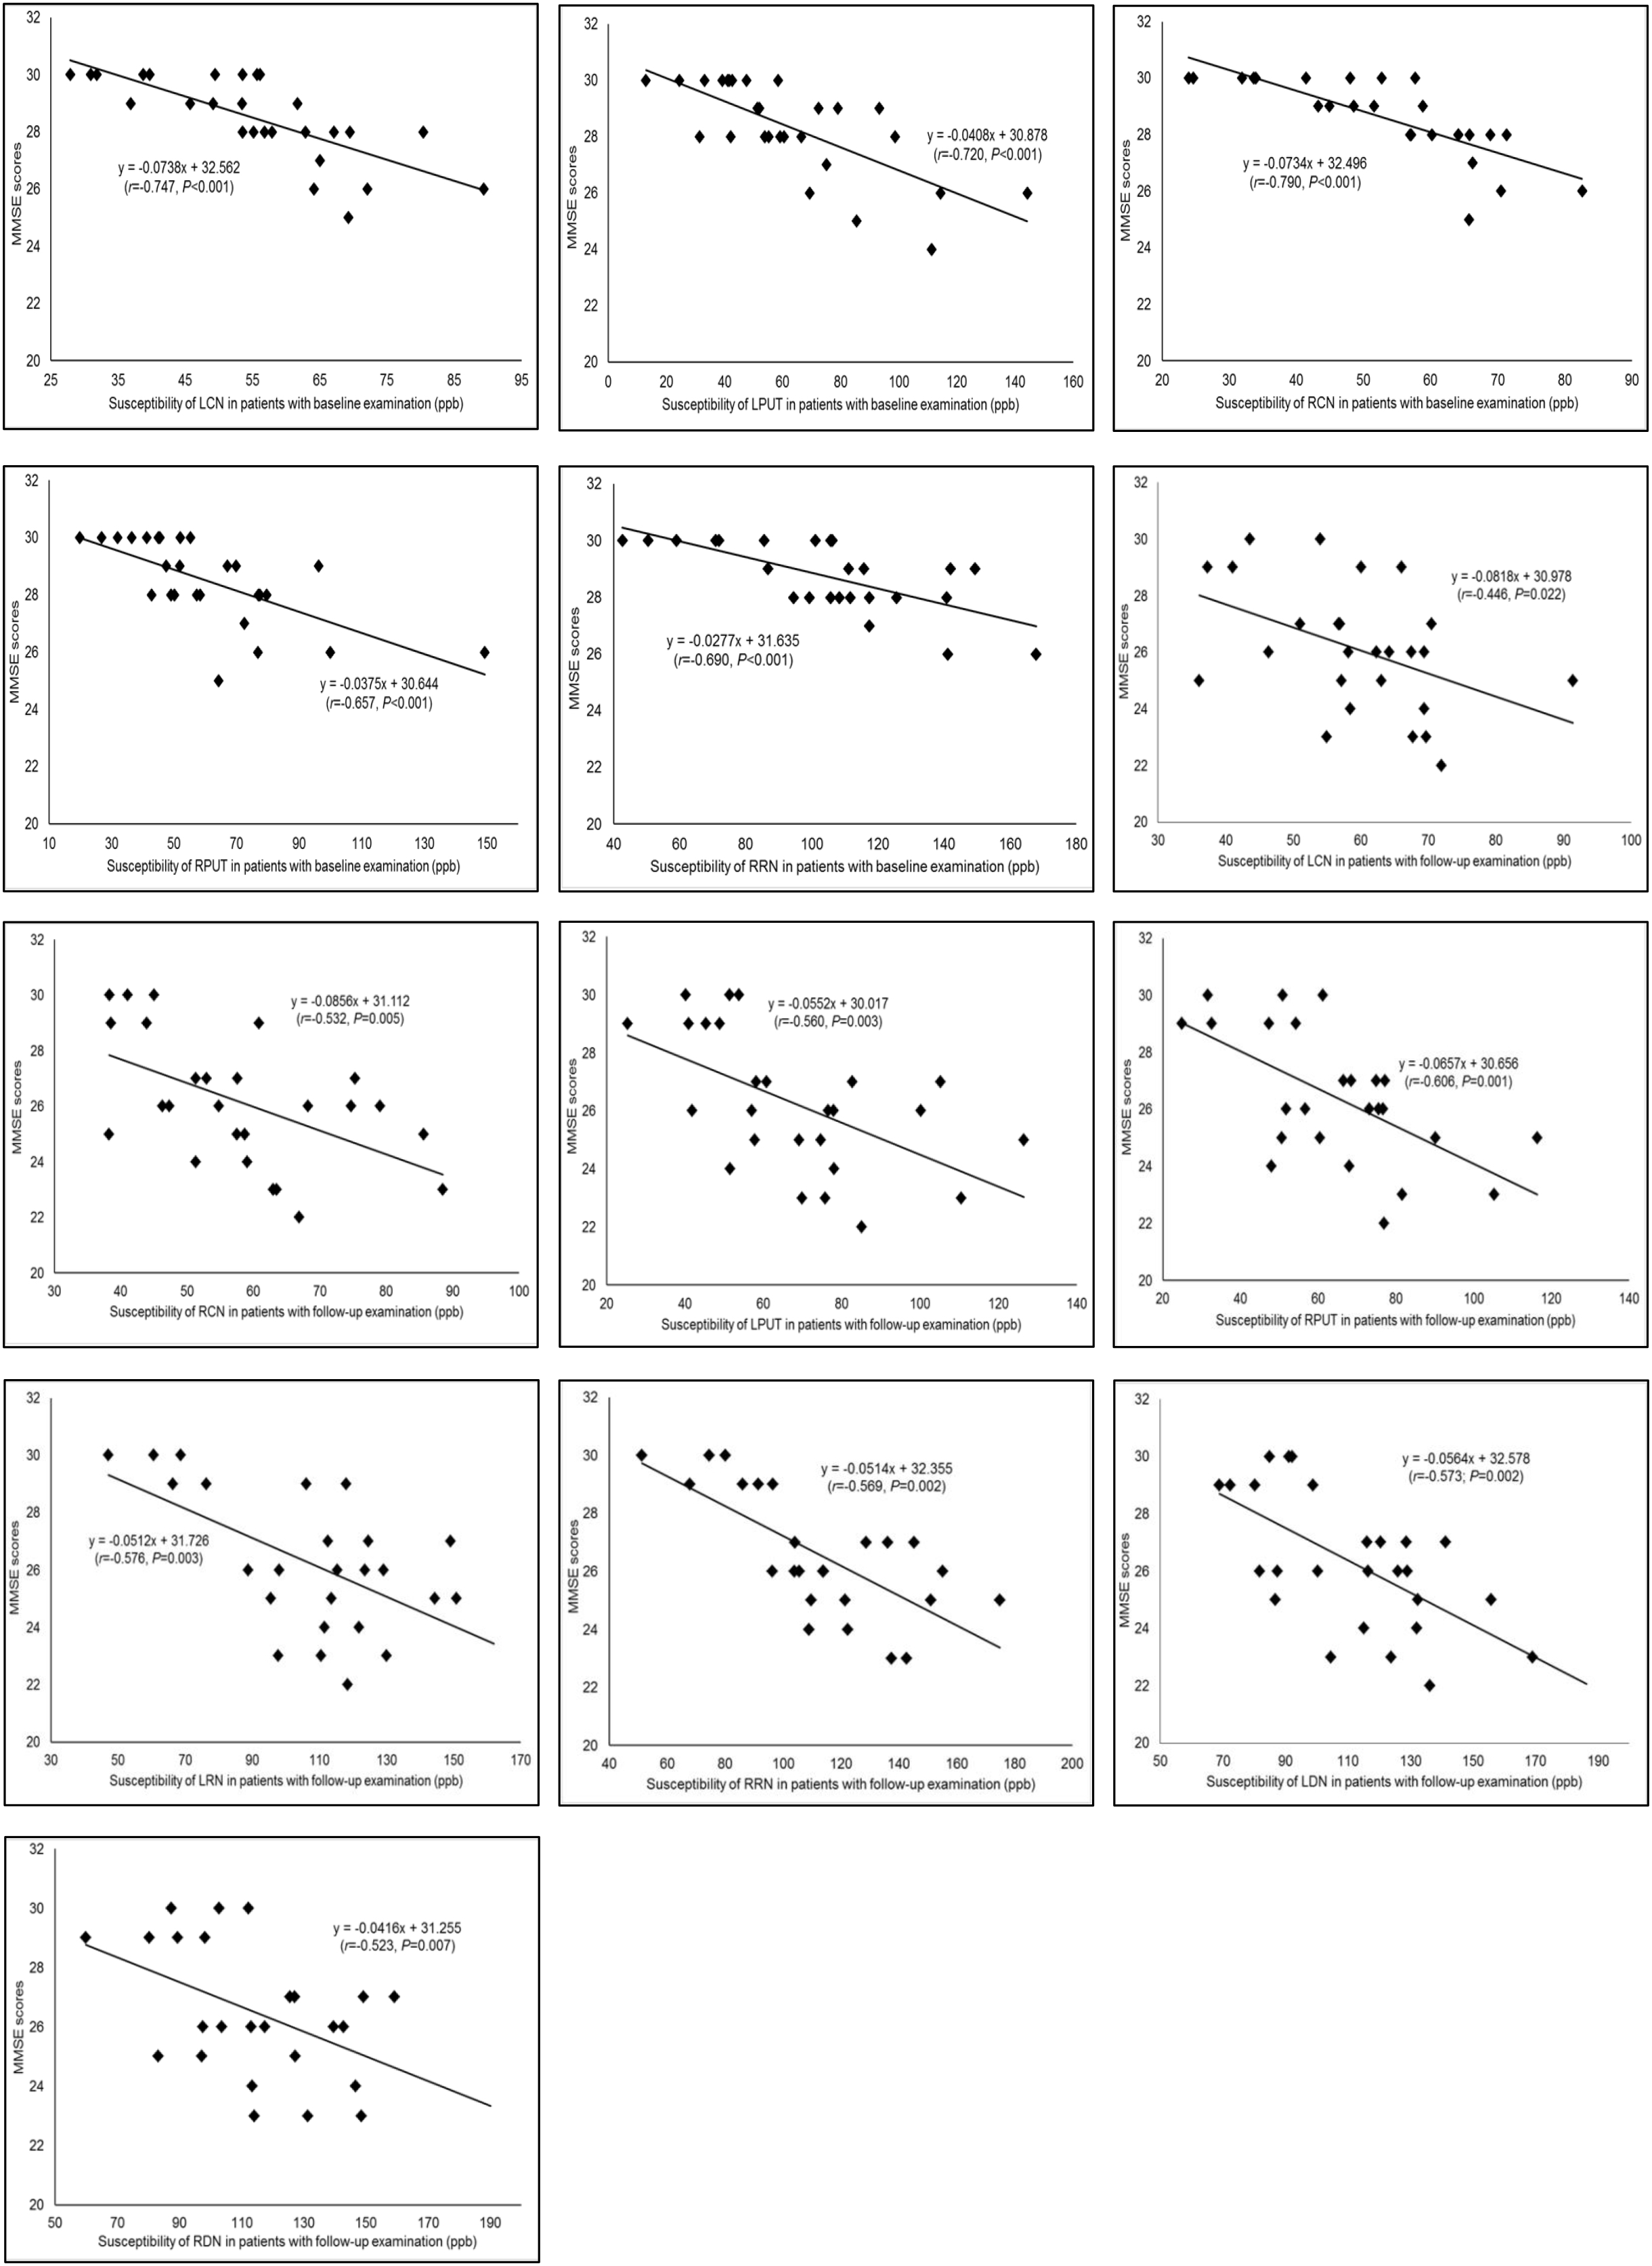
Fig. 3. Correlation between the susceptibility of gray matter nuclei and MMSE scores in hemodialysis patients with the baseline examination and patients with the follow-up examination.
In the baseline examination, the MMSE scores were significantly negatively correlated with the susceptibility of LCN, RCN, LPUT, RPUT, and RRN (all P<0.001). In the follow-up examination, the MMSE scores were significantly negatively correlated with the susceptibility of LCN, RCN, LPUT, RPUT, LRN, RRN, LDN, and RDN (all P<0.05).
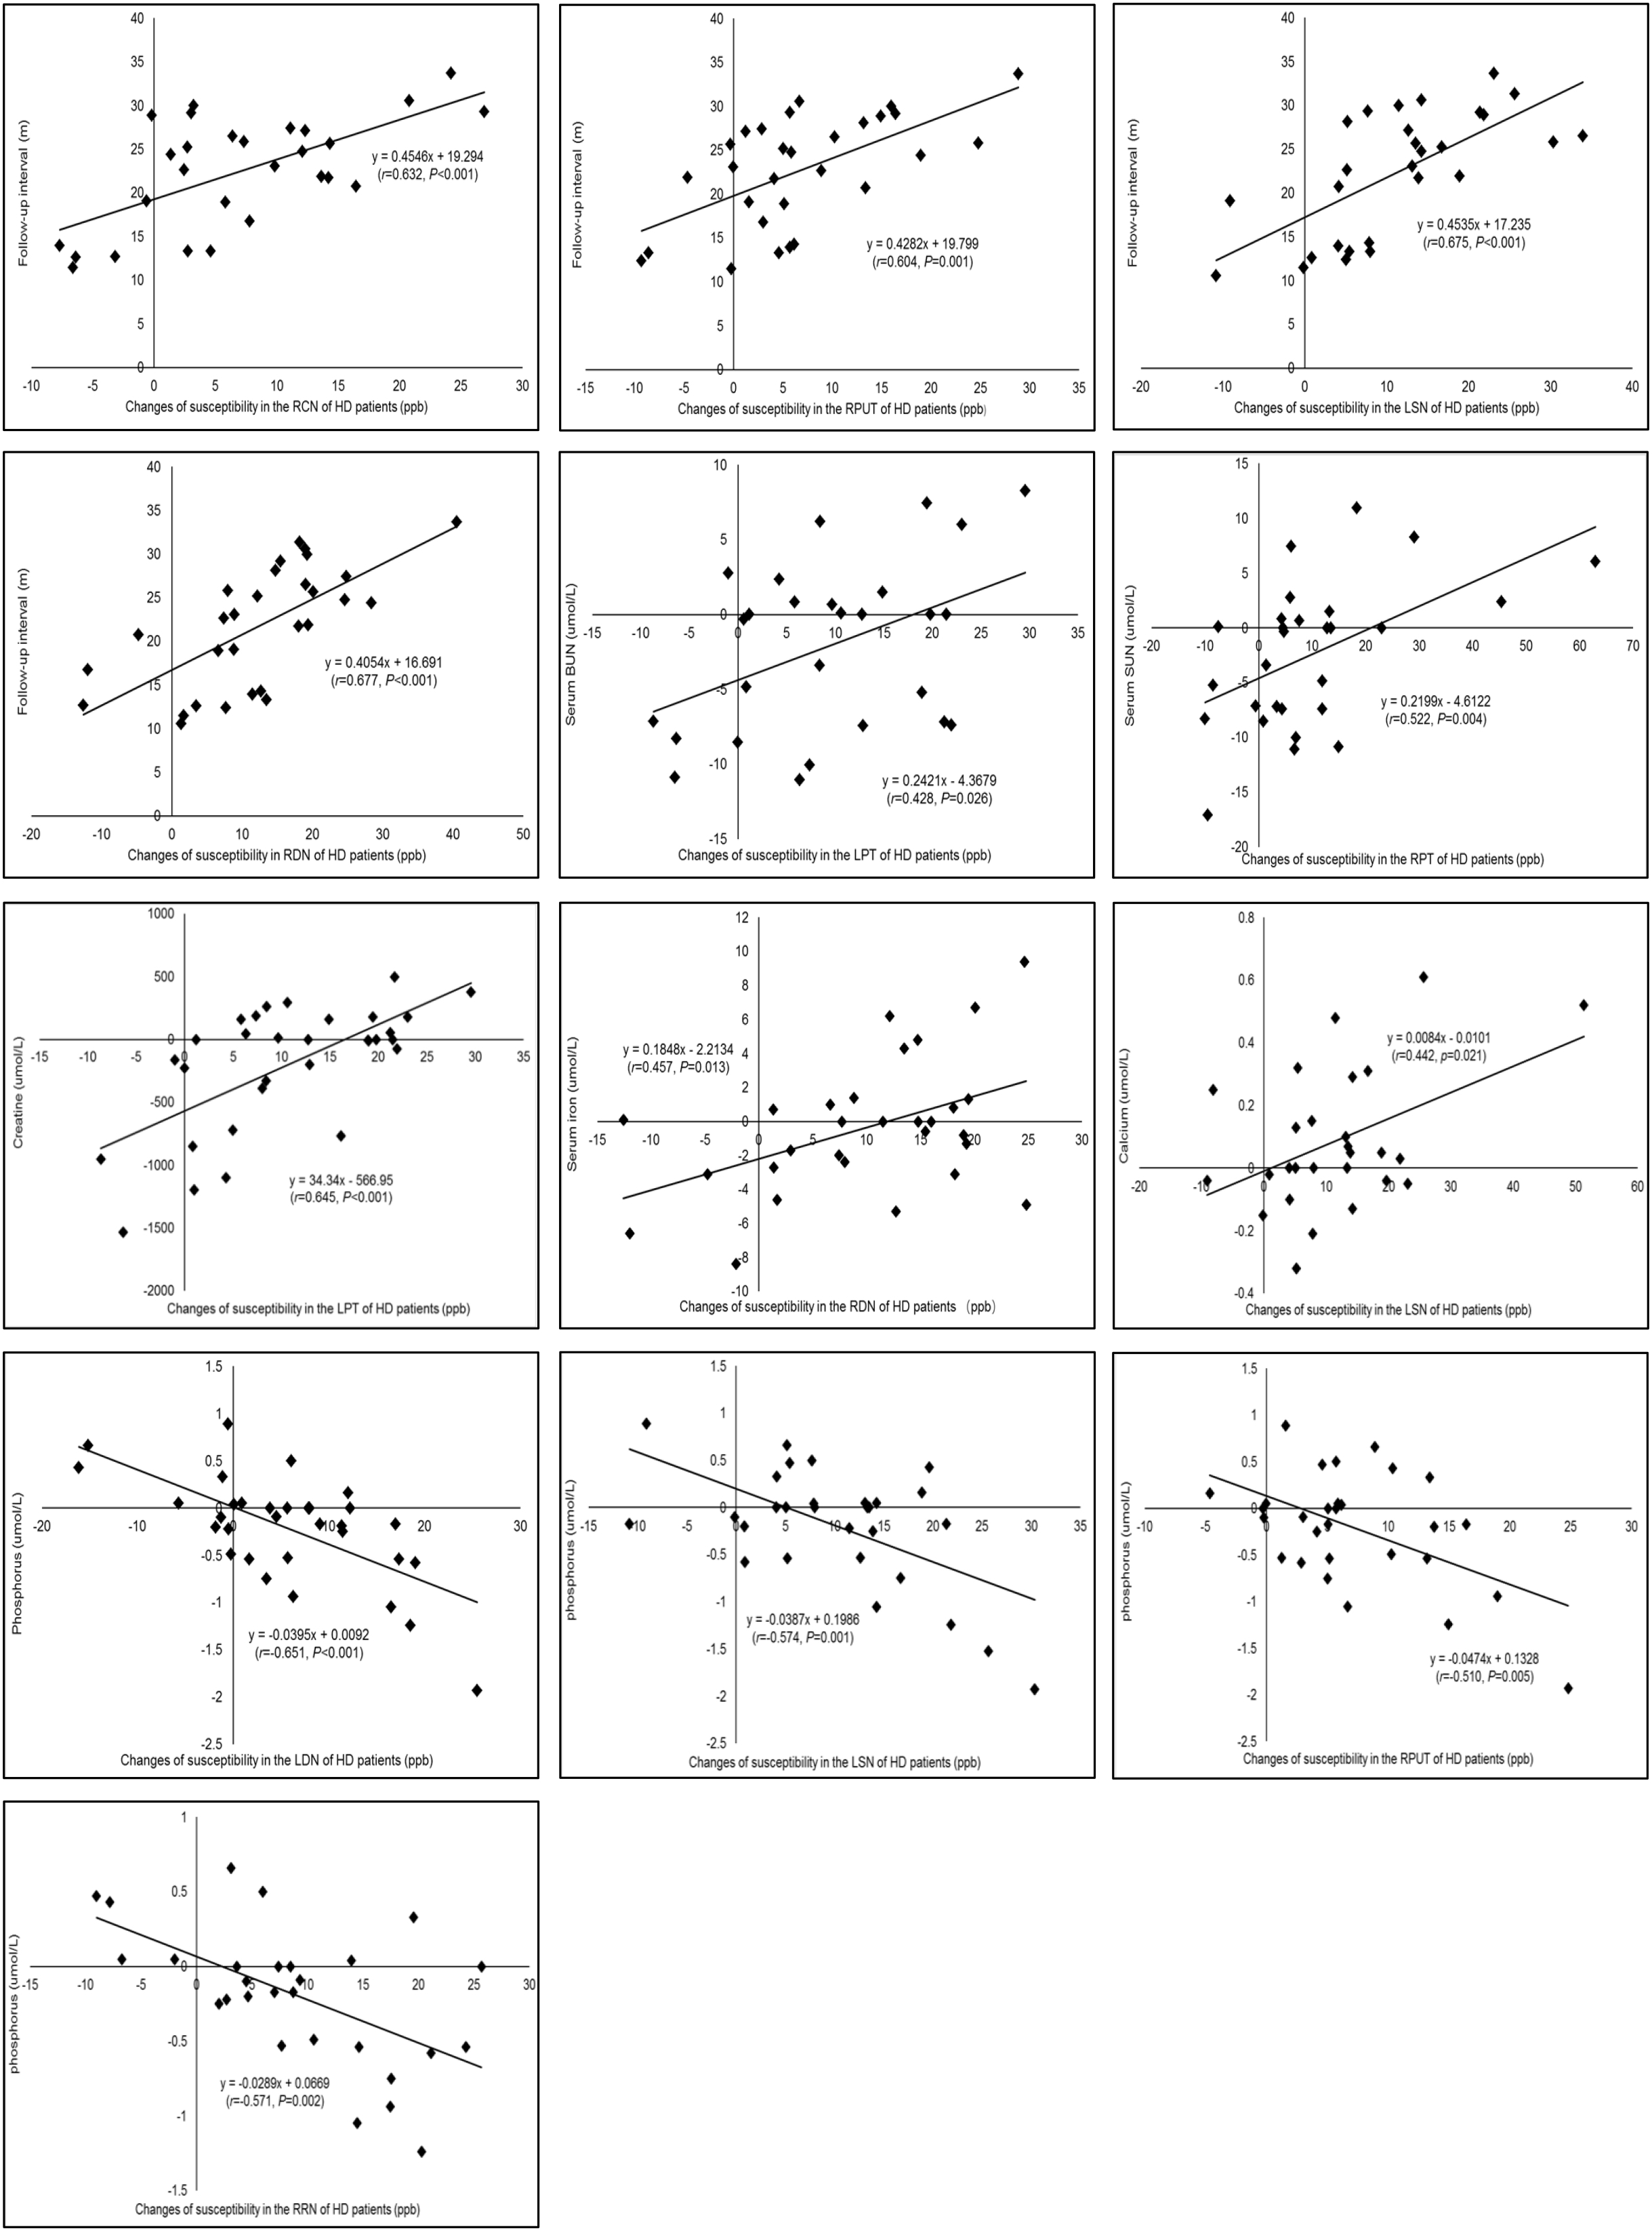
Fig. 4. Correlation between the changes in the susceptibility of the gray matter nuclei and the follow-up intervals, and the changes in the clinical risk factors of the hemodialysis patients.
The follow-up interval significantly correlated with changes in the susceptibility of the RCN, RPUT, LSN, and RDN (all P<0.001). Changes in the serum BUN, creatinine, iron, calcium, and phosphorus were significantly correlated with changes in the susceptibility of the RPT, LPT, RDN, LSN, RPUT, RRN, and LDN (all P<0.05).
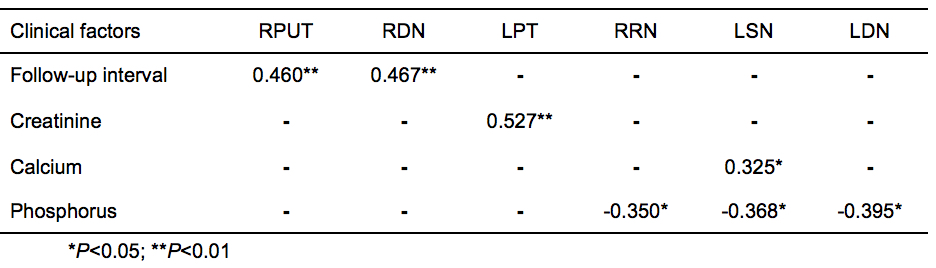
Fig. 5. Independent risk factors for the increase in iron deposition in hemodialysis patients using stepwise multiple regression analysis.
The follow-up interval, creatinine, phosphorus, and calcium were independent risk factors for the increased susceptibility of RPUT, RDN, LPT, RRN, LSN, and LDN (all P<0.05).