3775
Pitfall of synthetic MRI: Effect of gadolinium on the estimation of brain tissue volumes and myelin based on rapid simultaneous relaxometry1Radiology, Juntendo University, Tokyo, Japan, 2Radiology, Graduate School of Medicine, The University of Tokyo, Tokyo, Japan, 3Radiological Sciences, Graduate School of Human Health Sciences, Tokyo Metropolitan University, Tokyo, Japan
Synopsis
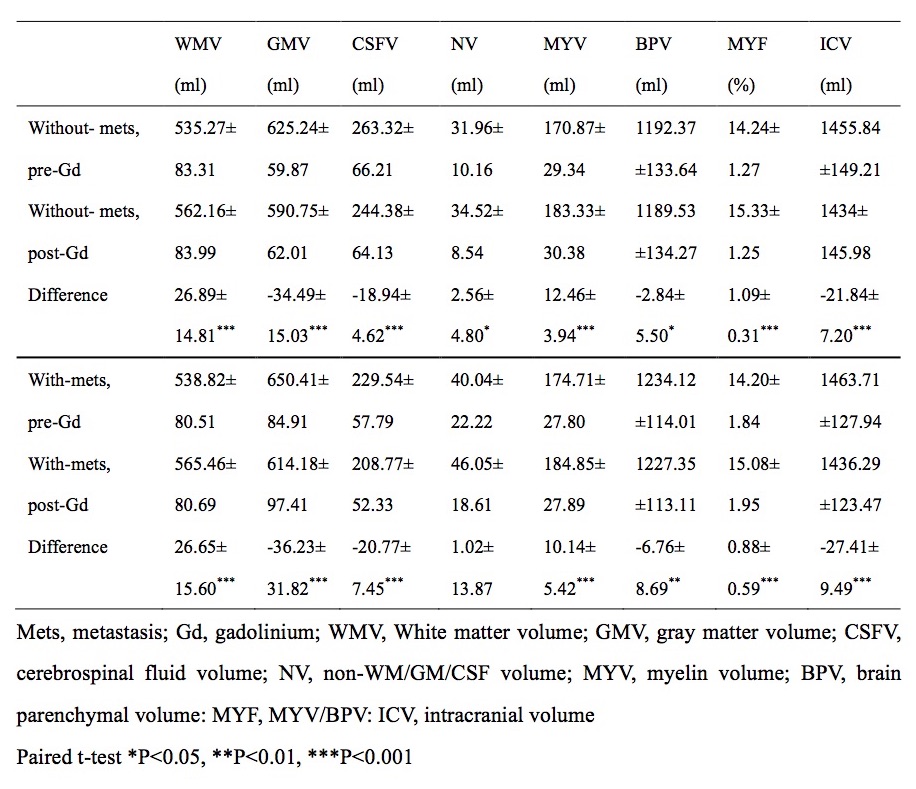
We investigated the effect of gadolinium on the automatic tissue and myelin volumetry using synthetic MRI. 17 patients with metastases and 19 patients without metastasis were retrospectively analyzed before and after administration of gadolinium. After gadolinium administration, white matter volume (ml), non-white matter/gray matter/cerebrospinal fluid volume (ml), myelin volume (ml), and myelin volume/brain parenchymal volume (%) were significantly increased, whereas gray matter volume (ml), cerebrospinal fluid volume (ml), brain parenchymal volume (ml), and intracranial volume (ml) were significantly decreased regardless of metastasis. The gadolinium had significant effects on the automatic calculation of tissue and myelin volumes estimated by synthetic MRI.
Purpose
Effect of gadolinium administration on the
measurement of quantitative synthetic MRI (magnetic resonance imaging) tissue
mapping was investigated by Warntjes et al.1 Recently, myelin measurement technique was also
developed and introduced into synthetic MRI package. Effect of gadolinium on
the measurement of myelin should be considered to when compared with other
acquisitions with or without gadolinium administration. The aim of this study
was to investigate the effect of gadolinium on the automatic brain tissue and
myelin volumetry using quantitative synthetic MRI.Methods
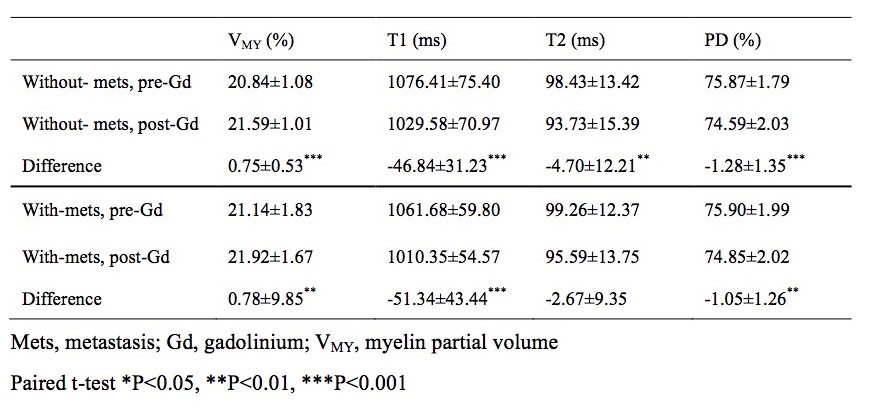
MR Data of patients acquired for screening of brain metastases before and 7 minutes after administration of gadolinium-based contrast agent (GBCA) were retrospectively analyzed. 17 patients with brain metastases and 19 patients without brain metastasis were included in this study. For all patients, synthetic MRI was performed with quantification pulse sequence, namely, quantification of relaxation times and proton density by multi-echo acquisition of saturation-recovery with turbo spin echo readout (QRAPMASTER)2,3 on a 3.0-T MR scanner (Discovery MR750w; GE Healthcare, Milwaukee, Wisconsin) with a 19-channel head coil. The TEs used were 16.9 and 84.5 ms, and the delay times were 146, 546, 1879, and 3879 ms. The other parameters used for quantitative MRI were as follows: TR, 4000ms; FOV, 240 × 240 mm; matrix, 320 × 320; section thickness/gap, 4.0 mm/ 1.0 mm; sections, 30 and each acquisition time, approximately 6 minutes. White matter volume (WMV), gray matter volume (GMV), cerebrospinal fluid volume (CSFV), non-WM/GM/CSF volume (NV), myelin volume (MYV), brain parenchymal volume (BPV), MYV/BPV (MYF), intracranial volume (ICV) were recorded automatically using the synthetic tissue mapping method.4 Myelin volume was also calculated automatically. The model for myelin measurement hypothesizes 4 compartments in the brain: myelin, cellular, free water, and excess parenchymal water partial volumes.5 To investigate change in T1, T2, PD, and myelin partial volume (VMY) in the brain parenchyma, whole brain segmented by FSL using synthetic T1-weighted image was used as region of interest (ROI) and mean values were recorded in each subject. For statistical analysis, we used paired t-test for comparing tissue volumes and mean quantitative values in the brain before and after administration of gadolinium. P value less than 0.05 was considered significant.Results
After gadolinium administration, WMV (ml), NV (ml), MYV (ml) and MYF (%) were significantly increased, whereas GMV (ml), CSFV (ml), BPV (ml) and ICV (ml) were significantly decreased regardless of the presence of metastasis (P < 0.05) (Table 1). In addition, upon ROI analysis, VMY (%) were significantly increased, and T1 (ms), T2 (ms) and PD (%) were significantly decreased after gadolinium administration (Table 2), except for T2 values of patients with brain metastases.Discussion
ROI analysis showed decreased T1, T2, and PD in the whole brain. A previous study reported enhancement of perivascular spaces at 4 hours after intravenous administration of GBCA even in subjects without renal insufficiency.6 This suggests that the gadolinium in the blood vessels might have permeated into the perivascular space and glymphatic system in the brain, thus resulting in decrease in T1, T2, and PD in our study, even though post-gadolinium MRI was performed only 7 minutes after administration of gadolinium. Increased WMV and NV, and decreased GMV, CSFV, BPV, and ICV after gadolinium administration in our study correspond to the previous report.1 Tissue clusters in synthetic tissue mapping used predetermined T1, T2, and PD values in the T1-T2-PD space, with T1, T2, and PD higher for GM than WM4. Thus, decrease in T1, T2, and PD values in our study all should have contributed to increase in WMV and decrease in GMV. On the other hand, decrease in PD in the CSF may have led to decrease in ICV, which was determined at PD = 50%7, resulting also in decrease of CSFV. Our study showed significantly increased MYV, MYF and VMY after gadolinium administration. To our knowledge, this is the first study that evaluated the effect of gadolinium on myelin measurement. On synthetic MRI, myelin measurement is performed using predetermined parameters adjusted to healthy subjects for T1, T2, and PD in 4 partial volume compartments, with myelin showing lower T1, T2, and PD values than other compartments.5 Thus, decrease in T1, T2, and PD in the brain parenchyma should have contributed to increase in apparent myelin volume in the brain. So far, several other methods have been proposed for myelin measurement8,9, and gadolinium may affect differently on other methods than that used in our study.Conclusion
The administration of gadolinium had significant effects on the automatic calculation of brain tissue and myelin volumes using quantitative synthetic MRI.Acknowledgements
All authors have no conflict of interest to disclose.References
1. Warntjes JB, Tisell A, Landtblom AM, et al. Effects of gadolinium contrast agent administration on automatic brain tissue classification of patients with multiple sclerosis. AJNR Am J Neuroradiol. 2014;35(7):1330-1336.
2. Hagiwara A, Warntjes M, Hori M, et al. SyMRI of the Brain: Rapid Quantification of Relaxation Rates and Proton Density, With Synthetic MRI, Automatic Brain Segmentation, and Myelin Measurement. Invest Radiol 2017;52(10):647-657.
3. Warntjes JB, Leinhard OD, West J, et al. Rapid magnetic resonance quantification on the brain: Optimization for clinical usage. Magn Reson Med. 2008;60(2):320-329.
4. West J, Warntjes JB, Lundberg P. Novel whole brain segmentation and volume estimation using quantitative MRI. Eur Radiol. 2012;22(5):998-1007.
5. Warntjes M, Engström M, Tisell A, et al. Modeling the Presence of Myelin and Edema in the Brain Based on Multi-Parametric Quantitative MRI. Front Neurol. 2016;17;7-16.
6. Naganawa S, Nakane T, Kawai H, et al. Gd-based Contrast Enhancement of the Perivascular Spaces in the Basal Ganglia. Magn Reson Med Sci. 2017;10;16(1):61-65.
7. Ambarki K, Lindqvist T, Wåhlin A, et al. Evaluation of automatic measurement of the intracranial volume based on quantitative MR imaging. AJNR Am J Neuroradiol. 2012;33(10):1951-1956.
8. Duval T, Stikov N, Cohen-Adad J. Modeling white matter microstructure. Funct Neurol. 2016;31(4):217-228.
9. Alonso-Ortiz E, Levesque IR, Pike GB. MRI-based myelin water imaging: A technical review. Magn Reson Med. 2015;73(1):70-81.
Figures