3774
Biomarkers of dynamic energy metabolism in Huntington disease1Inserm U 1127, CNRS UMR 7225, Sorbonne Universités, UPMC Univ Paris 06 UMR S 1127, Institut du Cerveau et de la Moelle épinière, ICM, F-75013, Paris, France, 2Center for NeuroImaging Research, Institut du Cerveau et de la Moelle épinière, Paris, France, 3Columbia University, Department of Statistics, New York, NY, United States, 4MIRCeN, Fontenay-aux-Roses, France, 5Neuroscience Research Australia, Sydney, Australia, 6Center for Magnetic Resonance Research (CMRR), University of Minnesota, Minneapolis, MN, United States, 7AP-HP, Pitié-Salpêtrière University Hospital, Department of Genetics, Paris, France, 8University Pierre and Marie Curie, Neurometabolic Research Group, Paris, France
Synopsis
Huntington disease (HD) is a dominantly inherited neurodegenerative disease characterized by involuntary abnormal movements, cognitive and psychiatric symptoms. Evidence suggests that energy deficit plays a critical role in the disease pathophysiology. There is however a lack of robust biomarkers for testing therapeutic strategies targeting brain energy metabolism. This study aims to measure dynamic parameters of brain energy metabolism and identify novel functional biomarkers of for use in therapeutic trials in HD. This study showed altered creatine kinase rate in patients with HD as well as altered diffusion rates of several metabolites in the corpus callosum of patients with HD.
Purpose
Huntington disease (HD) is an inherited polyglutamine disease characterized by involuntary abnormal movements, cognitive and psychiatric symptoms, associated with preferential atrophy of the striatum.1 Evidence suggests that energy deficit plays a critical role in the disease pathophysiology.2 Evaluating metabolic dysfunction can help identify functional biomarkers for therapeutic trials. However, existing methods are unable to fully capture the dynamic metabolism of the brain with their static measurements. This study thus aims to measure dynamic parameters of brain energy metabolism to decipher the mechanisms underlying brain energy deficit in HD and identify novel functional biomarkers to be used in clinical trials such as those targeting the Krebs cycle.Methods
The
study was divided into two phases. The first phase involved recruiting 10
healthy individuals for method validation. The second phase is still ongoing
and seeks to recruit 20 presymptomatic individuals, 20 patients at the early
stage of HD and 20 controls with similar age and body mass index. Following our
observation of an abnormal energy profile in the occipital cortex in previous
studies,3,4 we performed 31P magnetization transfer (31P
MT, pulse acquire, TR = 15
s) in the occipital cortex to measure the rate of brain creatine kinase. A 25 x
25 x 25 mm3 voxel covering the calcarine was used for shimming. Frequency
calibration was performed for each subject in order to determine the voltage
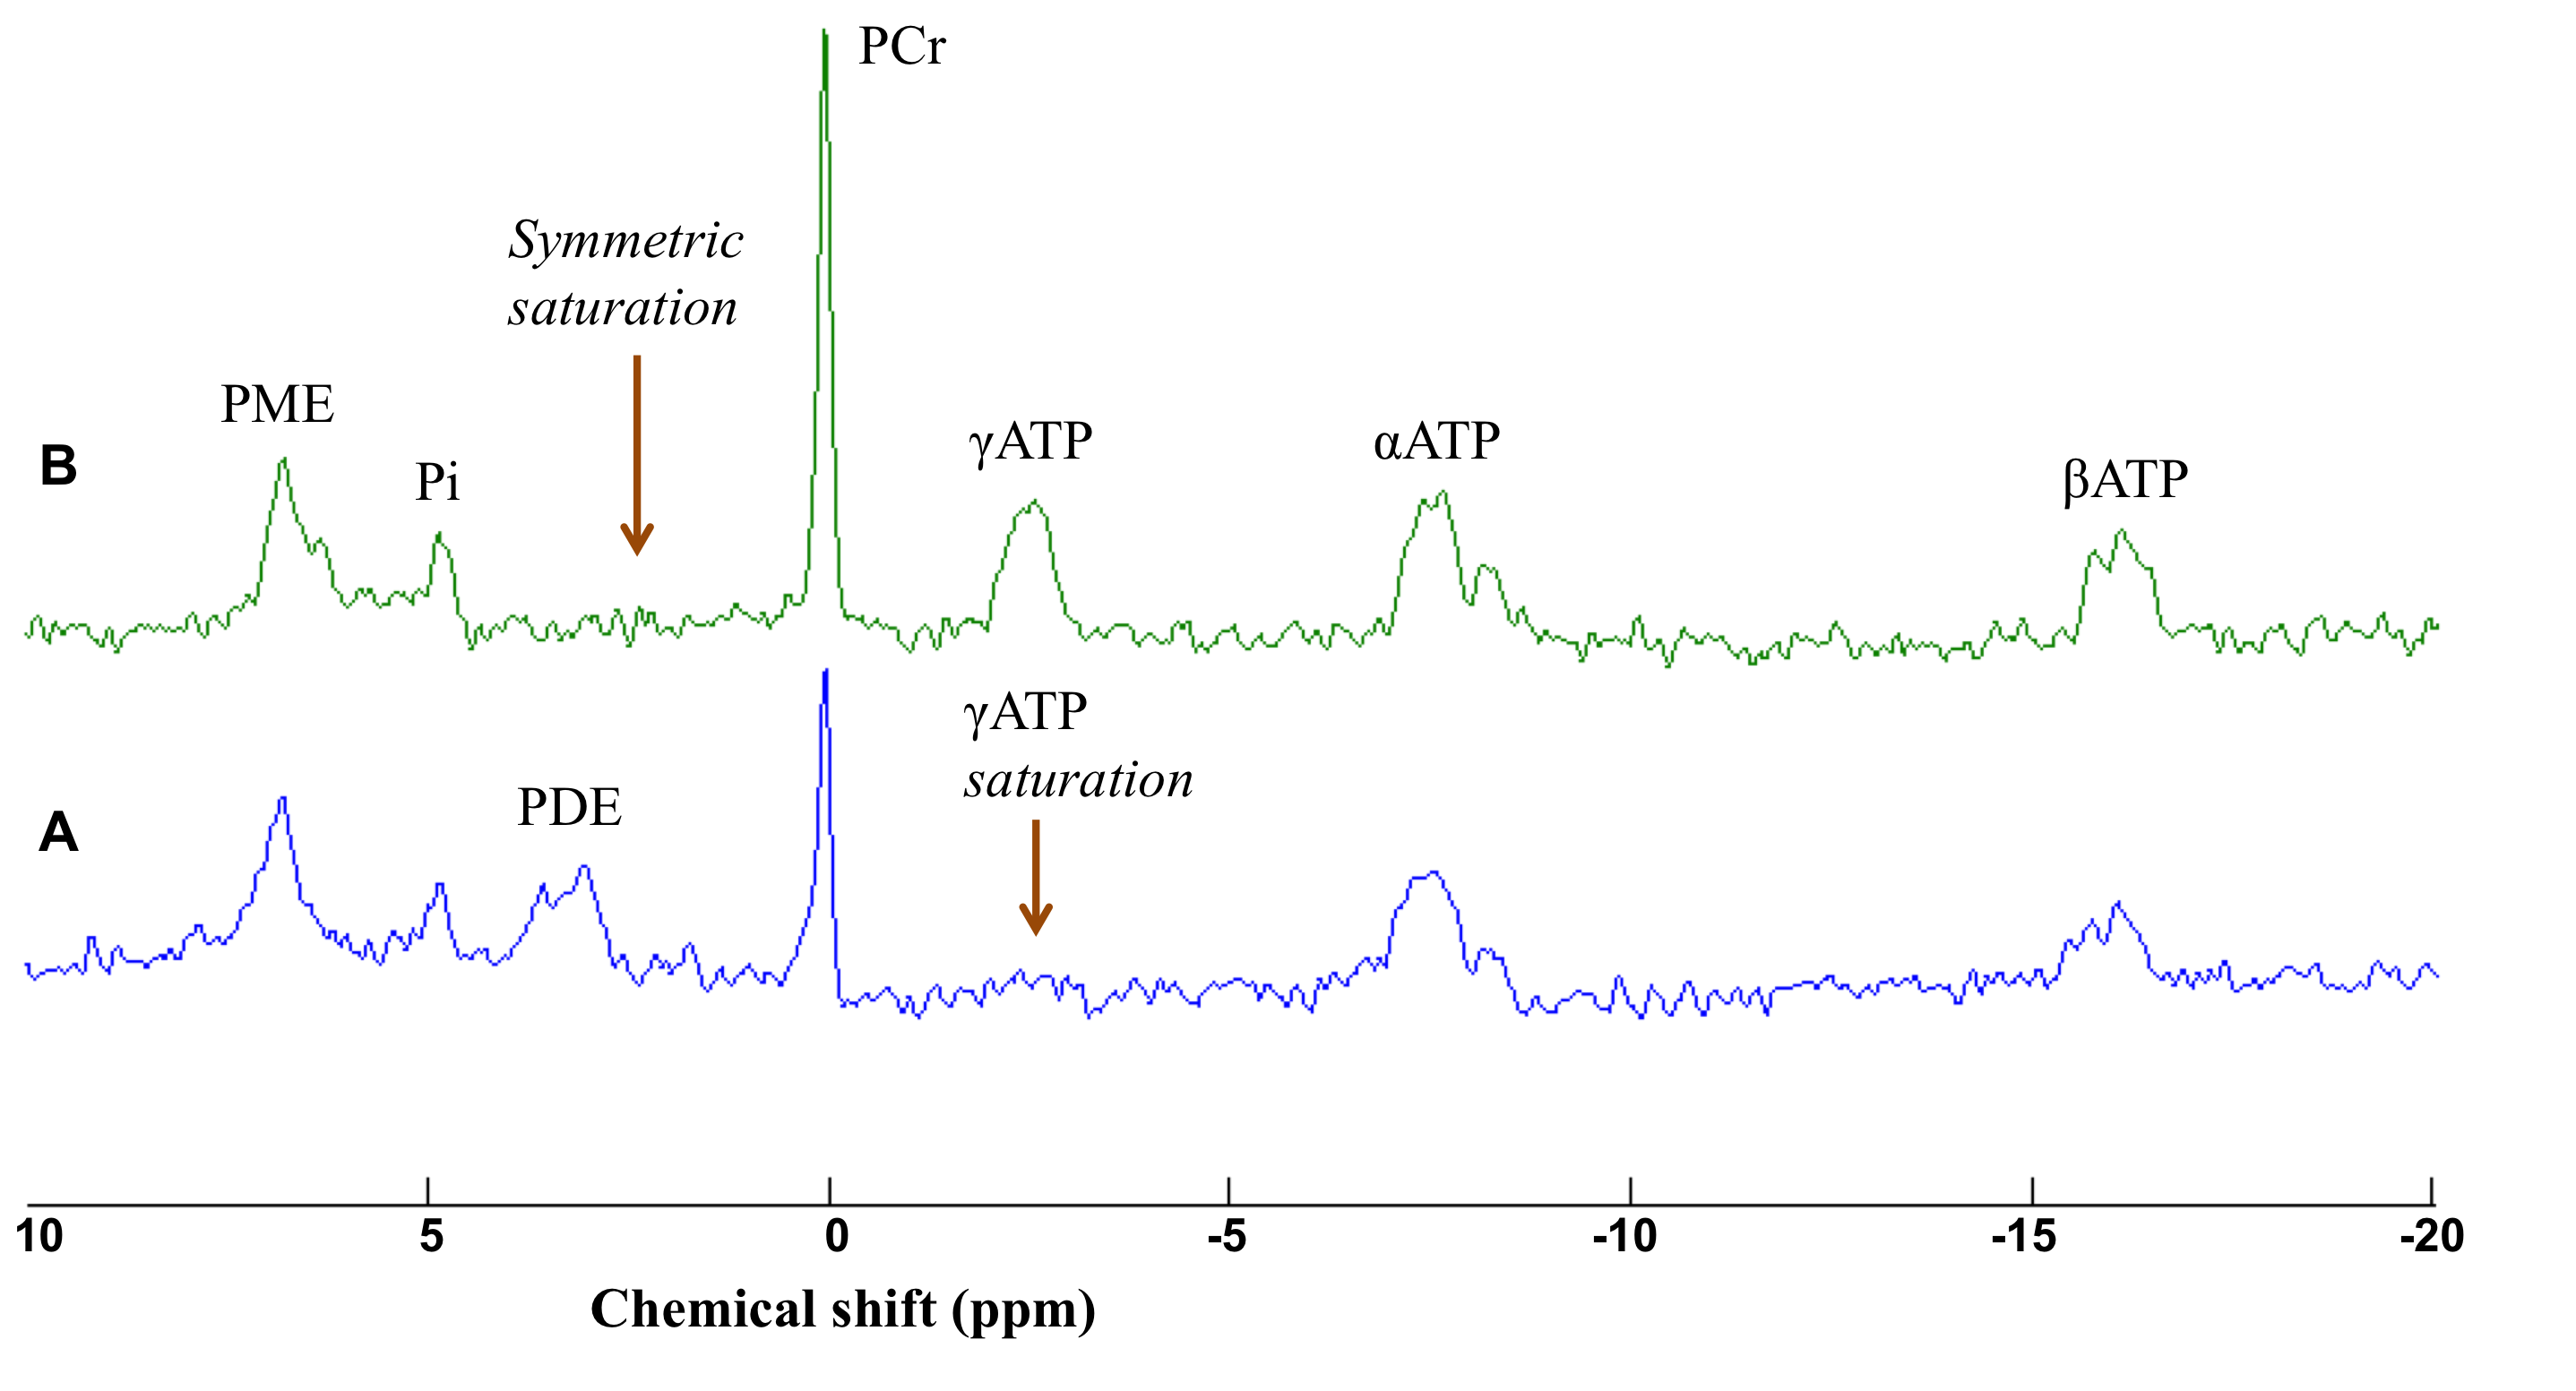
needed to achieve the maximum signal. Saturation of the γATP resonance was
performed using 8 cycles of B1-insensitive train to obliterate signal (BISTRO)5
pulse (duration 3.5 s). A symmetric saturation was performed at the opposite
side of the phosphocreatine (PCr) resonance to correct for RF bleedover. Data were
collected for 8 min each at rest, during visual stimulation with red-black
checkerboard flashes, and recovery after visual stimulation. Spectra were
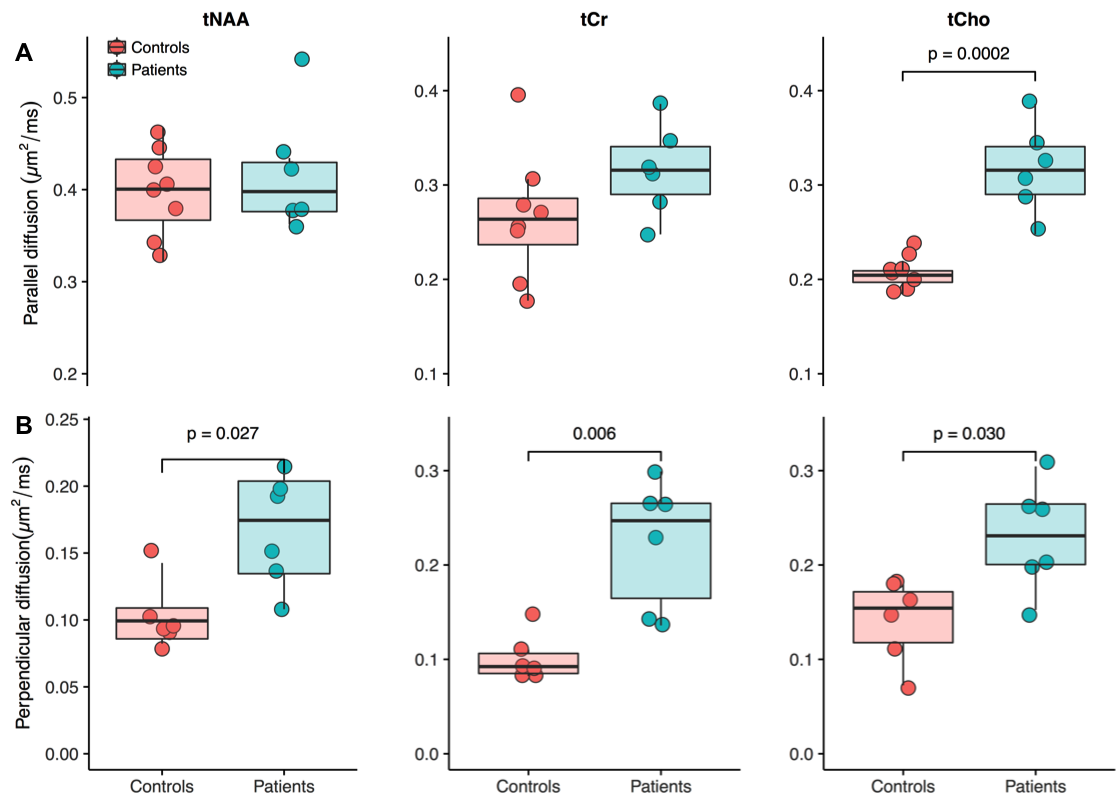
analyzed using LCModel as explained.6 Diffusion weighted
spectroscopy (DWS) was also used to evaluate the diffusion properties of
metabolites that reflect distinct metabolic compartments, i.e. neuronal versus
glial. DWS was performed in the occipital cortex (VOI = 25 x 25 x 25 mm3,
b value = 0, 3550 s/mm2)
and the corpus callosum (VOI = 8 x 15 x 32 mm3, parallel diffusion: b values = 0, 482, 772, 1737, 3088 s/mm2;
perpendicular diffusion: b values =
0, 964, 1544, 3474, 6176 s/mm2). Spectra were analyzed with LCModel
and the apparent diffusion coefficient of total N-acetylaspartate (tNAA), total creatine (tCr) and total choline
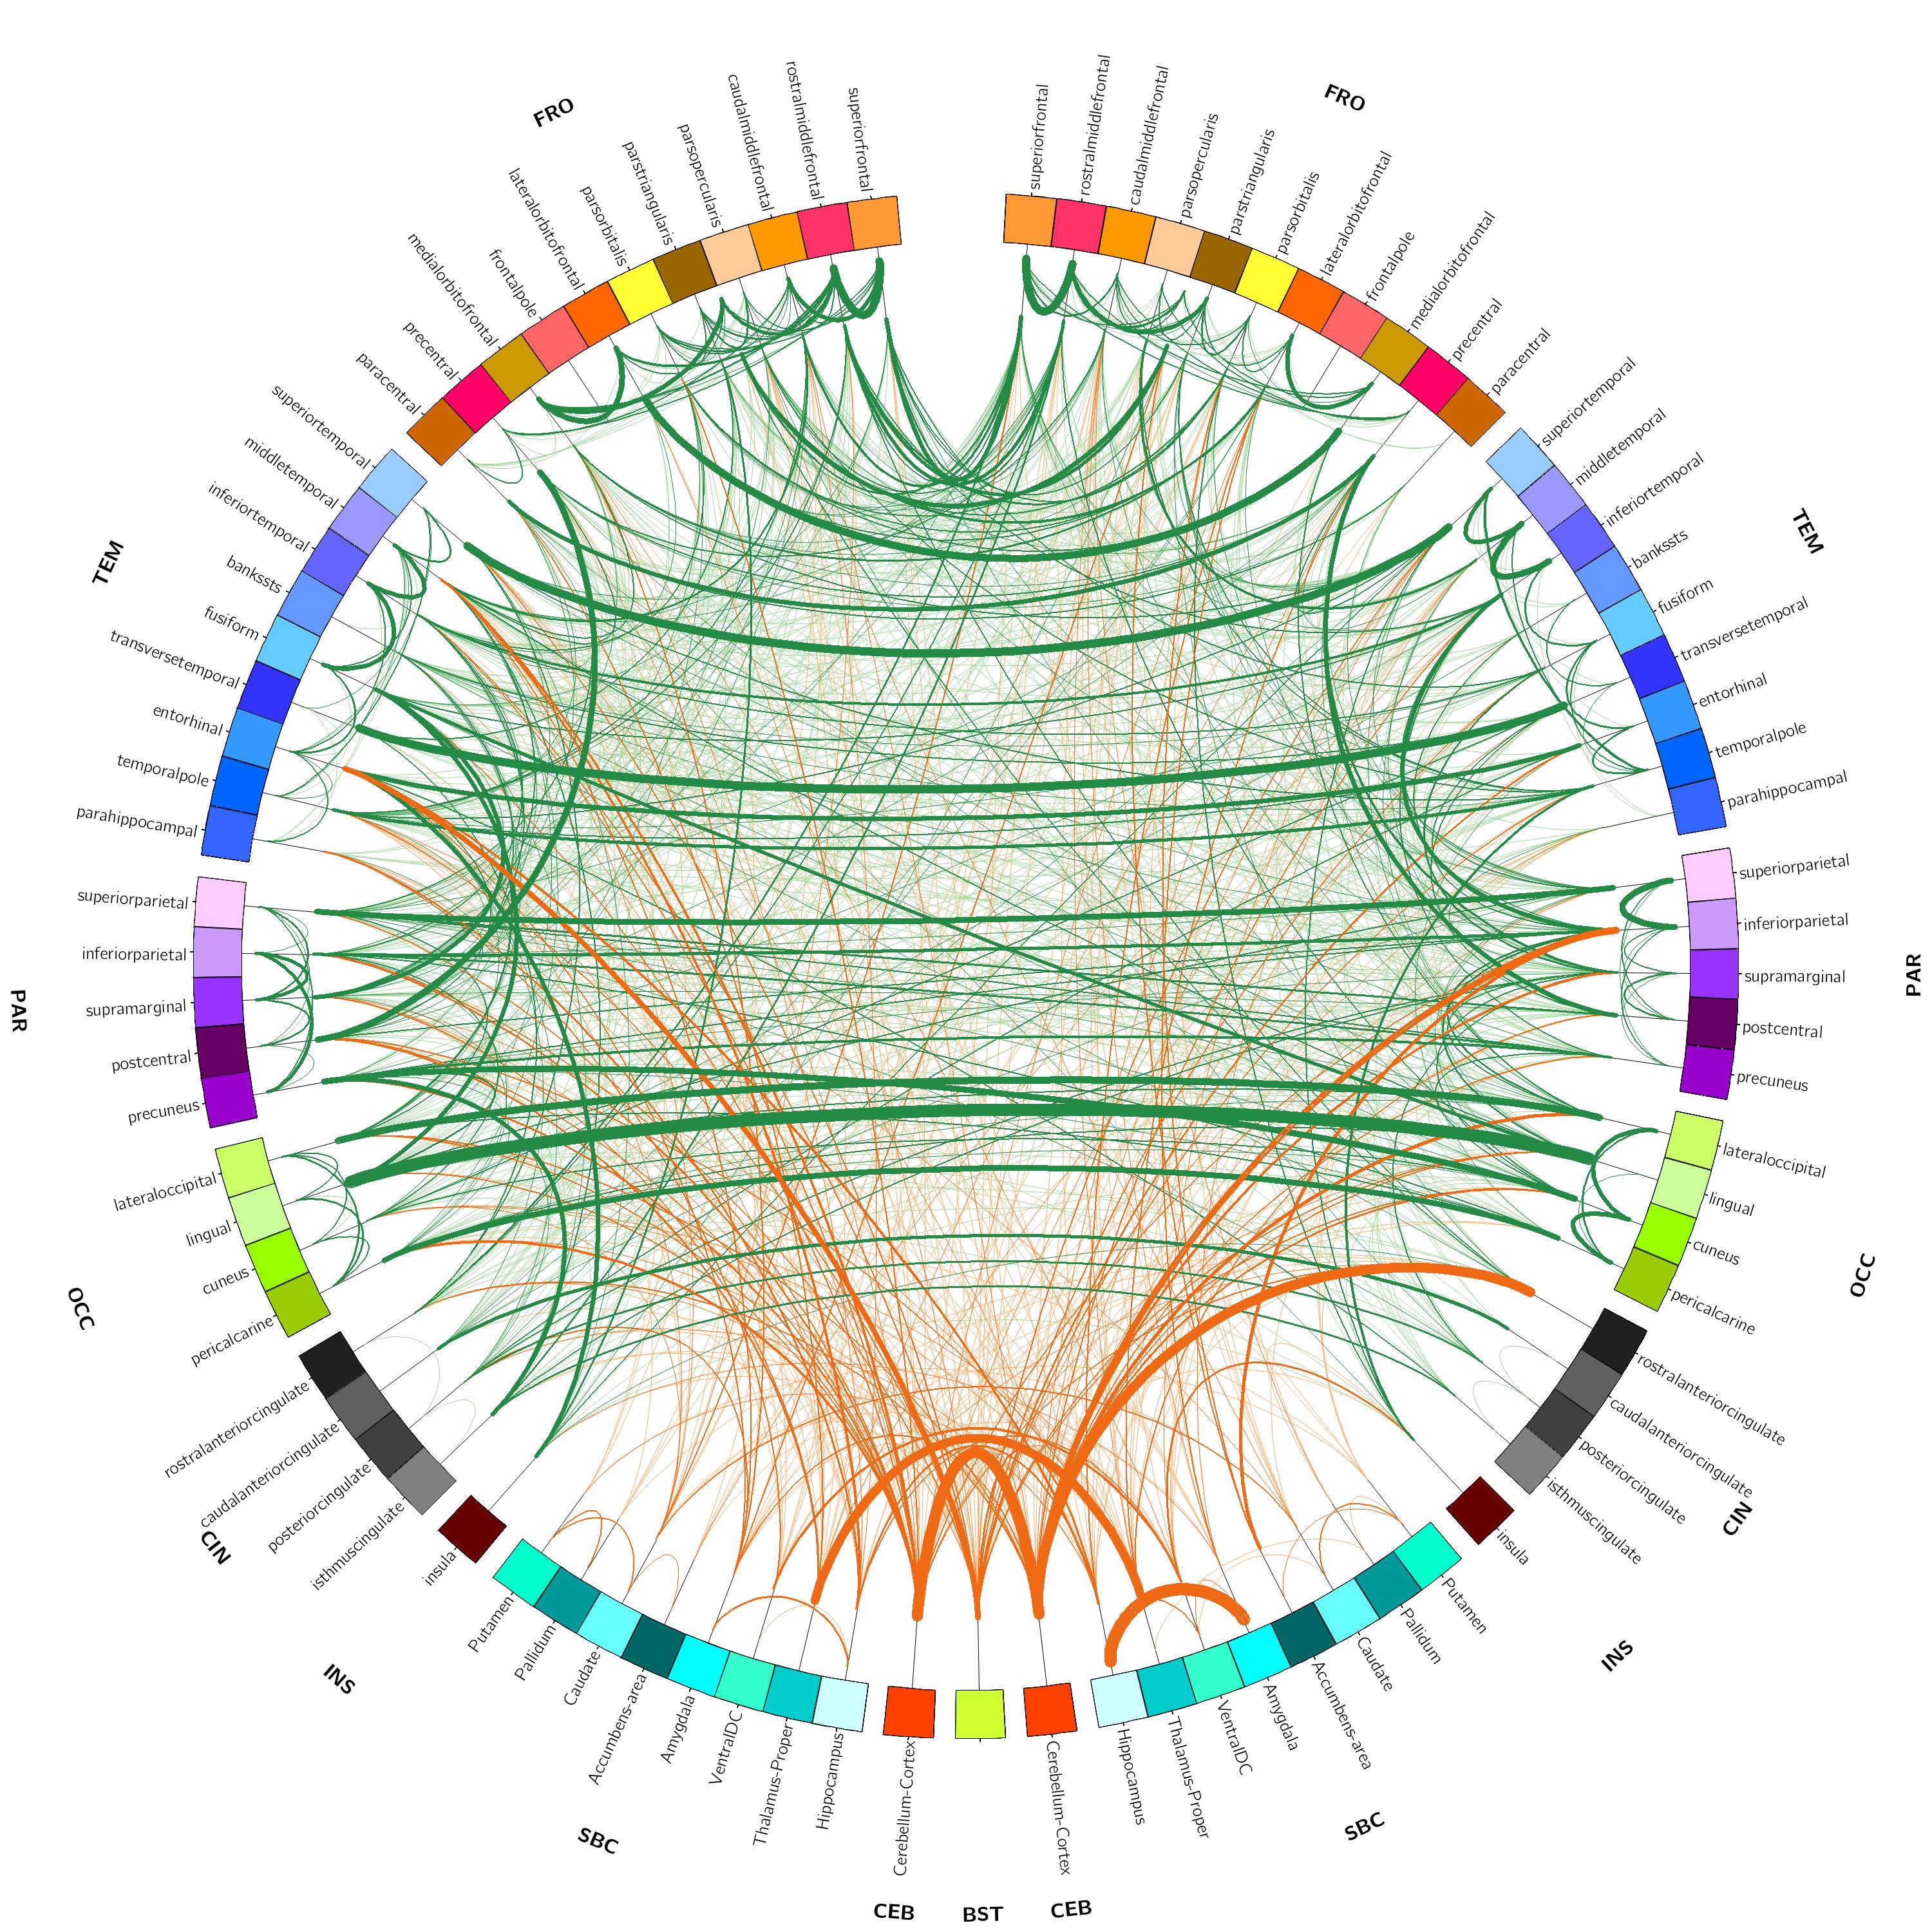
(tCho) were calculated. Furthermore, resting state functional MRI (rsfMRI, TR = 1000 ms, slice
thickness = 3 mm isotropic, number of measurements = 600, multiband
acceleration factor = 3, acquisition time = 10 min) was performed to capture
the impact of functional connectivity on neurometabolism and vice versa. The
data were analyzed using robust and reproducible algorithms7 developed
by our collaborators at the Neuroscience Research Australia in Sydney,
Australia to incorporate temporal correlations, remove spurious spatial
correlations, deal with artifacts, and the ability to apply on single subjects.
Multi-shell diffusion weighted imaging (b
values = 2500 s/mm2 (60 directions), 900 s/mm2 (32
directions) and 300 s/mm2 (8 directions)) was also included in the
protocol to evaluate the effect of neurometabolism on the microstructural
integrity in HD. Results
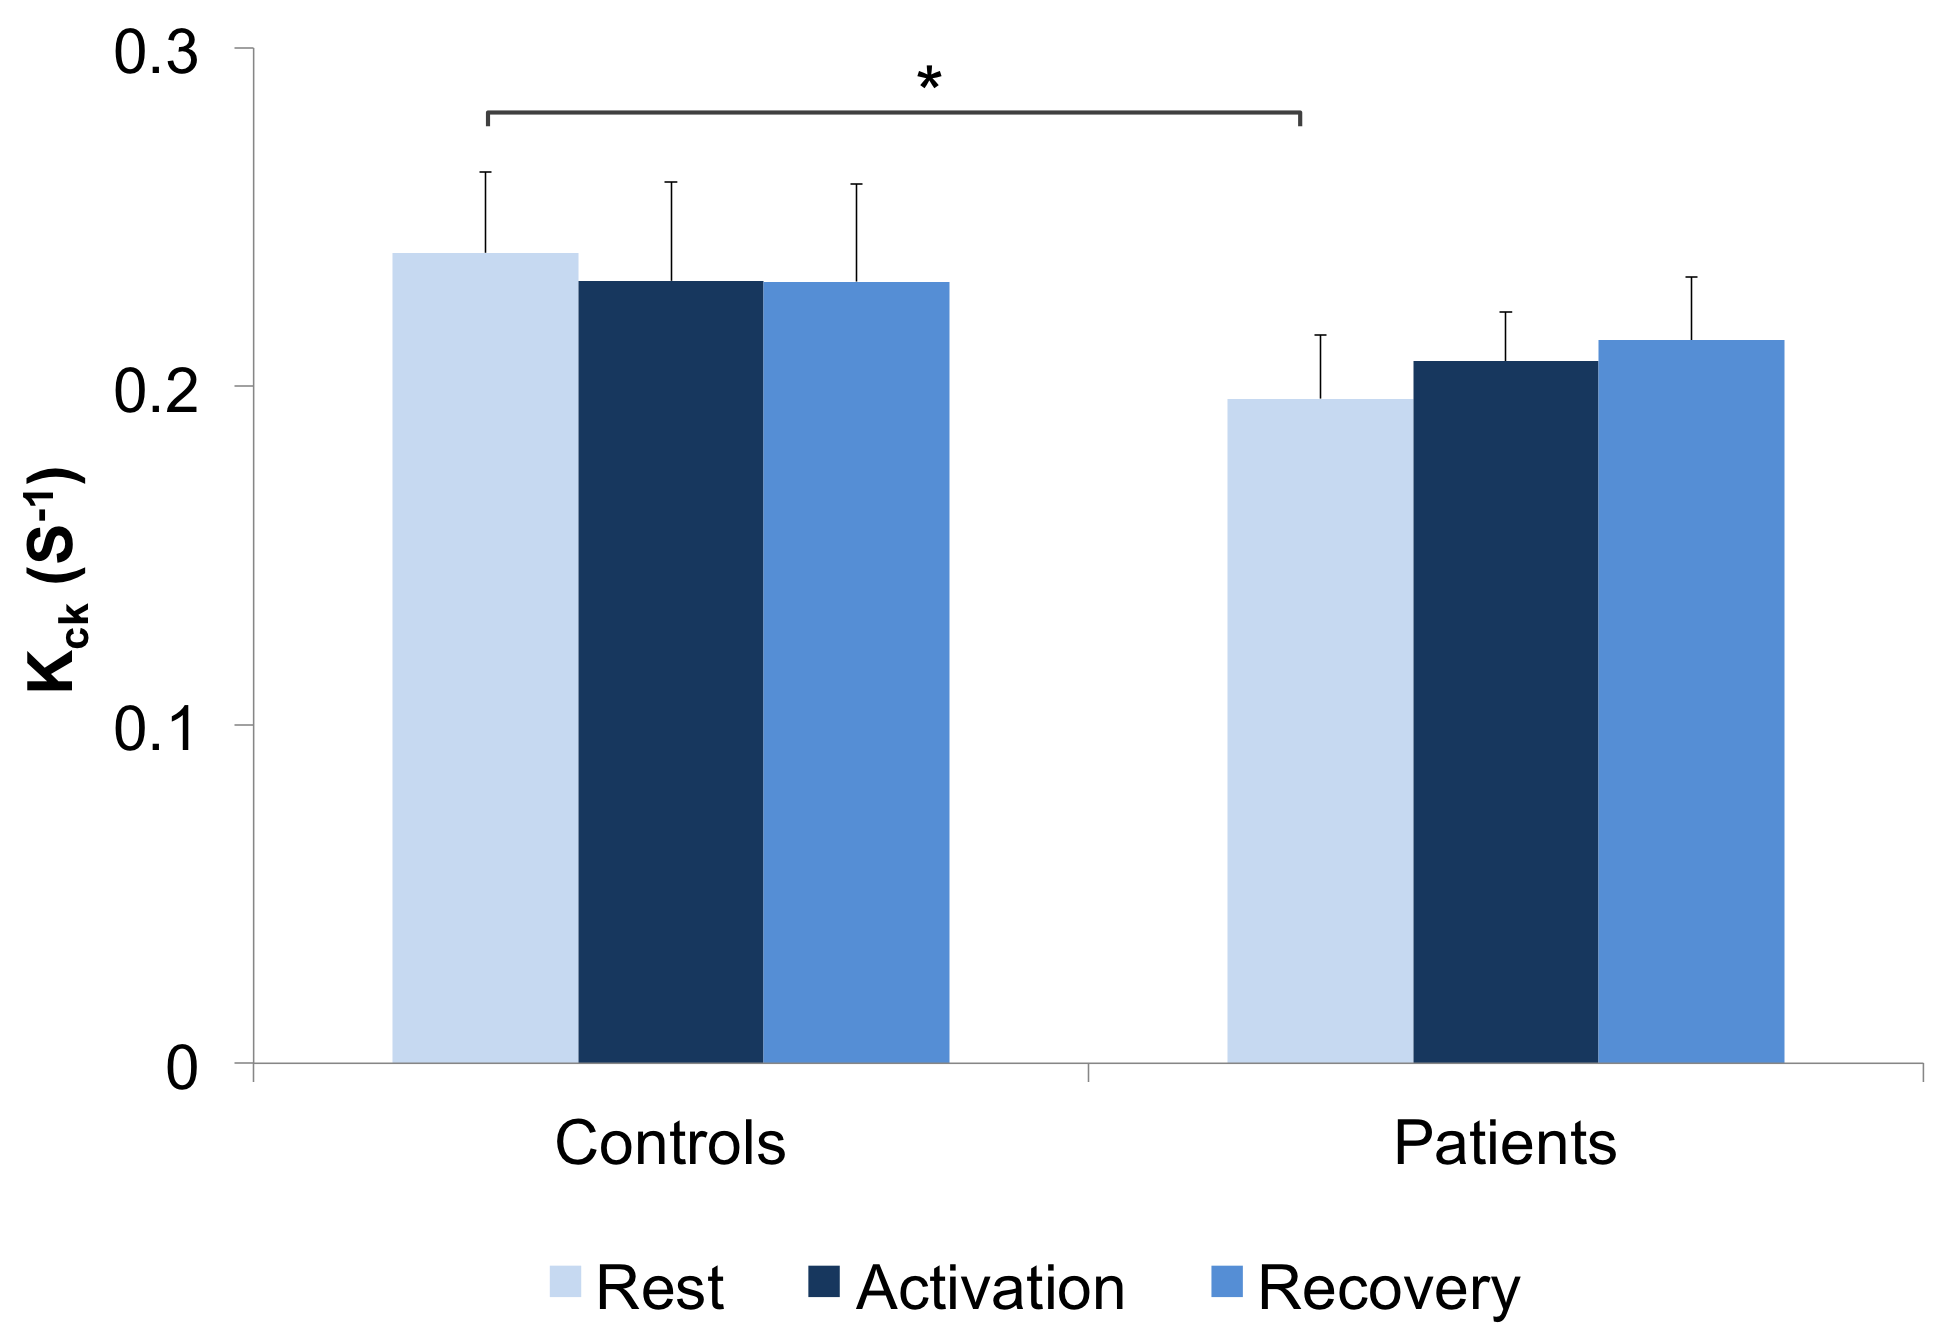
The first phase of the study was successfully completed and we are currently on phase two and hence will present preliminary results. Preliminary analyses of 31P MT data showed that we fully saturated γATP resonance (Figure 1). We observed decreased CK rate at rest in patients compared to controls (p < 0.05) (Figure 2) but are yet to observe any change during visual stimulation and the recovery phase. The DWS data showed increase in the parallel diffusion of tCho (p < 0.05) in the corpus callosum and may signify increased gliosis (Figure 3A). There was also an increased perpendicular diffusion of tNAA, tCr and tCho (p < 0.05) in the corpus callosum (Figure 3B). These may point to possible axonal damage, energetic compensatory mechanism and increased gliosis respectively. No change was observed in the visual cortex. The rsfMRI protocol was well tolerated – e.g. no induction of peripheral nerve stimulation – and the data was of high quality. Preliminary analyses showed that we are able to extract pertinent information related to the networks (Figure 4). Since data acquisition is still ongoing, we are yet to perform statistical analyses of rsfMRI and diffusion data between the subject cohorts.Conclusion
Our protocols were able to capture the dynamic alterations in neurometabolism in HD. They are thus suitable for finding functional biomarkers for use in therapeutic interventions targeting the Krebs cycle.Acknowledgements
We are very grateful to the patients and volunteers who participated in this study.References
1. Roos RAC. Huntington’s disease: a clinical review. Orphanet J Rare Dis 2010;5:40.
2. Mochel F, Charles P, Seguin F, et al. Early energy deficit in Huntington disease: identification of a plasma biomarker traceable during disease progression. PLoS One 2007;2:e647.
3. Mochel F, N’Guyen TM, Deelchand D, et al. Abnormal response to cortical activation in early stages of Hunting- ton disease. Mov Disord 2012;27:907–910.
4. Adanyeguh IM, Rinaldi D, Henry PG, et al. Triheptanoin improves brain energy metabolism in patients with Huntington disease. Neurology 2015;84:490-495.
5. Luo Y, de Graaf RA, DelaBarre L, Tannus A, Garwood M. BISTRO: an outer-volume suppression method that tolerates RF field inhomogeneity. Magn Reson Med 2001;45:1095-1102.
6. Deelchand DK, Nguyen TM, Zhu XH, Mochel F, Henry PG. Quantification of in vivo ³¹P NMR brain spectra using LCModel. NMR Biomed 2015;28:633-641
7. Cassidy B, Rae C, Solo V. Brain activity: connectivity, sparsity, and mutual information. IEEE Trans Med Imaging 2015;34:846-860.
Figures