3772
Cortical Cerebral Blood Flow in Aging: Effects of Haematocrit, Sex and Ethnicity.1Dept. of Population Science and Experimental Medicine, Institute of Cardiovascular Sciences, University College London, London, United Kingdom, 2Translational Imaging Group, Dept. of Medical Physics and Biomedical Engineering, University College London, London, United Kingdom, 3Dept. of Medical Physics and Biomedical Engineering, University College Hospital, London, United Kingdom, 4Centre for Medical Imaging, University College London, London, United Kingdom, 5Inst. of Neurology, University College London, London, United Kingdom, 6Inst. of Healthcare Engineering, University College London, London, United Kingdom, 7Dept. of Radiology and Nuclear Medicine, VU University Medical Centre, Amsterdam, Netherlands, 8Neuroradiological Academic Unit, Dept. of Brain Repair and Rehabilitation, University College London, London, United Kingdom
Synopsis
Cerebral blood flow (CBF) estimates using arterial spin labelling (ASL) show unexplained variability in older populations. We studied the impact of haematocrit (Hct) on CBF quantification in a tri-ethnic elderly population cohort. Hct was measured from blood samples and pseudo-continuous ASL performed on 3T MR. CBF was estimated using a fixed value of 43.5% (model 1) and individually measured Hct (model 2) to calculate the longitudinal relaxation time of blood in simplified Buxton equations. CBF estimates using individual Hct were lower than CBF estimates using a mean Hct in all ethnic and sex categories except white European men.
Purpose
Cerebral blood flow (CBF) measured using arterial spin labelling( ASL) has been recognised as an early biomarker for dementia, cognitive decline and small vessel disease [1-4]. However, CBF estimates show unexplained variability in older populations. We studied the impact of haematocrit (Hct) on CBF quantification in a tri-ethnic elderly population.Background
Deriving quantitative perfusion values from the raw MRI signal requires application of a model containing several assumptions relating to physiological properties of the blood and tissues. The ISMRM white paper recommendations include the application of a simplified Buxton equation for quantification of single post-labelling delay ASL using 1650ms as the longitudinal relaxation time of blood (T1blood) at 3T [5]. This value has been derived from experiments under appropriate physiological conditions and assuming an average adult Hct of 43.5%[6]. Hct varies by sex with females typically having lower Hct than males [7] and there is evidence regarding Hct differences between some ethnic groups [8, 9]. The purpose of this study was to investigate the influence of Hct on the estimation of CBF and to determine how this impacts on the associations of CBF with sex and ethnicity.Methods
Study subjects (n = 493, 40% female, age mean (SD) 71.6 ±5.9 years) were an elderly community-dwelling London based population cohort from three ethnic backgrounds (White European, South Asian and African Caribbean) drawn from the SABRE Study (SABREstudy.org). Hct was measured using an impedance based, direct current sheath flow method (Sysmex XE2100) from a venous blood sample. 3T cerebral MR (Achieva, Philips, Best, The Netherlands) included a sagittal T1-weighted 3D-TFE (TR/TE/TI 7/ 3.2/836ms, flip-angle 18°, voxel size 1mm3), and a transversal 2D pseudo-continuous arterial spin labelling (PCASL), (EPI, TR/TE 4615/15ms, flip-angle 90°, voxel size 3.75mm x 3.75mm x 5mm, 1mm slice gap, 20 slices), labelling duration 1800ms, post labelling delay 2000ms. Tissue segmentation was obtained using the Geodesic Information Flows framework [10]. T1blood was calculated based on the formula: T1=(0.52*Hct+0.38)-1 [6] either with fixed value of 43.5% (corresponding to the standard value of T1=1650ms), used in model 1 (CBF_fixed), or calculated based on the Hct values measured from each participant and used in model 2 (CBF_Hct). Partial volume correction was applied based upon the method used in [11]. Differences in perfusion between CBF models stratified by sex and ethnicity were calculated. Statistical significance (p<0.05) between the CBF models was tested with paired Student’s t-tests.Results
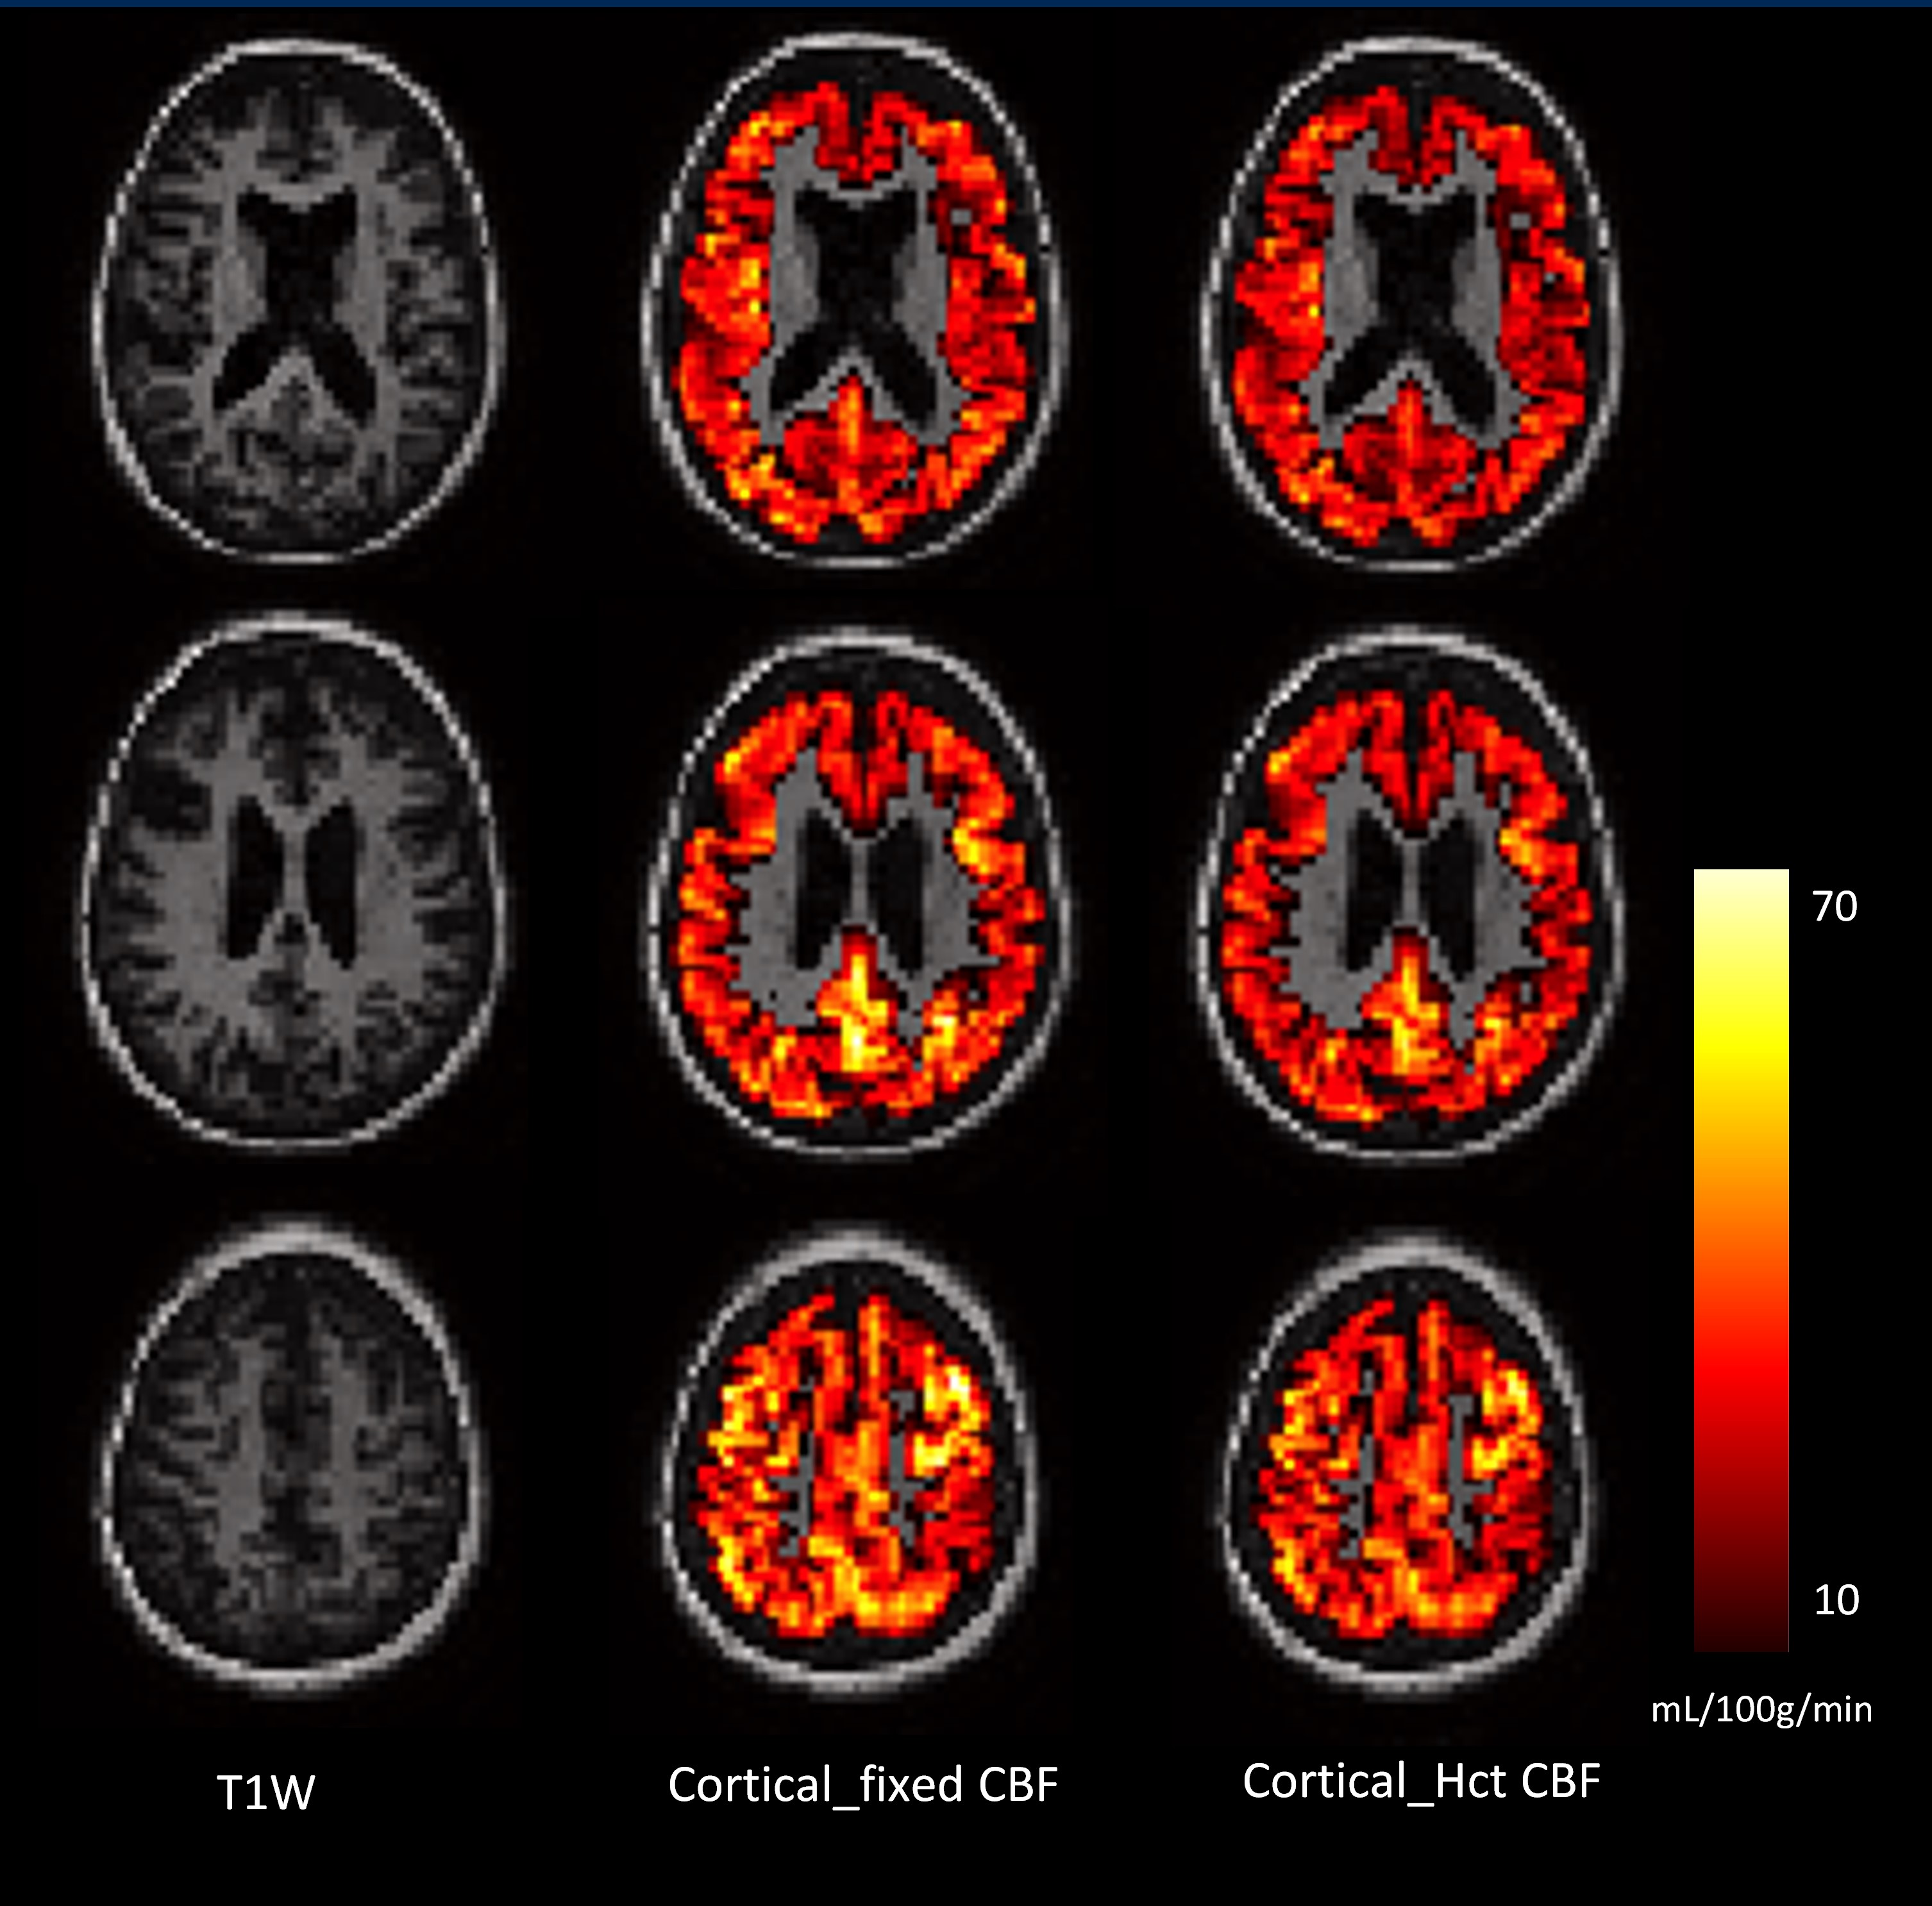
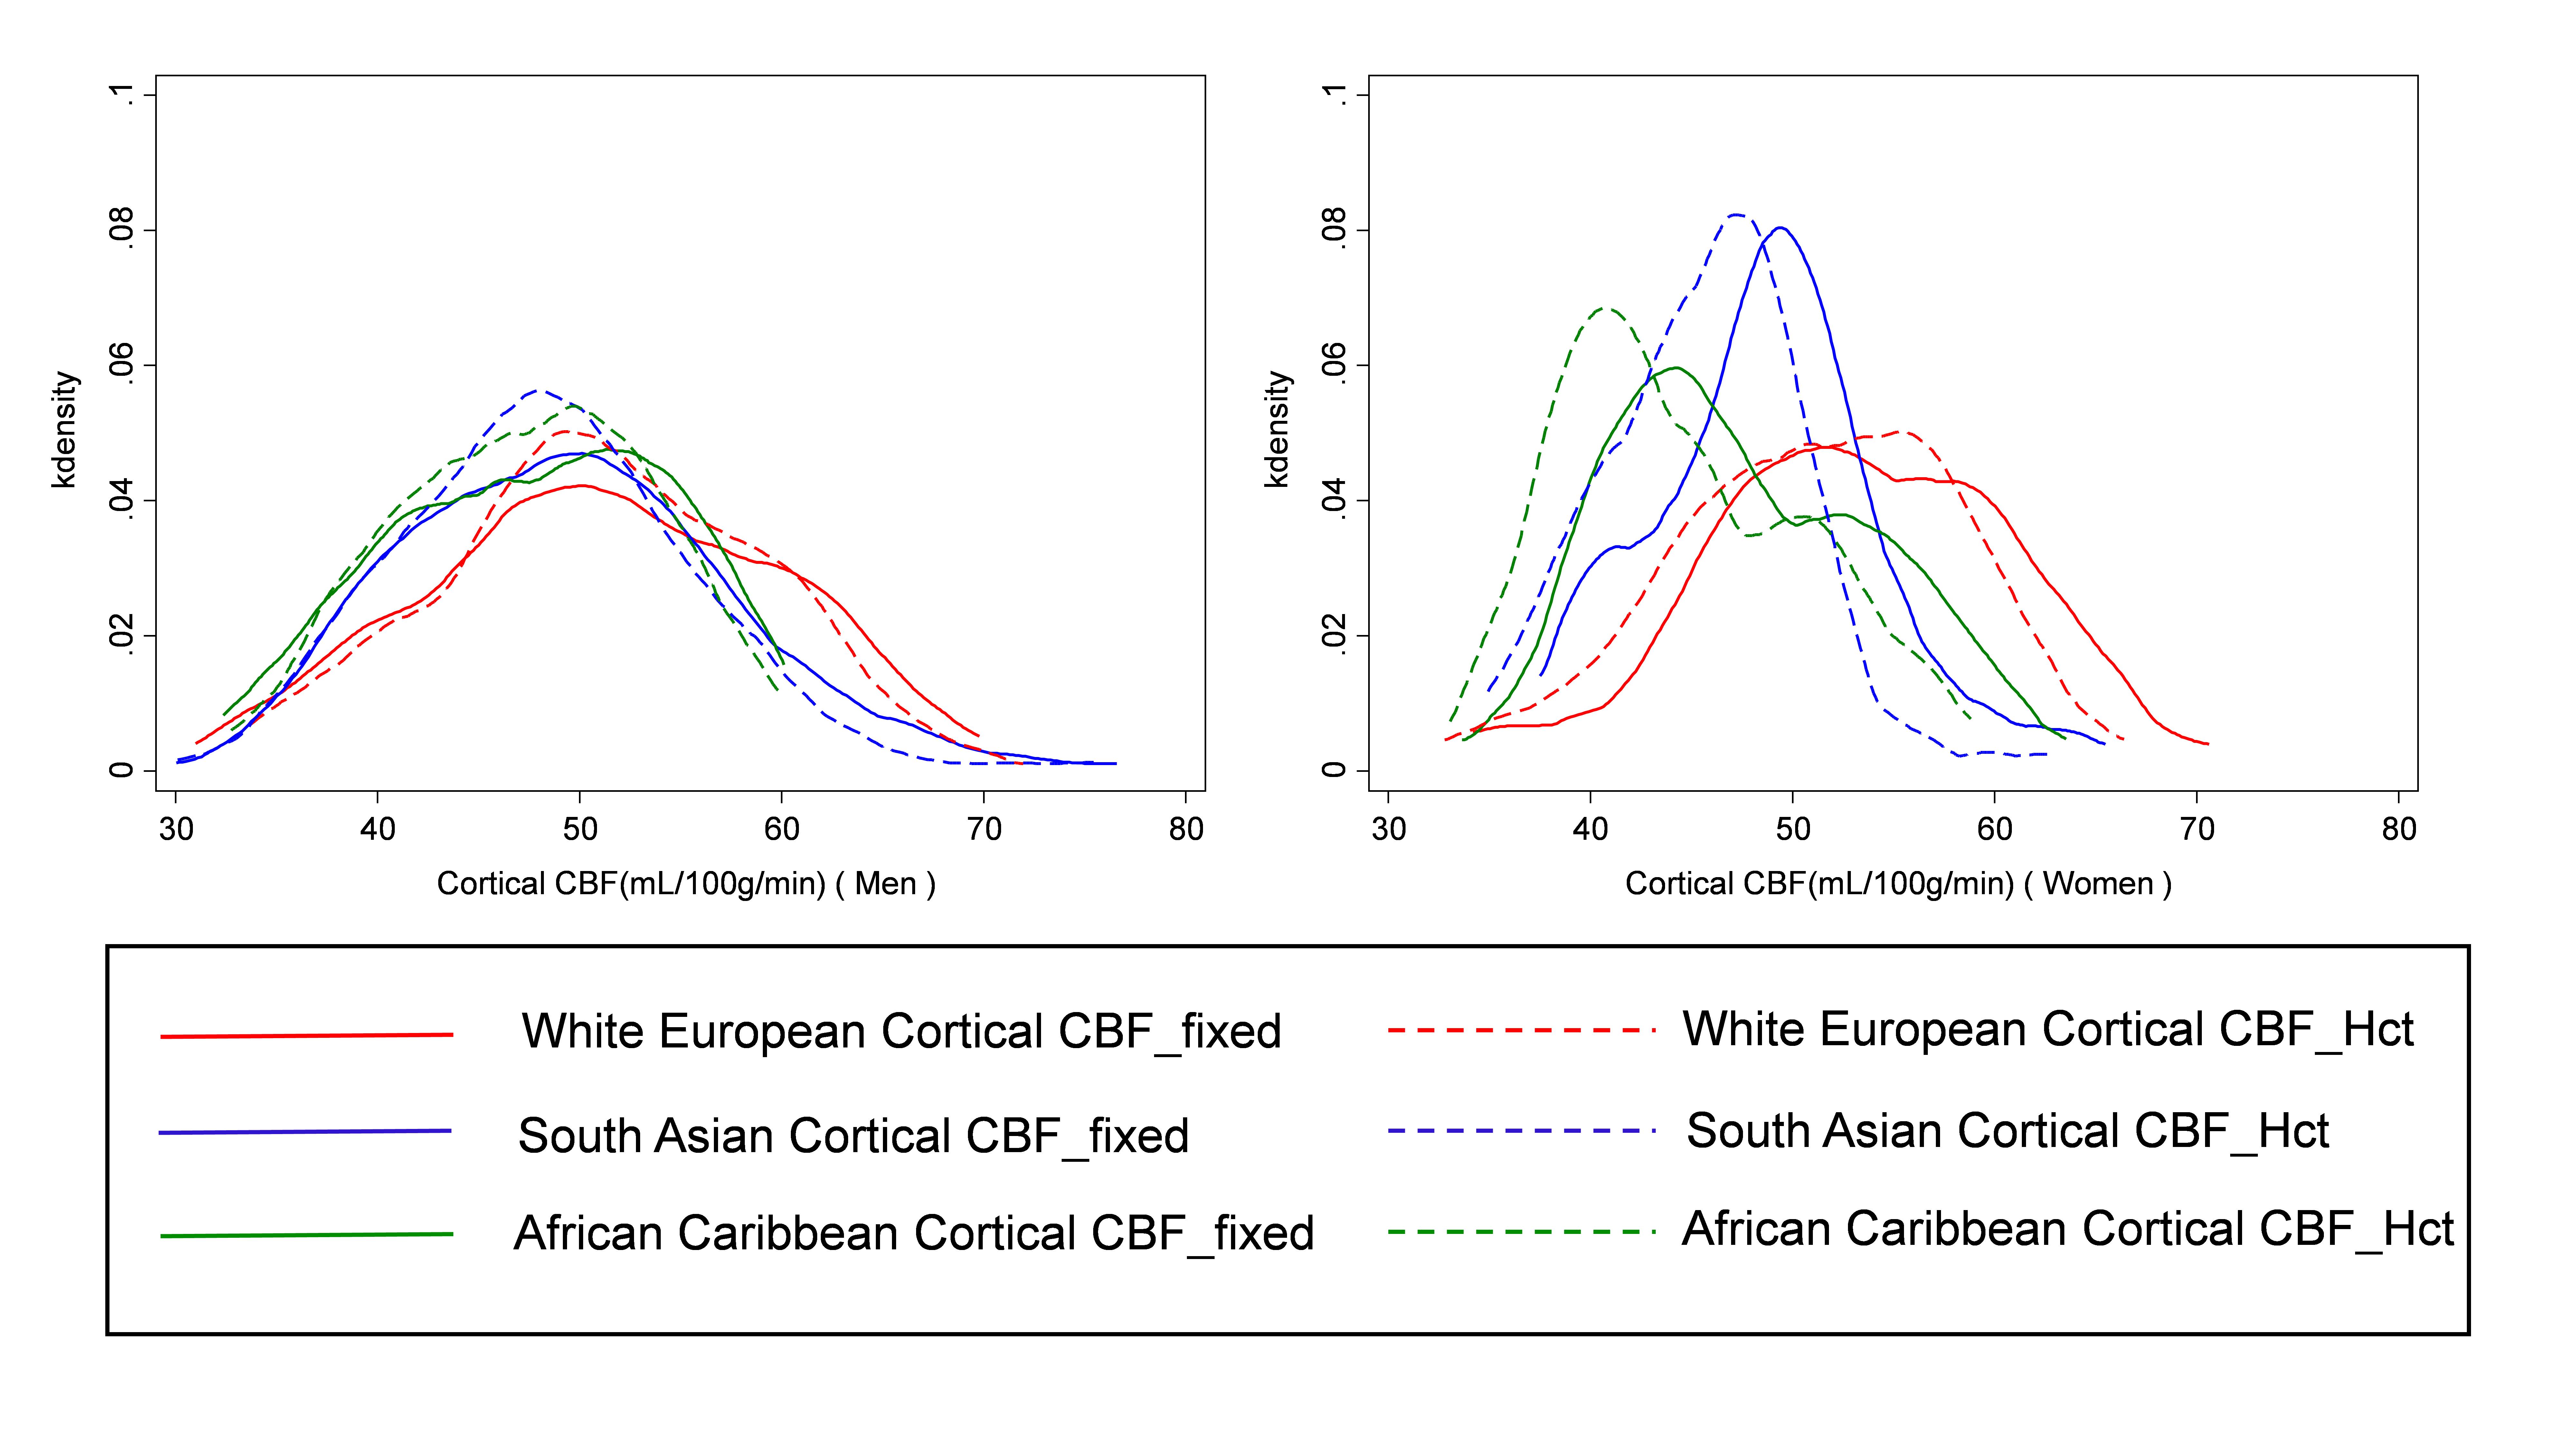
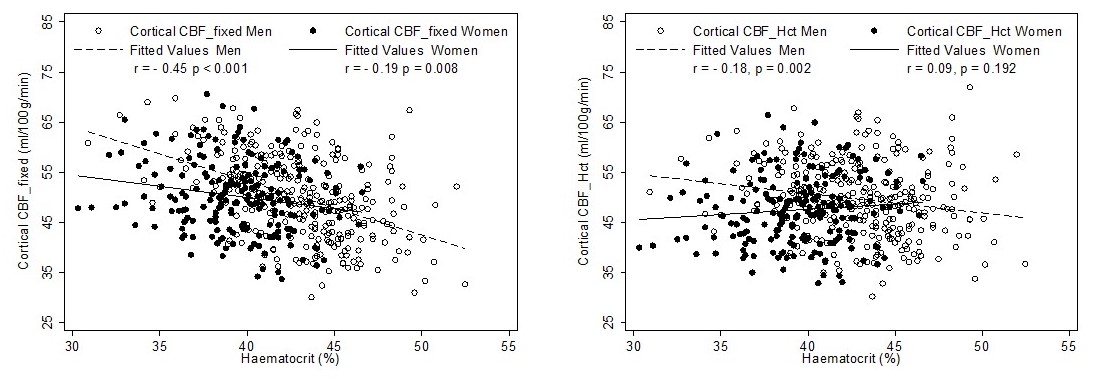
Results are shown in Table 1. The mean (SD) Hct level in men was 43.0% (±3.5), and in women was 39.6% (±3.0). CBF modelling with individual Hct adjustment decreased CBF estimates in all ethnic and sex categories except white European men. The decrease for women was - 2.7 mL/100g/min (p<0.001, 95% confidence interval (CI) -3.0, - 2.4 mL/100g/min). The size of this effect differed by ethnicity with estimated perfusion in South Asian women found to be lower by – 3.0 mL/100g/min (p<0.001, 95% CI -3.6, - 2.5 mL/100g/min), and African Caribbean women by -3.1 mL/100g/min (p<0.001, CI -3.6, -2.5 mL/100g/min). Example CBF_fixed and CBF_Hct maps are shown in Figure 1 for a woman with Hct of 37.5%. Correction for individual Hct altered sample frequency distributions of CBF values, especially in non-European ethnicity women (Figure 2). Figure 3 demonstrates the inverse linear relationship of Hct with CBF_fixed and CBF_HCT models. This relationship is reduced with use of the CBF_Hct model although some association of Hct with CBF in men remained (r = - 0.18, P = .002). Further adjustment for potential confounders of mean arterial blood pressure, Body Mass Index, diabetes and dyslipidemia did not affect this relationship when entered in a regression model (β= -0.3, P = .020, CI -0.6, -.05 mL/100g/min).Discussion
This study has shown that Hct levels differ according to sex and ethnicity and this influences CBF estimated from ASL. Our findings suggest that research studies using ASL to measure CBF should routinely measure Hct and adjust T1blood accordingly. Further research is warranted into whether adjustment of the Hct value in CBF models to accommodate demographic differences provides stronger associations with cerebrovascular disease, dementia and cognitive decline than previous models using a fixed mean Hct value. Such an approach may improve early risk assessment in ethnic groupsConclusion
Studies of elderly populations using ASL to estimate CBF, uncorrected for the influence of an inappropriate fixed Hct mean to set the value of T1 blood, may lead to systematic underestimation of risk of the neurodegenerative diseases of old age when CBF is used as a biomarker. Whenever possible, individualised measures of Hct should be included in ASL derived estimates of CBF.Acknowledgements
Data used in preparation of this abstract were obtained from the SABRE Study (www.sabrestudy.org) The SABRE study has received funding from the British Heart Foundation, Diabetes UK, the Medical Research Council and the Wellcome Trust. The current visit (visit 3) was funded by the British Heart Foundation (CS/13/1/30327).
FB is supported by the NIHR biomedical research centre at UCLH.
DO is supported by the EPSRC-funded UCL Centre for Doctoral Training in Medical Imaging (EP/L016478/1) and the Wolfson Foundation.
References
1. Bastos-Leite, A.J., et al., Cerebral blood flow by using pulsed arterial spin-labeling in elderly subjects with white matter hyperintensities. AJNR Am J Neuroradiol, 2008. 29(7): p. 1296-1301.
2. Leeuwis, A.E., et al., Lower cerebral blood flow is associated with impairment in multiple cognitive domains in Alzheimer's disease. Alzheimers Dement, 2016: p. 531-540.
3. Benedictus, M.R., et al., Lower cerebral blood flow is associated with faster cognitive decline in Alzheimer's disease. Eur Radiol, 2017. 27(3): p. 1169-1175.
4. Binnewijzend, M.A., et al., Cerebral perfusion in the predementia stages of Alzheimer's disease. Eur Radiol, 2016. 26(2): p. 506-514.
5. Alsop, D.C., et al., Recommended implementation of arterial spin-labeled perfusion MRI for clinical applications: A consensus of the ISMRM perfusion study group and the European consortium for ASL in dementia. Magn Reson Med, 2014.
6. Lu, H., et al., Determining the longitudinal relaxation time (T1) of blood at 3.0 Tesla. Magn Reson Med, 2004. 52(3): p. 679-682.
7. de Simone, G., et al., Relation of blood viscosity to demographic and physiologic variables and to cardiovascular risk factors in apparently normal adults. Circulation, 1990. 81(1): p. 107-117.
8. McDonough, J., G. Garrison, and C. Hames, Blood pressure and hypertensive disease among negroes and whites: a study in Evans County, Georgia. Annals of Internal Medicine, 1964. 61(2): p. 208-228.
9. Cheng, C.K., et al., Complete blood count reference interval diagrams derived from NHANES III: stratification by age, sex, and race. Lab Hematol, 2004.10(1): p. 42-53.
10. Cardoso, M.J., et al., Geodesic Information Flows: Spatially-Variant Graphs and Their Application to Segmentation and Fusion. IEEE Trans Med Imaging, 2015. 34(9): p. 1976-1988.
11. Asllani, I., A.
Borogovac, and T.R. Brown, Regression
algorithm correcting for partial volume effects in arterial spin labeling MRI.
Magn Reson Med, 2008. 60(6): p.
1362-1371.
Figures
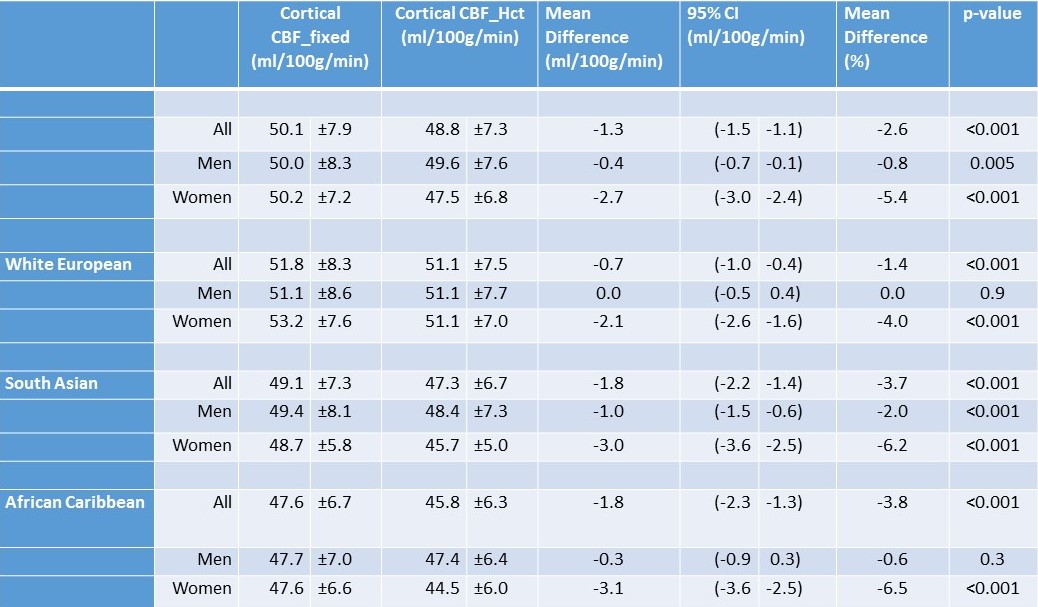
Data are mean ±standard deviation, except mean difference (%). P- values were calculated using a paired Student’s t-test, 95% confidence interval (CI)
Table 1: Comparison of cerebral blood flow estimated using a fixed haematocrit value (43.5%) (CBF_fixed),and using correction for individual haemtocrit (CBF_Hct ) by sex and ethnicity.