3767
Brain Structural Connectome Accurately Classifies Alzheimer’s Disease Related Dementia1Department of Psychiatry, Columbia University, New York, NY, United States, 2Computational Science Initiative, Brookhaven National Laboratory, Upton, NY, United States, 3Brookhaven National Laboratory, Upton, NY, United States, 4National Health Insurance Service Ilsan Hospital, Ilsan, Republic of Korea
Synopsis
There is an urgent, unmet need for biomarkers of risk for Alzheimer’s disease related dementia (ADRD) suitable for routine examination in naïve patients. Studies suggest MRI-derived brain connectome may contain salient information about brain health status. However, it has yet to be tested in sufficiently large samples whether connectome can be used to predict reliably diagnosis of ADRD. Here we performed high-throughput computational analysis using structure and diffusion MRI in a clinical cohort (N=211) to estimate morphometry and connectome. Our results show potential utility of data-driven machine learning models using large-scale MRI-derived brain phenotypes in classifying ADRD, particularly structural connectome.
INTRODUCTION
There is an urgent, unmet need for clinically useful biomarkers of risk for Alzheimer’s disease related dementia (ADRD) based on non-invasive and affordable measures suitable for routine examination in naive patients. Studies have focused on brain MRI-derived markers. Cortical thinning and reduced hippocampal volumes are known for markers for Alzheimer’s disease, but these structural estimates alone are insufficient for implementation at clinics because in terms of accuracy and generalizability (1). With recent advent of robust computational methods to estimate structural connectome, using probabilistic diffusion tractography, there have been questions as to how much the brain’s connectome may contain information about brain health related to ADRD. Here, we tested utility of brain’s structural connectome in classification of Alzheimer’s disease related dementia.METHODS
Participants. We used data from 211 elderly people who visited the dementia clinic at National Health Insurance Service Ilsan Hospital, Ilsan, South Korea from 2009 to 2013. Diagnosis was made by physicians based on history taking, neuropsychological evaluations (seoul neuropyschological screening battery) and MMSE (Mini-Mental State Examination). Participants included 110 with diagnosis of Alzheimer’s disease (AD; median age=82; interquartile intervals (Q3-Q1)=85-77), 64 with mild cognitive impairment (MCI; median age=73; Q3-Q1=77-66), and 37 subjective mild cognitive impairment (SMI; median age=74; Q3-Q1=78-72).
MRI acquisition and analysis. We collected the following multimodal MRI from all participants: T1-weighted anatomical MRI, T2-weighted FLAIR, and diffusion MRI. High-throughput computational analysis was conducted. Firstly, we estimated morphometrics measures using Freesurfer image analysis pipeline (2) (v6) from T1 and FLAIR images. Morphometric measures (N=948 per subject) include volumes of the hippocampal subdivisions, and thickness, surface area, and volume of cortical/subcortical regions. Two different versions of brain atlases were used. Secondly, we estimated structural connectome using the diffusion MRI analysis pipeline, Mrtrix 3 (3). The connectome measures (N= 33,698 per subject) include counts of streamlines, a surrogate measure of structural connectivity (4-6), and mean length of streamlines given any two brain regions based on multiple atlases.
Classification. We built machine learning models using large-scale brain MRI-derived phenotypes to predict AD and MCI, respectively. Logistic regression (L1 regularization) and support vector machine (SVM) was used. For feature selection, we used 'Forests of randomized trees' method, an ensemble method to combine the predictions of base estimators built with a learning algorithm in order to improve generalizability and robustness. Optimal numbers of features were sought based on classification accuracy. Ten-fold cross validation was used.
RESULTS
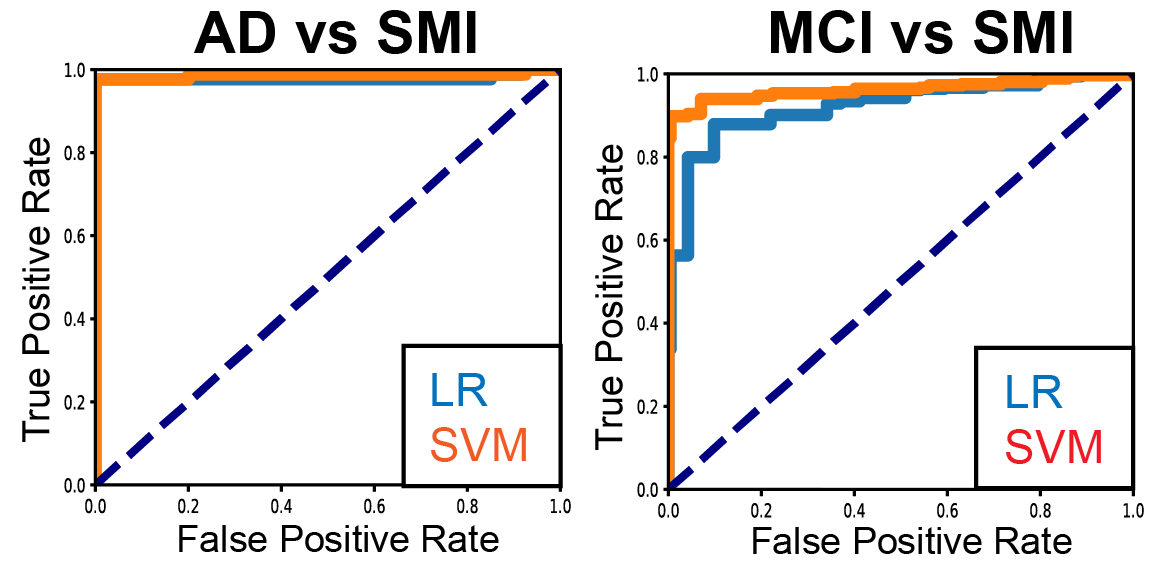
In classification of AD (Alzheimer's disease) vs. SMI (subjective mild cognitive impairment), models based on both morphometric and connectomic estimates showed good classification accuracy (SVM accuracy = 0.98±0.011; LR accuracy=0.97±0.009; ten-fold cross validation). In classification of MCI (mild cognitive impairment), models also showed good classification accuracy (SVM accuracy=0.93±0.05; LR accuracy=0.86±0.042; Figure 1).
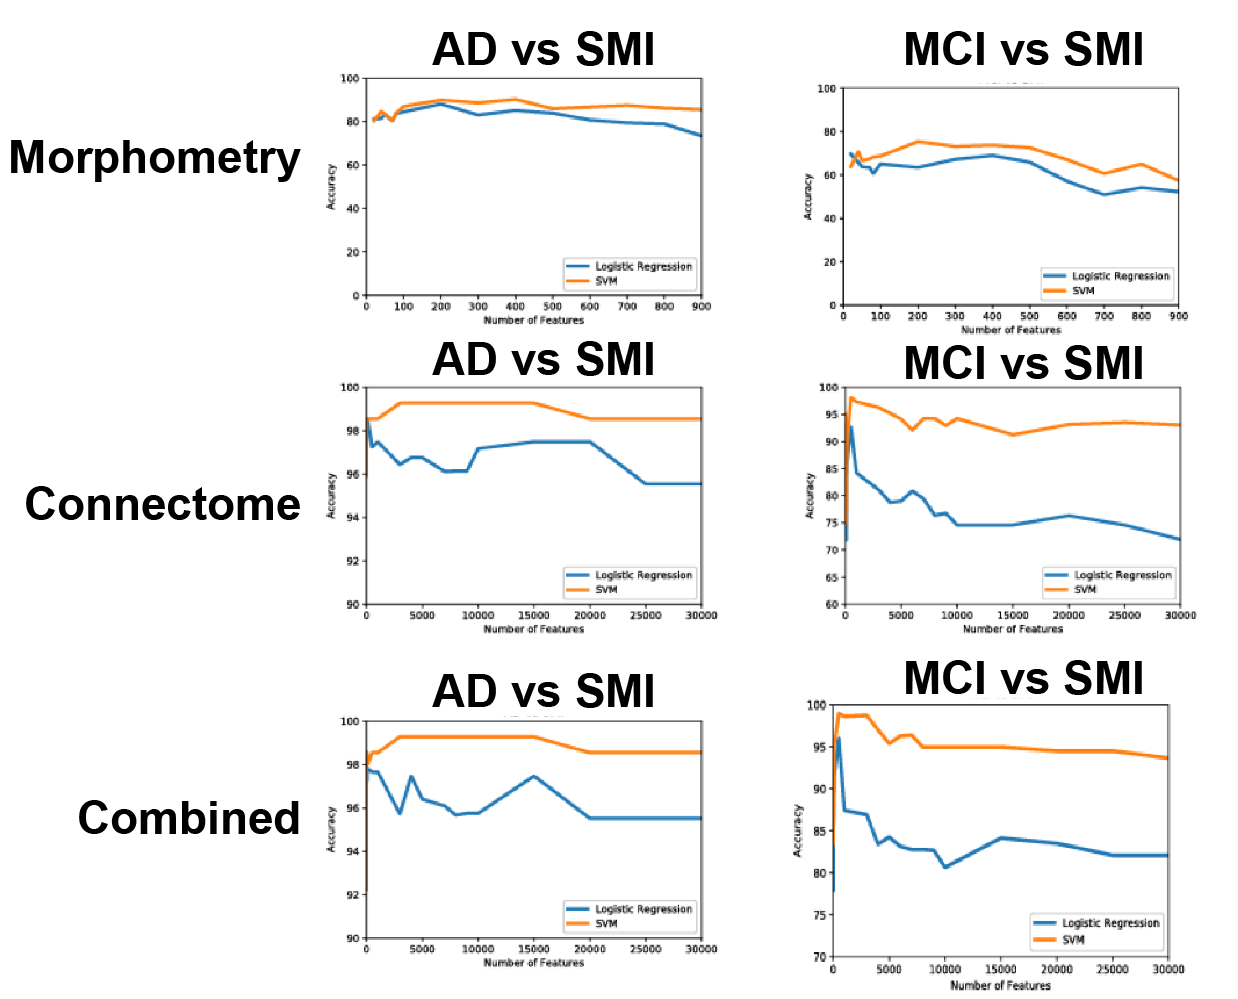
We also compared morphometry- and connectome-based models and testing model performance as a function of numbers of features. In classification of AD, accuracy of the connectome-based model is similar to that of the combined model, significantly outperforming that of morphometry-based model (Figure 2). Likewise, in classification of MCI, classification accuracy of the connectome-based model is similar to that of the combined model, significantly outperforming that of morphometry-based model.
Models with demographic data (age and sex) did not classify AD or MCI above chance.
DISCUSSION
In this study, we showed that large-scale MRI-derived brain phenotypes, including the whole brain morphometric and connectomic estimates, can be used to reliably classify Alzheimer’s disease related dementia. Several aspects should be noted. Firstly, our data represents relatively large cohort at a local clinic. Compared to some of the publicly available imaging databases for AD research, our clinical data may be nosier in terms of confounding (e.g., medication), hence perhaps better represents true clinical populations. Given this, it is surprising to observe such accurate classification for both AD (98%) and MCI (93%). This shows potential clinical utility of the machine learning models using large-scale MRI-derived brain phenotypes in prediction of risk for ADRD. Secondly, compared with the morphometry-based model, the connectome-based model showed significantly more accurate results. This pattern is more pronounced in MCI classification compared with AD classification. This support structural connectome data contains crucial information about brain health status related to ADRD—above and beyond what morphometric measures does.
An important next step is to assign brain structural connectome to pathophysiology of ADRD as well as its trajectory. For example, future research may assess the extents to which structural connectome can be used to predict the course of the disease. This may lead to prospective clinical studies to test clinical utility of connectome-based MRI markers.
Acknowledgements
This work used the Extreme Science and Engineering Discovery Environment Stampede 2 at the Texas Advanced Computing Center (account #: TG-IBN170015) and Argonne National Laboratory Leadership Computing Facility (project name: AD_Brain_Imaging). All codes for machine learning analysis are available in a public repository (https://bitbucket.org/jiookcha/ismrm_2018_connectome_for_ad) as well as in scikit learn (http://scikit-learn.org/stable/modules/ensemble.html#forest)
References
1. S. Teipel et al., Multimodal imaging in Alzheimer's disease: validity and usefulness for early detection. Lancet Neurol 14, 1037-1053 (2015).
2. B. Fischl, FreeSurfer. Neuroimage 62, 774-781 (2012).
3. J. D. Tournier, F. Calamante, D. G. Gadian, A. Connelly, Direct estimation of the fiber orientation density function from diffusion-weighted MRI data using spherical deconvolution. Neuroimage 23, 1176-1185 (2004).
4. J. Cha et al., Effects of Serotonin Transporter Gene Variation on Impulsivity Mediated by Default Mode Network: A Family Study of Depression. Cereb Cortex, 1-11 (2017).
5. J. Cha et al., Abnormal reward circuitry in anorexia nervosa: A longitudinal, multimodal MRI study. Hum Brain Mapp 37, 3835-3846 (2016).
6. J. Cha et al., Neural Correlates of Aggression in Medication-Naive Children with ADHD: Multivariate Analysis of Morphometry and Tractography. Neuropsychopharmacology 40, 1717-1725 (2015).
Figures