3766
Subregional structural alterations in deep gray matter structures in alcohol-dependent patients1Department of Molecular Medicine, Lee Gil Ya Cancer & Diabetes Institute, Incheon, Korea, Democratic People's Republic of
Synopsis
The aim of this study was to investigate whether the volumes of subcortical gray matter structures in alcohol-dependent patients (ADP) are different, and to localize the surface morphometric changes of these subcortical structures. Compared with healthy controls (HC), we found that the bilateral Accu, Hipp, Puta, and Thal showed significant atrophy in ADP. We also revealed that vertex analysis directly can measure localized changes in brain structures that showed significant volumetric change. It might have potential to precisely detect regional alterations of the subcortical gray matter structures.
Introduction
Chronic alcoholics show significant volume loss in brain structures that includes both gray and white matter shrinkage [1]. Previous neuroimaging studies have shown that smaller gray-matter volume is related to alcohol use, but the underlying biologic mechanisms of alcohol-related change in brain remains unclear [2]. Recently, it was reported that alcohol dependence was associated with a bilateral enlargement of the amygdala [3]. They suggested that the structural changes in the brain of alcoholics may result in a functional imbalance, which could lead to impairments of emotional processing and social cognition [4]. However, there is still lack of a systematic investigation of all deep gray structures. The purpose of this study was to investigate whether the volumes of subcortical gray matter structures in alcohol-dependent patients (ADP) are different, and to localize the surface morphometric changes of these subcortical structures.Methods
This study included 42 subjects, 21 male ADP (mean±SD, 51±8.3 years) and 21 healthy control subjects (HC) (mean±SD, 52±8.4 years). MRI scans were performed on a 3T MR scanner (Achieva 3.0T TX, Philips Medical System, Netherlands). MR scans were acquired using a three-dimensional turbo fast echo (3D-TFE) T1-weighted volumetric magnetization-prepared a rapid gradient echo, (TR=6.8 ms, TE=3.1 ms, flip angle=9°, 256x256 acquisition metrix, FOV=25 cm, voxel size=1x1x1.2 mm, 170 slices). All data were processed using FMRIB software Library (FSL, Version 5.0, http://www.fmrib.ox.ac.uk/fsl) [5]. Brain extraction was performed on 3D T1-weighted MR images using Brain Extraction Tool [6]. FMRIB’s Integrated Registration and Segmentation Tool (FIRST) [7] was applied to perform the segmentation and to measure volumes and vertexes in seven deep gray matter structures bilaterally, including putamen (Puta), pallidum (Pall), thalamus (Thal), amygdala (Amyg), hippocampus (Hipp), caudate nucleus (Caud), and nucleus accumbens (Accu). To carry out the vertex analysis, we used FSL tools, generalized linear model to design the statistical matrix and randomize to perform permutation inference. Statistical analysis was performed using IBM SPSS Statistics 23 (IBM Corporation Software Group, Somers, USA). The independent sample t-test was used to investigate the differences between ADP and HC groups.Results
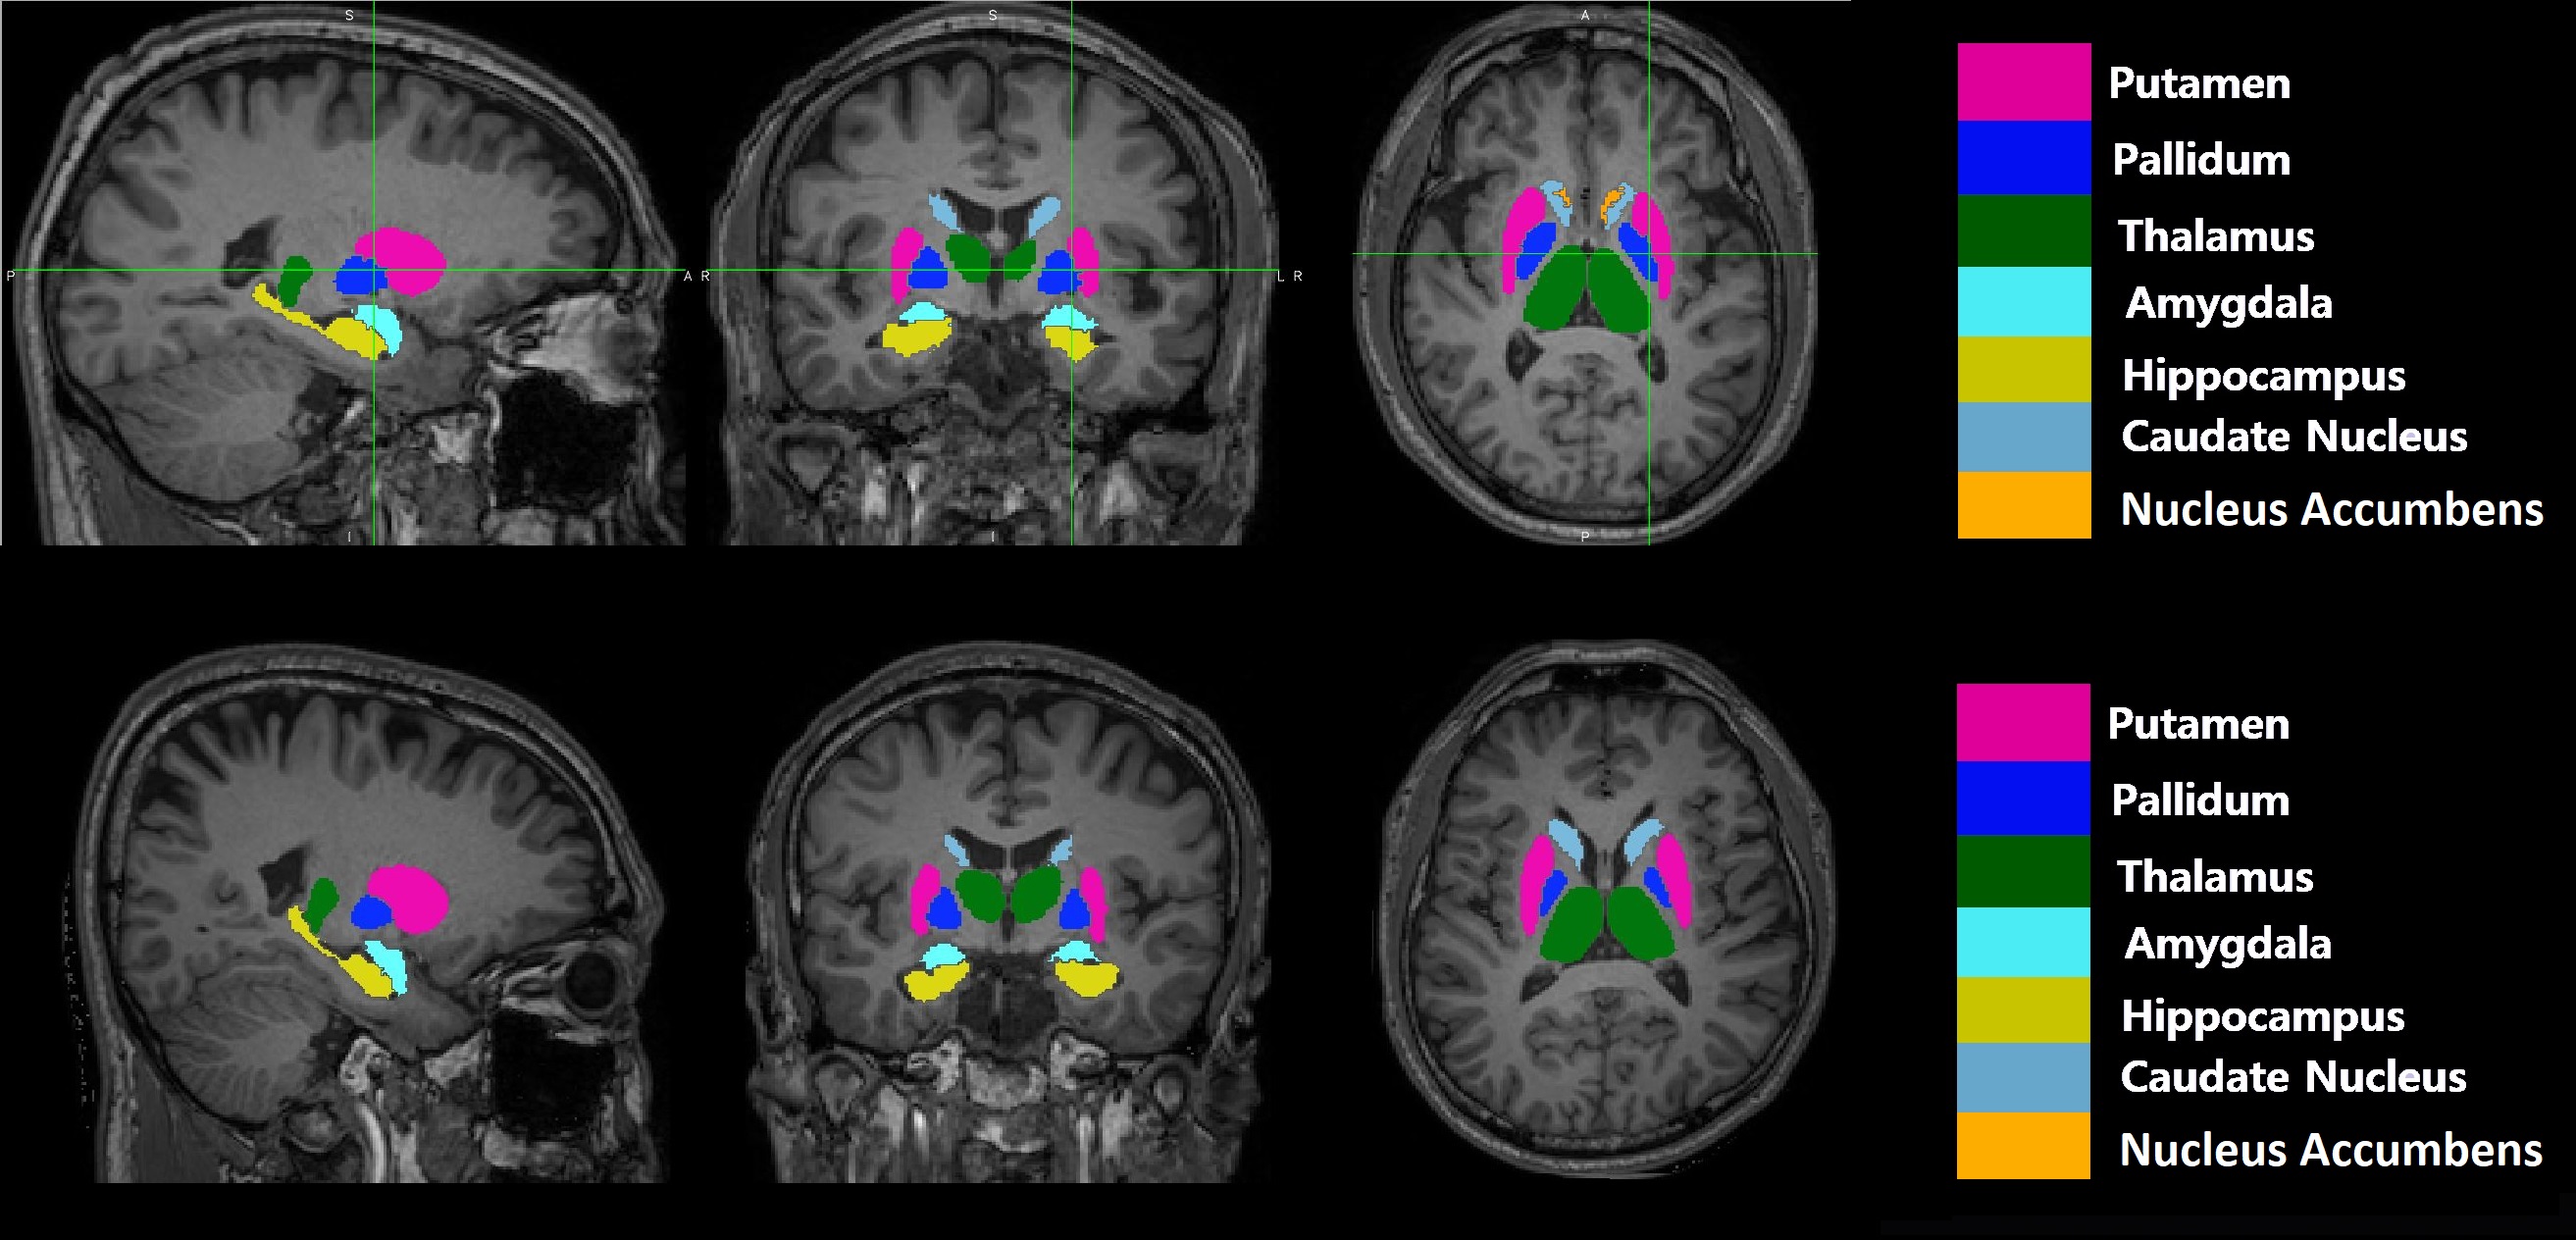
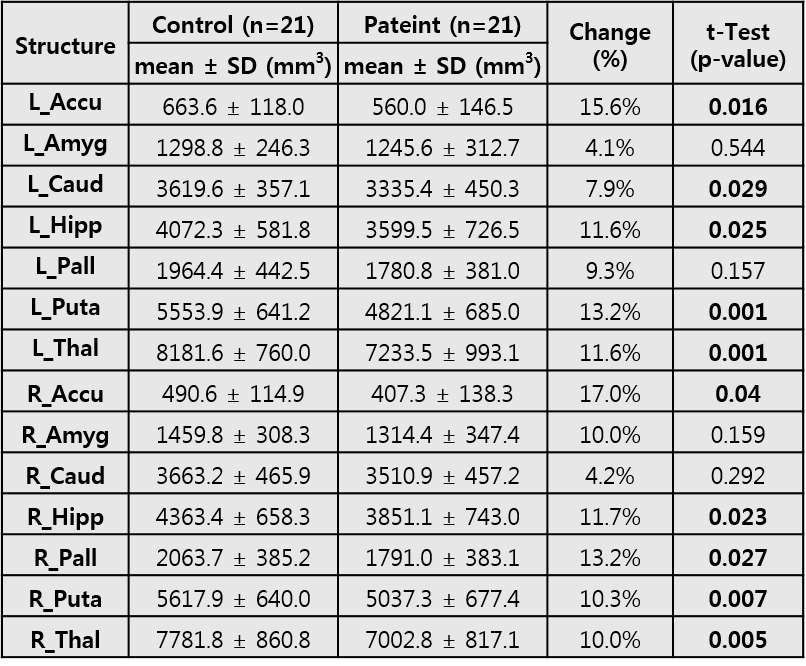
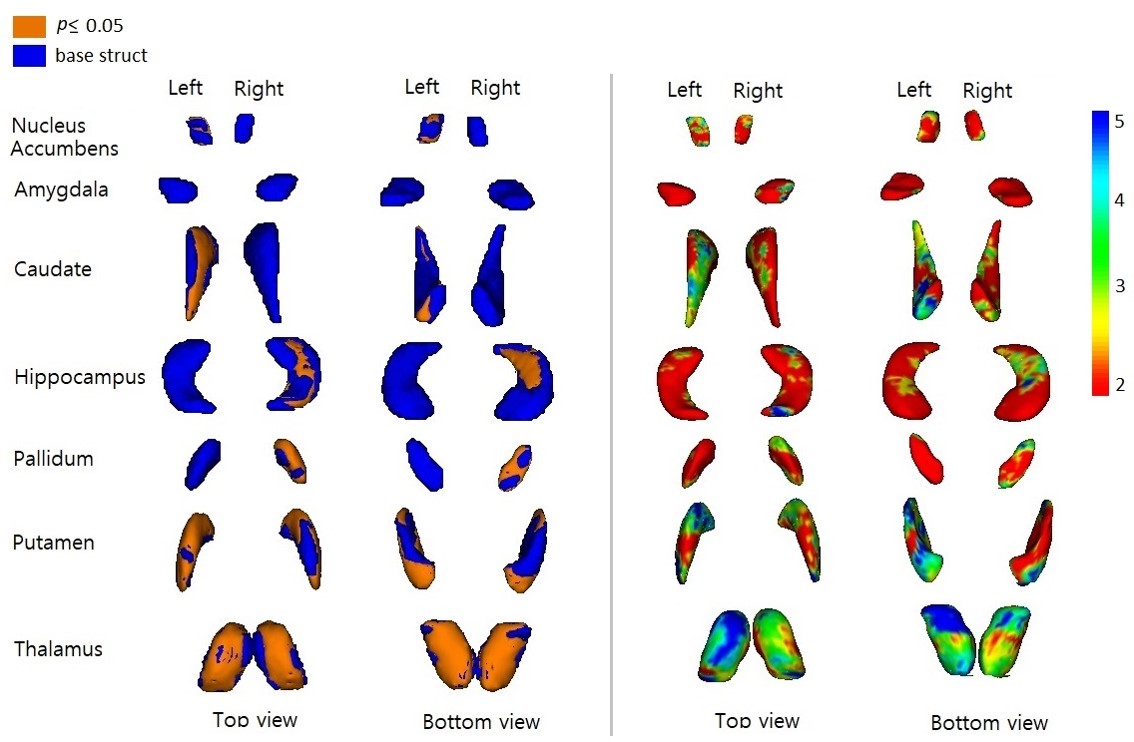
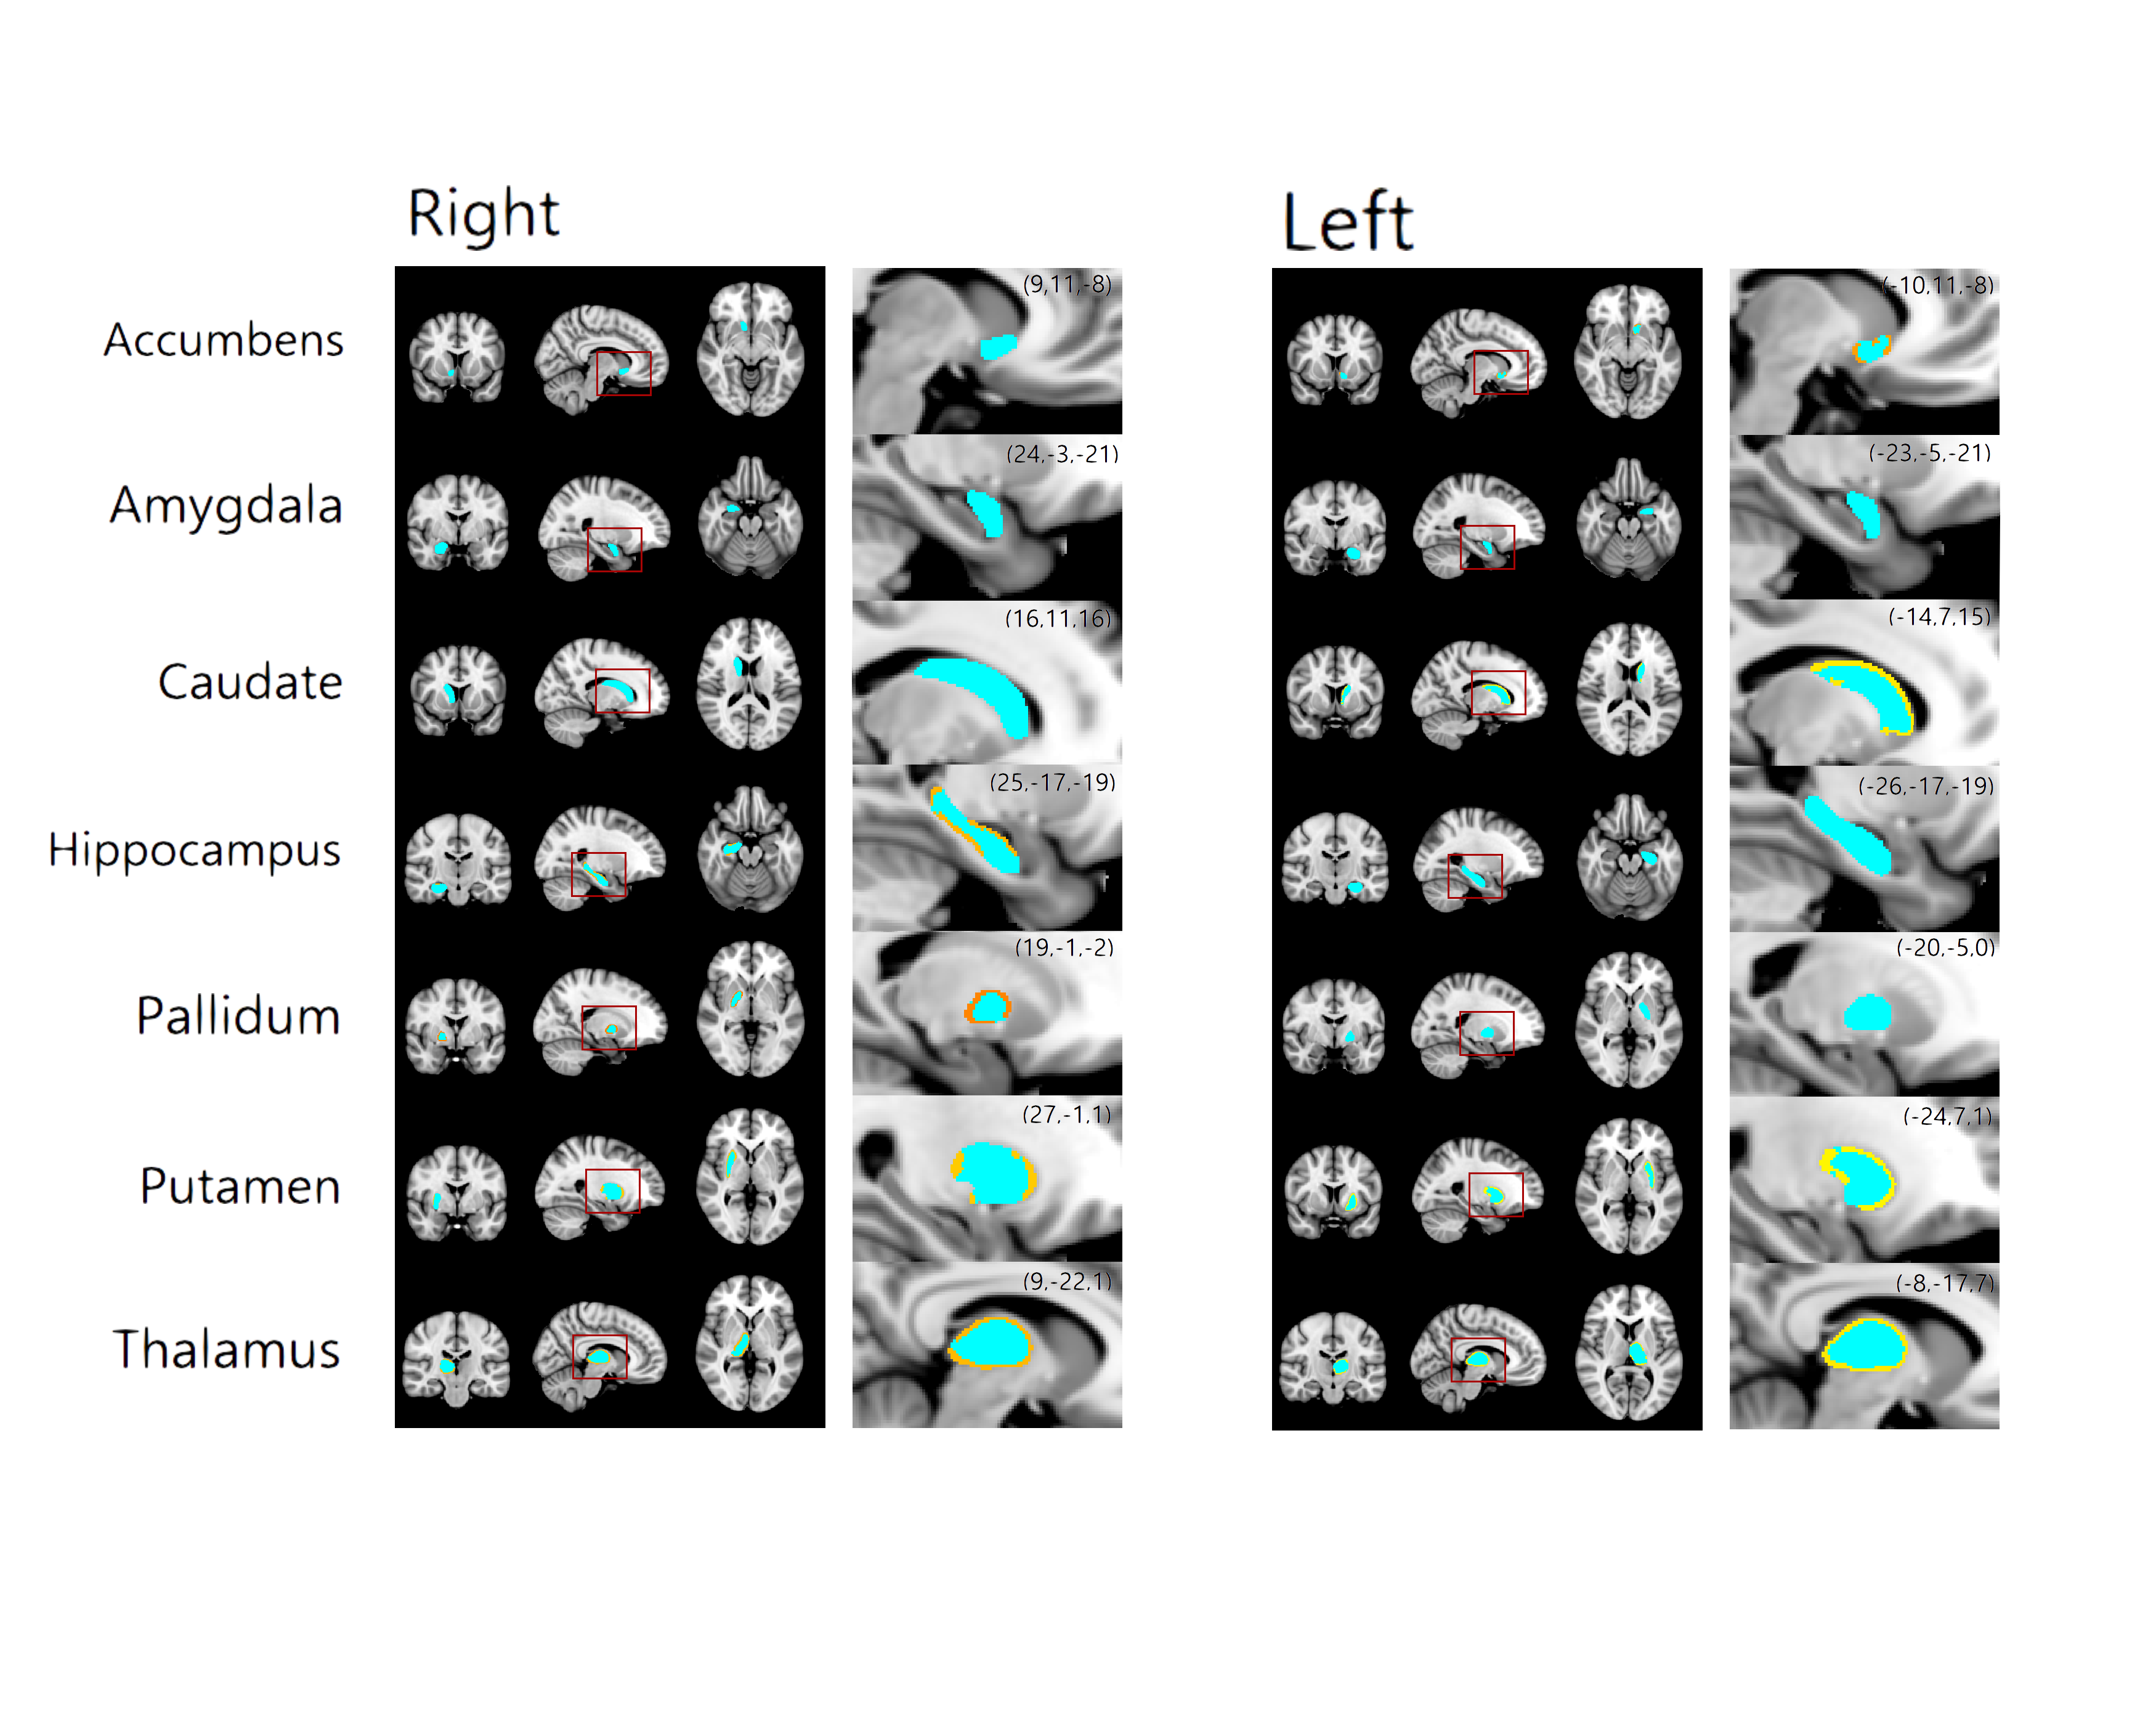
The flowchart of image processing is shown in Figure 1. Figure 2 shows representative T1-weighted MR image (axial, coronal, and sagittal sections), indicating the deep gray matter regions segmented (Top, HC; bottom, ADP patient). Group-wise differences in volumes of the deep gray matter structure are displayed in Table 1. Volumes of bilateral Accu, Hipp, Puta and Thal were smaller in ADP, compared to HC group (L_Accu: p=0.016, R_Accu: p=0.04; L_Hipp: p=0.025, R_Hipp: p=0.023; L_Puta: p=0.001, R_Puta: p=0.007; L_Thal: p=0.001, R_Thal: p=0.005). ADP had smaller left Caud (p=0.029) and right Pall (p=0.027) volumes, compared to the HC group. However, the volume of Amyg did not show significant difference between the two groups (L_Amyg: p=0.544, R_Amyg: p=0.159). Figure 3 shows the results from vertex analysis that show the significant shape abnormalities within deep gray matter structures (p£0.05). In vertex-wise analysis, ADP had significant surface reduction of their bilateral Puta and Thal. Only shape alterations in the R_Hipp, R_Pall, L_Caud, and L_Accu were found in ADP, compared to HC group. The location of shape abnormalities using MNI coordinates of colored in yellow is shown in Figure 4.Discussion
We demonstrated that alcohol use is associated with subregional structural alterations in deep gray matter structures in ADP patients. Compared with HC, we found that among all several pairs of structures, the bilateral Accu, Hipp, Puta, and Thal showed significant atrophy in ADP. These results suggest that the atrophy of these four subregions may be associated with clinical impairment in ADP patients, which might be useful in diagnosis, evaluation and management of ADP. Recently, Lee et al., [8] found that alcohol group had a lower total hippocampus volume, specifically in the left presubiculum, fimbria, and bilateral subiculum. They suggested that alcohol dependence alters hippocampal subfield volumes. In addition, the volume of bilateral Amyg did not significantly decrease in ADP patients, but the significant atrophy was observed in the right Amyg by using surface analysis. The results imply that the surface analysis could provide additional information for volume comparison in finding the pathological progress.Conclusion
Our study shows that atrophy of deep gray matter structures in ADP patients occurs at subregional level even when the volume of the whole given structure is not reduced. We also revealed that vertex analysis directly can measure localized changes in brain structures that showed significant volumetric change. It might have potential to precisely detect regional alterations of the subcortical gray matter structures.Acknowledgements
This work was supported by Grants (#2017-5138) from the National Research Foundation (NRF) funded by the Ministry of Science and ICT of Korea.References
[1] Mollie AM, Scott T, Ronald AY, et al. White matter volume in alcohol use disorders: a meta-analysis. Addition Biology 2013;18:581-592.
[2] McQueeny T, Schweinsburg BC, Schweinsburg AD, et al. Altered white matter integrity in adolescent binge drinkers. Alcohol Clin Exp Res. 2009;33:1278-1285.
[3] Antonio G, Luca S, Valentina T, et al. Age-related changes in grey and white matter structure througout adulthood. Neuroimage 2010;51:943-951.
[4] Vladimir VS, Ruslan D, Claire L, et al. Reduced anterior insula, enlarged amygdala in alcoholism and associated depleted von Economo neurons. Brain 2015; 138:69-79.
[5] Smith SM, Jenkinson M, Woolrich MW, et al. Advances in functional and structural MR image analysis and implementation as FSL. Neuroimage 2014;23:208-219.
[6] Smith SM. Fast robust automated brain extraction. Hum Brain Mapp. 2002;17:143-155.
[7] Patenaude B, Smith SM, Kennedy DN, et al. A Bayesian model of shape and appearance for subcortical brain segmentation. NeuroImage 2011;56:907-922.
[8] Lee J, Im SJ, Lee SG, et al. Volume of hippocampal subfields in patients with alcohol dependence. Psychiatry Research 2016;258:16-22.
Figures