3765
The Application of NODDI in Characterizing Brain Microstructural Changes in Type 2 Diabetes with Cognitive Impairment1Radiology, Tongji Hospital, Tongji Medical College, Huazhong University of Science and Technology, Wuhan, China, 2Neurology, Tongji Hospital, Tongji Medical College, Huazhong University of Science and Technology, Wuhan, China, 3GE Healthcare, Beijing, China
Synopsis
This study aims to investigate brain microstructural changes in white-matter and gray-matter of type 2 diabetes mellitus(T2DM) patients using the NODDI model. Thirty-three T2DM patients were divided into two sub-groups (impaired and normal cognition), together with ten healthy controls, were imaged at a 3T scanner. It was found that the T2DM patients with cognitive impairment had a lower ICVF value compared to healthy controls in WM regions and the thalamus. Decreased ICVF values in the genu of corpus callosum were correlated with HbA1c level. The NODDI model shows potential feasibility in characterizing brain microstructural alterations for patients with T2DM.
Introduction/Purpose
The Type 2 diabetes mellitus (T2DM) is a prevalent disease which has considerably higher risk of developing cognitive impairment.1 Previous Diffusion Tensor Imaging (DTI) studies have observed widespread white-matter (WM) integrity changes in several important regions and the correlation with neuropsychological function.2,3 However, although can provide sensitivity to tissue microstructures, DTI lacks specificity for individual tissue microstructure features, such as neurite density and orientation dispersions.4 Recently, a novel diffusion MRI technique, termed NODDI (Neurite Orientation Dispersion and Density Imaging), has been investigated to mapping the microstructural complexity of neurites. This multi-compartment model separates the signal from extra- and intra-axonal compartments in each voxel, and provides Intracellular Volume Fraction (ICVF) and neurite Orientation Dispersion (Odi) estimates.4,5 It has been widely used in neurological diseases.4-6 The purpose of this study is to characterize brain microstructural alterations of T2DM patients with or without cognitive impairment using the NODDI model.Methods
Subjects: With the approval of the Institutional Review Board, 17 T2DM patients with cognitive impairment (DM-MCI group), 16 age and gender matched T2DM patients with normal cognition (DM-NC group), and 10 euglycemic healthy controls were enrolled in this study. The diagnostic criteria of T2DM was based on American Diabetes Association. A battery of neuropsychological tests (Montreal Cognitive Assessment, Mini-Mental State Examination, Trail Making Tests, Auditory Verbal Learning Test, Hachinski test, and Activity of Daily Living test) were performed at first. The inclusion criteria for the DM-MCI group were: 1) memory decline; 2) both Montreal Cognitive Assessment and Mini-Mental State Examination scores ≤ 27. Plasma fasting/postprandial glucose and Glycated hemoglobin A1c (HbA1c) were also recorded. Imaging and data processing: All MRI data were acquired on a 3 Tesla scanner (Discovery MR750, GE Health Care, Waukesha, Wisconsin, USA) equipped with a 32-channel head coil. Axial common two-shell DWI images were obtained for further NODDI analysis using a single-shot SE-EPI sequence with the following parameters: TR/TE = 5000/98ms, FOV = 24×24cm2, matrix size = 128×128, slice thickness = 4 mm, slice spacing = 0, slice number = 46, NEX = 1, two shells are b = 1250 and 2500 s/mm2, diffusion encoding direction is 25 for each shell. The ICVF and Odi maps were derived using NODDI toolbox based on Matlab.7 FMRIB Software Library with tract-based spatial statistics (TBSS) was utilized to analyze the between-group differences of ICVF and Odi within multiple white-matter (WM) regions. ROI-based analysis was utilized to compare these metrics in bilateral thalamus as a representative of gray-matter (GM) nucleus. The ICVF and Odi values of bilateral thalamus and some WM regions (gene of corpus callosum and corona radiata) were measured and averaged for further analysis using ImageJ. A series of Mann-Whitney U-tests were used to assess the difference between each two groups. Pearson’s correlation between ICVF value and disease duration/HbA1c level was also performed. All statistical analysis procedures were conducted using SPSS software (SPSS Inc., Chicago, IL).Results
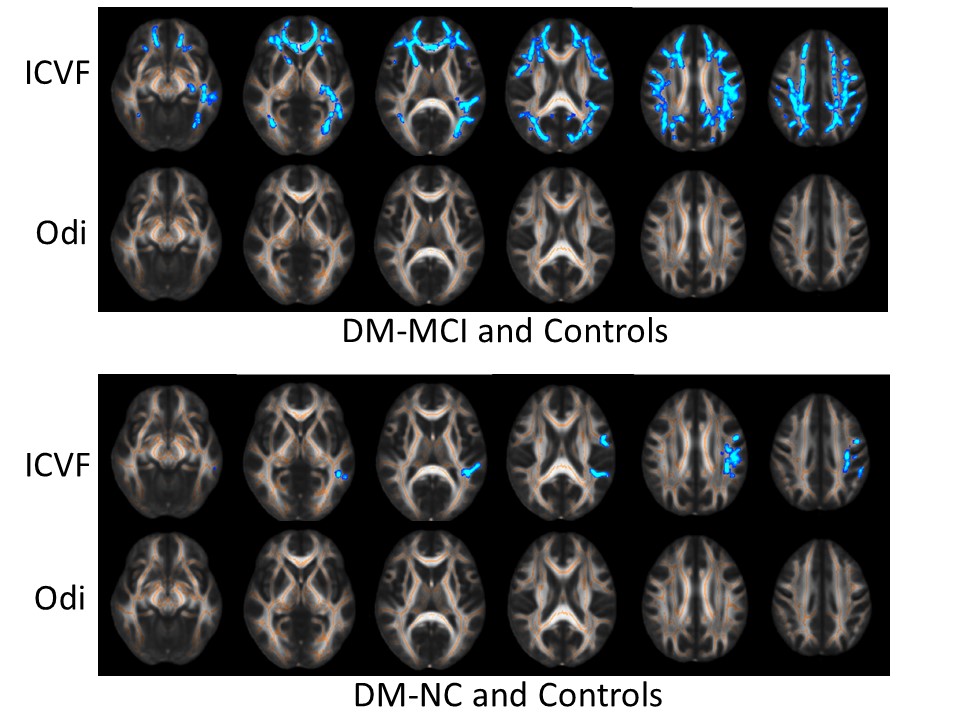
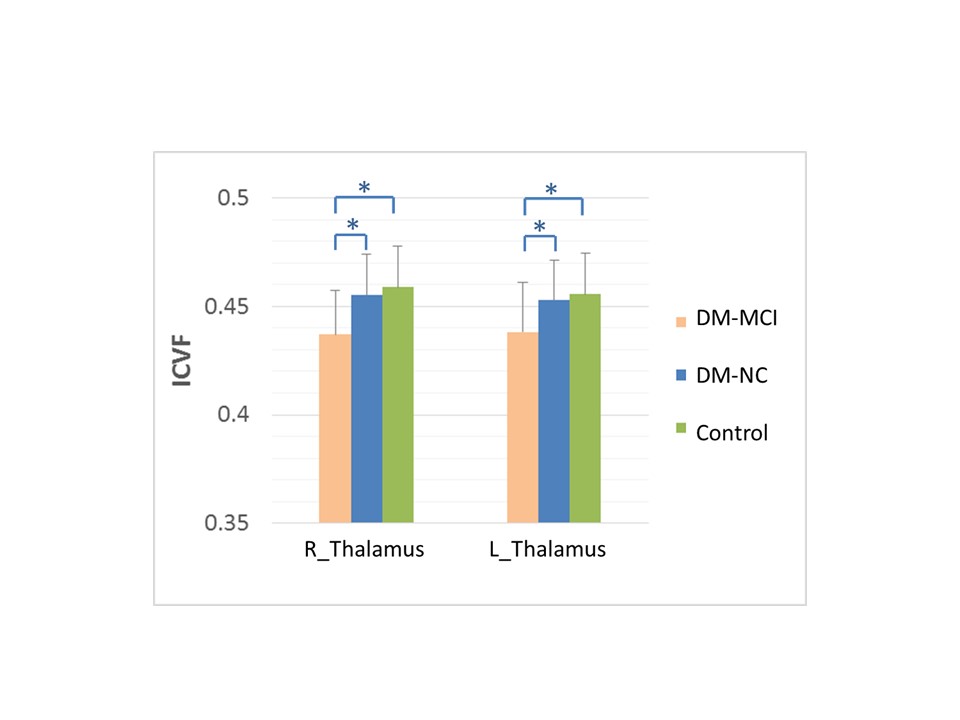
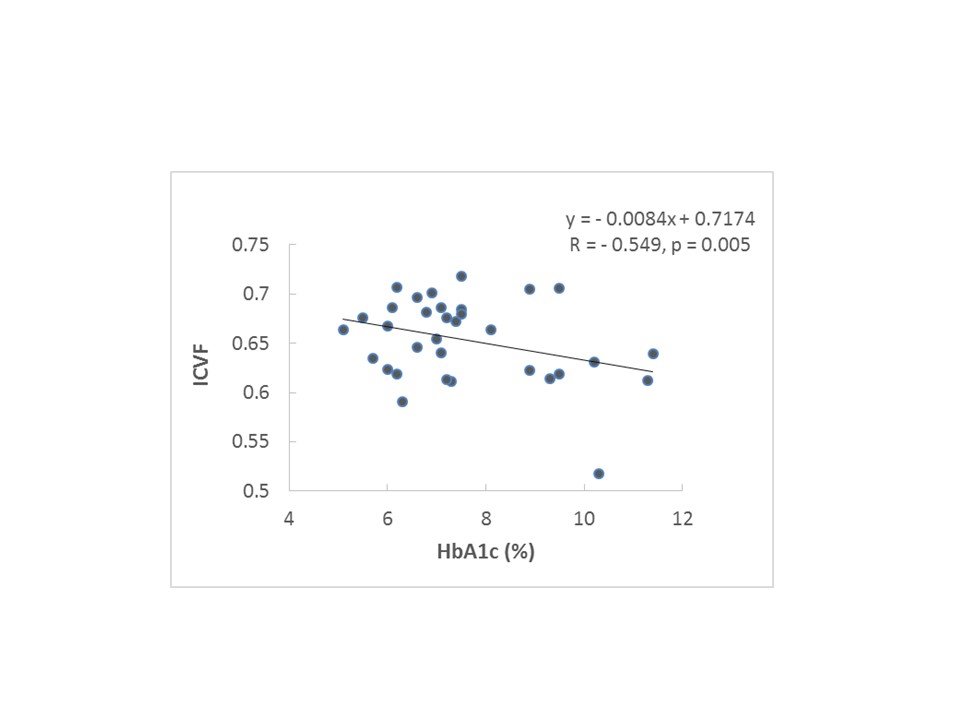
The ICVF and Odi maps of typical subjects for each group were shown in Fig.1. Compared with the healthy controls, the DM-MCI and DM-NC groups exhibited decreased ICVF in 17.2% (23685/137832 voxels) and 1.5% (2013/137832 voxels) of WM regions respectively (p<0.05). However, the angular variation of neurites, characterized by Odi, exhibited no difference between either DM-MCI or DM-NC group and the controls (Fig.2). The pronounced ICVF reduction occurred in the longitudinal fasciculus, corona radiata, and corpus callosum. For GM analysis, ICVF also decreased in bilateral thalamus of DM-MCI group when compared to the DM-NC/control groups (p<0.05 with a Mann-Whitney U-test, Fig.3). This can be related to the decreased density of axons and dendrites, or compromised synapse in these WM regions and thalamus. The microstructural alternations and network disruption are related with slower information processing speed and cognition decline. Decreased ICVF values in the gene of corpus callosum were correlated with HbA1c level (with age as covariate, R=-0.549, p<0.05, Fig.4).Discussion and Conclusions
The reduced ICVF indicated decreased density of axons and dendrites in some important WM regions and the thalamus in T2DM patients with cognitive decline. Such indices of neurites relate more directly to and provide more specific markers of brain tissue microstructure. Our results suggest that NODDI can probe microstructural changes in WM and GM in patients with T2DM, and potentially provide valuable information to study diabetic encephalopathy, including cognitive impairment.Acknowledgements
No acknowledgement found.References
1. McCrimmon RJ, Ryan CM, Frier BM: Diabetes and cognitive dysfunction. Lancet. 2012;379:2291-2299. 2. Hsu J-L, Chen YL, Leu JG, et al. Microstructural white matter abnormalities in type 2 diabetes mellitus: a diffusion tensor imaging study. Neuroimage. 2012;59(2):1098-1105. 3. Zhang J, Wang Y, Wang J, et al. White Matter Integrity Disruptions Associated With Cognitive Impairments in Type 2 Diabetic Patients. Diabetes. 2014;63(11):3596-3605. 4. Winston GP. The potential role of novel diffusion imaging techniques in the understanding and treatment of epilepsy. Quant Imaging Med Surg. 2015;5(2):279-287. 5. Churchill NW, Caverzasi E, Graham SJ, et al. White matter microstructure in athletes with a history of concussion: Comparing diffusion tensor imaging (DTI) and neurite orientation dispersion and density imaging (NODDI). Hum Brain Mapp. 2017;38(8):4201-4211. 6. By S, Xu J, Box BA, et al. Application and evaluation of NODDI in the cervical spinal cord of multiple sclerosis patients. Neuroimage Clin. 2017;15:333-342. 7. Hui Zhang, Schneider T, Wheeler-Kingshott CA, et al. NODDI: practical in vivo neurite orientation dispersion and density imaging of the human brain. Neuroimage, 2012;61(4):1000-1016.Figures
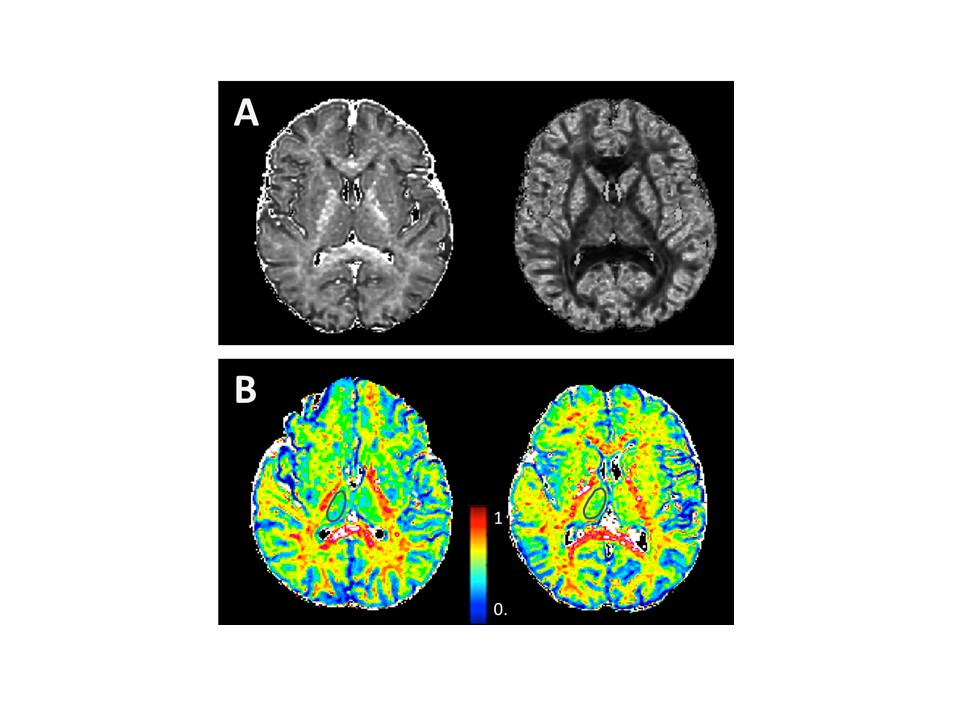
Fig.1 A Typical NODDI-derived maps in a T2DM patient.
B A 65 years old female T2DM patient with cognitive impairment (left) and a 56 years old male T2DM patient with normal cognition (right). The thalamus ROIs was encircled in black line.