3764
Correlation between Apparent Diffusion Coefficient at Ultrahigh b-values and cognitive impairment: a pilot study in early stage Alzheimer’s disease1The First Affiliated Hospital of Wenzhou Medical University, Wenzhou, China
Synopsis
Non-Gaussian diffusion showed the potential to advance the understanding of microstructure alternation in Alzheimer’s disease (AD). Apparent Diffusion Coefficient at Ultrahigh b-values (ADC_uh) demonstrated improved sensitivity to white matter degeneration in AD. In this study we compared the quantitative change of diffusion characteristics including conventional ADC, Diffusion Kurtosis Imaging (DKI), and ADC_uh. Moreover the correlation between diffusion characteristic and cognitive impairment was investigated. The results of this pilot study showed a close link between ADC_uh in left thalamus and cognitive impairment in AD patients. But further study with larger sample size is required to draw a clear conclusion.
Abstract
Introduction
Alzheimer’s disease (AD) is a progressive neurodegenerative disease. Varied non-Gaussian diffusion models show potential to aid in the understanding of microstructure alternations in AD. Correlations between microstructure alterations and severity of cognitive deficiency in AD was demonstrated using Diffusional Kurtosis Imaging (DKI) (1). Apparent Diffusion Coefficient from Ultra-high b-values (ADC_uh), which might be link to the expression of aquaporin-4 (AQP4), showed improved sensitivity to white matter degeneration in AD(2). The purpose of this study is to evaluate the correlation between ADC_uh and cognitive impairment in early stage of AD patients. In addition, conventional ADC and DKI were compared as well.
Material and Methods
Nine early stage AD patients and 6 healthy control (HC) participated in this study with a signed consent. All MR scans were performed at 3.0T Philips Achieva system with body coil transmission and 8-channel head coil reception. DWI was acquired with a single-shot Spin-echo EPI sequence with following parameters: TE/TR=113/8000ms, FOV=220*220mm2, matrix=124*120, reconstruction=256*256, slice thickness=5.0mm without gap, No. of slices=25, SENSE=2.0, 14 b-values=0, 25, 50, 75, 100, 150, 200, 500, 800, 1000, 2000, 3000, 4000, 5000s/mm2, scan time=5min36sec. Proton Density Weighted imaging (PDWI) was acquired for anatomical reference with geometrical setting identical to DWI.
DWI data was pre-processed for brain extraction and motion correction in FSL. All parametric maps were generated using home-developed programming in Matlab (The MathWorks Inc., Natick, MA, USA). ADC was calculated with monoexponential fitting of signal intensities over b-values=0, 200, 500, 800, 1000 s/mm2. ADC_uh was calculated with monoexponential fitting of signal intensities over b-values=2000, 3000, 4000, 5000 s/mm2(3). For DKI, signal intensities over all b-values were used for fitting (4).
S(b)=S(0)∙exp(−b∙Dk+1/6∙b2∙Dk2∙K)
Where S(b) is the signal intensity, S(0) is the signal intensity at b=0, Dk is diffusion coefficient, K quantifies the deviation of the dispersion pattern from a Gaussian distribution. Levenberg-Marquardt (LM) algorithm was applied for optimization. The points with unphysiological value (<0) are nulled.
Regions of interest (ROIs) were manually drawn on PDWI in ImageJ (NIH, USA). Six structures (amygdala, hippocampus, thalamus, caudate, globus pallidus, and lateral ventricles) were analyzed(5). Representative PDWI and ADC_uh map with ROIs are shown in Fig 1. The same ROIs were projected to all other parametric maps.
Data is presented as the mean ± STD. Statistics was performed in SPSS (IBM Corp., version 16.0, release 2007). The normality of the data was evaluated. Statistical comparison was performed between AD and healthy control. Correlations between diffusion characteristics and MMSE (Mini-Mental State Examination) were evaluated with Spearman correlation. P≤0.05 was considered significant.
Results
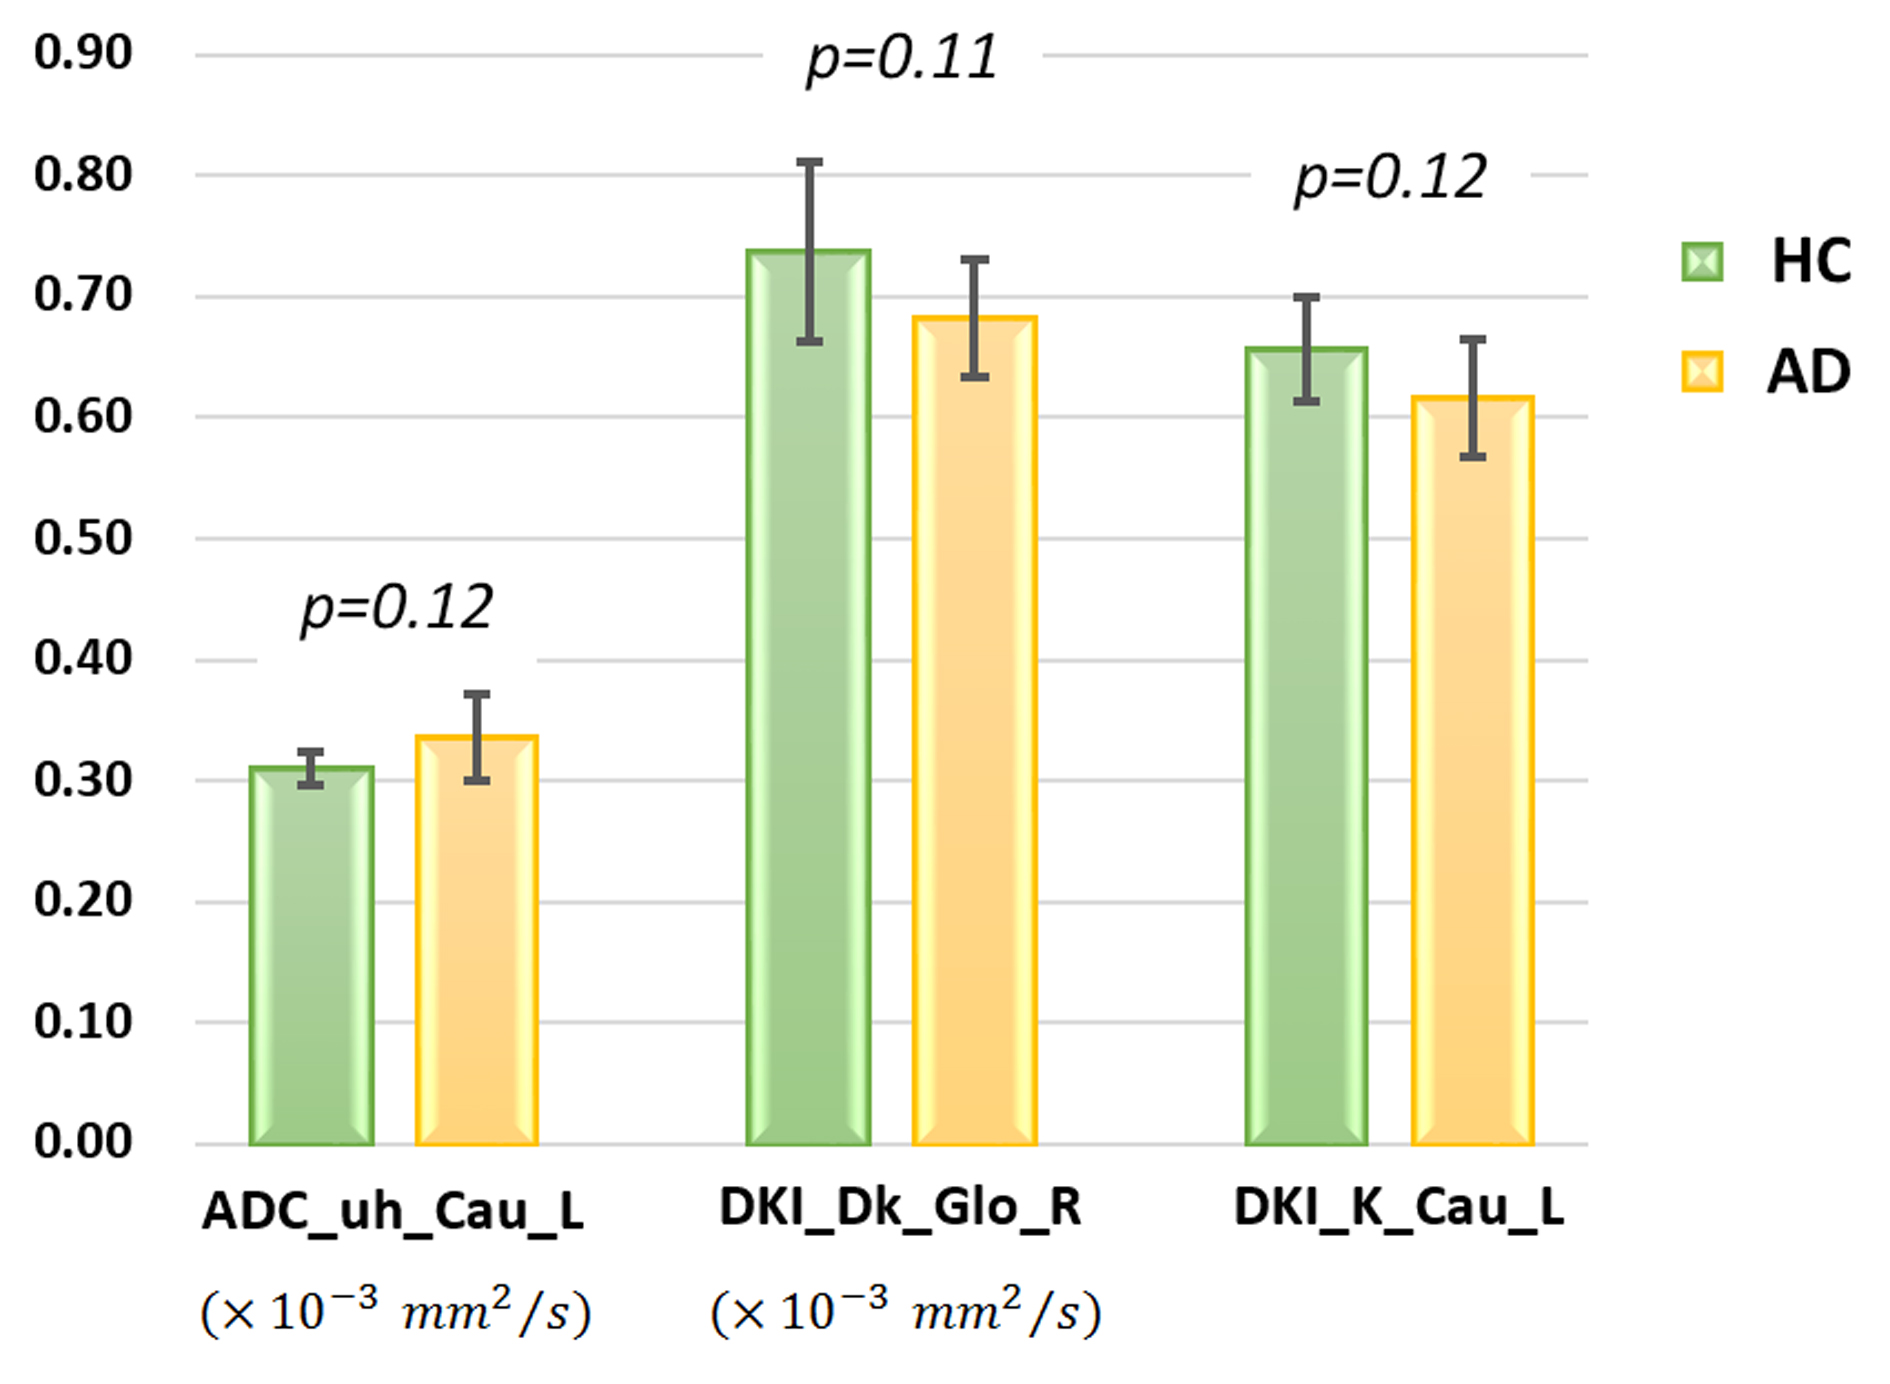
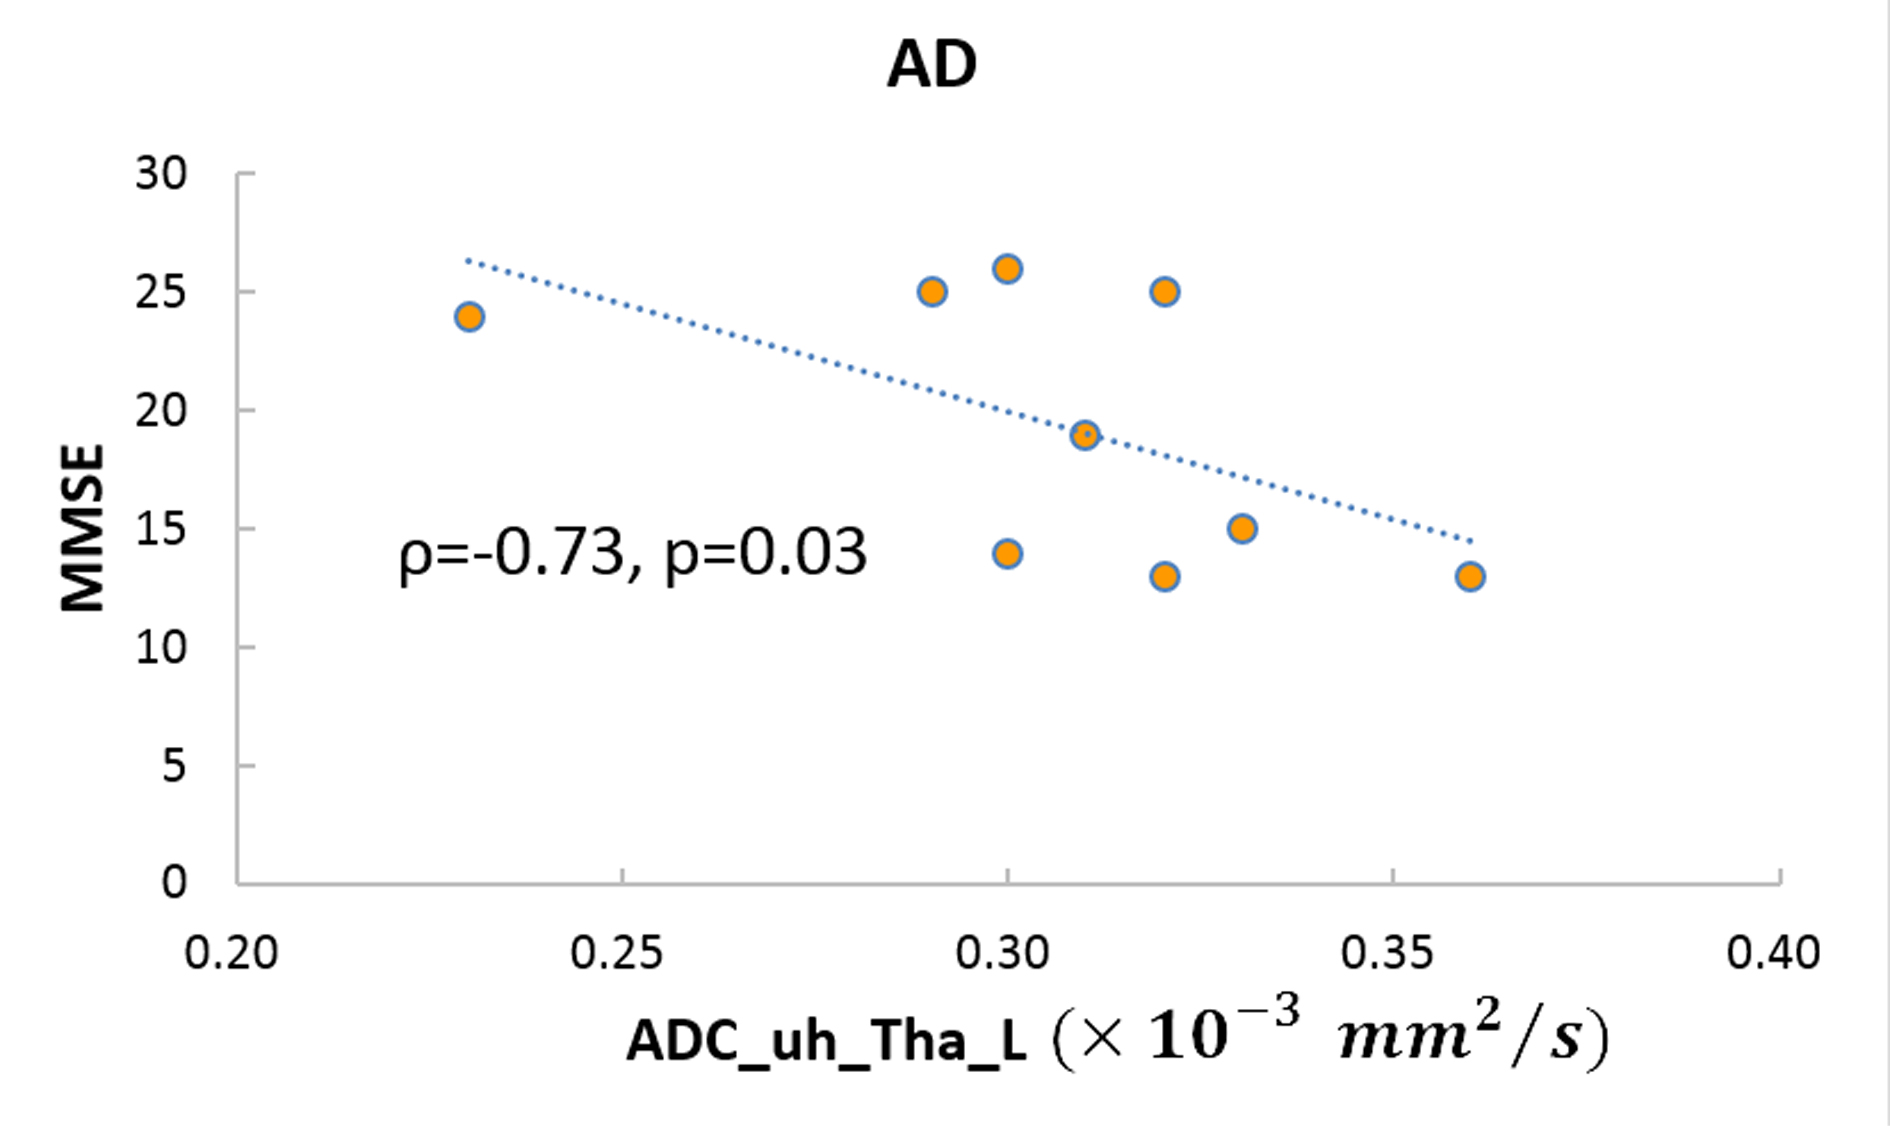
The averaged ages were 57±8 and 65±10 (p>0.05) in HC and AD respectively. No significant difference was found between AD and HC in diffusion characteristics. As presented in Fig 2, the diffusion parameters with most obvious difference between AD and HC were ADC_uh in left caudate (AD: 0.34±0.04 vs. HC: 0.31±0.01, ×10-3 mm2/s , p=0.12), DKI_Dk in right globus pallidus (AD: 0.68±0.05 vs. HC: 0.74±0.07, ×10-3 mm2/s, p=0.11), and DKI_K in right caudate (AD: 0.62±0.05 vs. HC: 0.66±0.04, p=0.12). As shown in Fig 3, in AD group, only ADC_uh in left thalamus was significant inversely correlated to MMSE (rho=-0.73, p=0.03). In HC group, ADC_uh in left caudate (rho=0.82, p=0.05) and ADC_uh in right hippocampus (rho=0.88, p=0.03) was significant correlated to MMSE.
Discussion
In this pilot study, we investigated the diffusion characteristics in AD and found a significant inverse correlated between ADC_uh and cognitive impairment. It was reported that the distribution and expression of AQP4 , which is the major aquaporin in the mammalian brain, were altered in AD patients, with the water transportation modified accordingly (6). Even no significant difference in ADC_uh was found between AD and HC, the close link between ADC_uh and MMSE might suggest ADC_uh might be a useful measurement of the microstructure alternation in AD.
Acknowledgements
This study has received funding by the National Natural Science Foundation of China (Grant No. 81401544) and Natural Science Foundation of Zhejiang Province of China (Grant No. LQ14H180006).References
1. Yuan L, Sun M, Chen Y, et al. Non-Gaussian diffusion alterations on diffusion kurtosis imaging in patients with early Alzheimer's disease. Neuroscience Letters. 2016;616:11-18.
2. Yoshiura T, Mihara F, Tanaka A, et al. High b value diffusion-weighted imaging is more sensitive to white matter degeneration in Alzheimer's disease. Neuroimage. 2003;20(1):413-419.
3. Xueying L, Zhongping Z, Zhoushe Z, et al. Investigation of Apparent Diffusion Coefficient from Ultra-high b-Values in Parkinson's Disease. Eur Radiol. 2015;25(9):2593-2600.
4. Rosenkrantz AB, Padhani AR, Chenevert TL, et al. Body diffusion kurtosis imaging: Basic principles, applications, and considerations for clinical practice. Journal of Magnetic Resonance Imaging. 2015;42(5):1190-1202.
5. Tang X, Holland D, Dale AM, et al. Shape abnormalities of subcortical and ventricular structures in mild cognitive impairment and Alzheimer's disease: detecting, quantifying, and predicting. Hum Brain Mapp. 2014;35(8):3701-3725.
6. Yang C, Huang X, Huang X, et al. Aquaporin-4 and Alzheimer's Disease. J Alzheimers Dis. 2016;52(2):391-402.
Figures