3761
Assessment of cerebrovascular alterations in Alzheimer’s disease with simultaneous multislice Look-Locker arterial spin labelingTae Kim1, Oscar L Lopez2, and James T Becker3
1Radiology, University of Pittsburgh, Pittsburgh, PA, United States, 2Neurology, University of Pittsburgh, Pittsburgh, PA, United States, 3Psychiatry, University of Pittsburgh, Pittsburgh, PA, United States
Synopsis
The ASL dynamics, the transit time to arterial and capillary, CBVa and CBF, were measured in control and mild cognitive impairment subjects to access cerebrovascular alteration in AD progression. The MCI subjects had prolonged transit time, lower CBVa and CBF in comparison to control subjects. Detailed aseesements of cerebrovascular alterations can provide better characterization of AD pathophysiology.
Introduction
Cerebrovascular alterations, one of the risk factors for Alzheimer’s disease (AD) pathogenesis, is classified as early change in AD progression. Aging, the main risk factor for Alzheimer's disease (AD), slows the velocity of cerebral blood flow. It progressively induces CBF reduction affected by cerebrovascular impairment and is related to the AD pathology cascade. The sluggish blood delivery to the tissue can facilitate β-amyloid (Aβ) accumulation and inhibit Aβ clearance. Since the brain attempts to maintain CBF homeostasis by regulating the caliber of cerebral arteries and arterioles1, in the early stage of cerebrovascular alterations, cerebral arterial blood volume (CBVa) could be increased to compensate for slow blood. Detailed characterizations of early cerebrovascular changes – which to date has been limited to CBF measurement - could potentially provide a better understanding of AD pathophysiology.Methods
A total of nine subjects, five healthy controls (age: 72.4 ± 12.1 years; 1/4 fe/males) and four MCI subjects (age: 79.2 ± 12.5 years; 4 males), were studied on a 3T system using a 32-channel head coil. The pulsed LL-ASL technique measures the evolution of ASL signal by acquiring data at multiple inversion times (TIs) after a single spin labeling pulse. Data (GE-EPI) were acquired with 15 readout steps after spin labeling with the time interval between TIs = 259 ms using multiband acquisition technique (acceleration factor = 5) with and without bipolar gradients alternating to separate the arterial component (b value = 3 s/mm2) 2. A FOV/3 shift using CAIPIRINHA method was incorporated to improve the de-aliasing efficiency of multiband reconstruction 3. The imaging parameters were: voxel size = 3.69 x 3.69 x 4.0 mm3, TR/TE = 4 s/31 ms, FA = 30°, and 40 averages. An anatomical image (MPRAGE) was acquired and used for brain parcellation with Freesurfer (http://surfer.nmr.mgh.harvard.edu) to generate the ROIs. After motion correction, the ASL signals with and without the bipolar gradients were averaged for each ROI. The partial volume correction was performed for each voxel of the ASL images using GM, WM and CSF masks from structural images 4. ASL models were fit to these averaged ASL signals using a least-squares fitting algorithm 5. A modified Gaussian model was used to incorporate the dispersion effects for arterial blood and tissue 5. The perturbation effects of multiple LL-excitation pulses, which enhances arterial blood signal by suppression of tissue, was also incorporated into the ASL model.Results
Fig. 1A and 1B shows visual differences in the ASL dynamics maps for arterial blood (above) and tissue (below) signal between MCI and controls with 259ms of temporal resolution for whole brain. The evolution of arterial blood delivery and the progression of tissue perfusion for whole GM and two ROIs (precuneus and anterior cingulate) are shown from 5 controls and 4 MCI patients (Fig. 1C). For the whole GM regions, the metrics for ASL signal dynamics in the controls versus patients were CBF = 60.3 ± 23.5 vs. 43.1 ± 17.8 ml/100g/min; transit time to artery = 1.24 ± 0.1 vs. 1.43 ± 0.19 s; transit time to capillary = 2.65 ± 0.94 vs. 3.25 ± 1.14 s (p < 0.05); and CBVa = 1.15 ± 0.30 vs. 0.49 ± 0.30 ml/100g. The precuneus region is more delayed than anterior cingulate area (Fig. 1C). Fig.2 shows the averaged metrics of ASL signal dynamics for multiple ROIs. Overall, the MCI subjects had slower delivery of arterial blood, smaller CBVa, prolonged capillary transit times, and smaller CBF in comparison to control subjects.Discussion
Conclusion
Detailed quantifications of ASL signal demonstrated in this study give us better understanding of cerebrovascular mechanism of AD progression.
Acknowledgements
This work is supported by NIH 5P50 AG005133-31References
1. Iadecola C, Davisson RL. Hypertension and cerebrovascular dysfunction. Cell Metab 2008;7(6):476-484. 2. Lee Y, Kim T. Assessment of hypertensive cerebrovascular alterations with multiband Look-Locker arterial spin labeling. J Magn Reson Imaging 2017. 3. Setsompop K, et al. Blipped-controlled aliasing in parallel imaging for simultaneous multislice echo planar imaging with reduced g-factor penalty. Magn Reson Med 2012;67(5):1210-1224. 4. Du AT, et al. Hypoperfusion in frontotemporal dementia and Alzheimer disease by arterial spin labeling MRI. Neurology 2006;67(7):1215-1220. 5. Chappell MA, et al. Modeling dispersion in arterial spin labeling: validation using dynamic angiographic measurements. Magn Reson Med 2013;69(2):563-570. 6. Sabayan B, et al. Cerebrovascular hemodynamics in Alzheimer's disease and vascular dementia: a meta-analysis of transcranial Doppler studies. Ageing Res Rev 2012;11(2):271-277.Figures
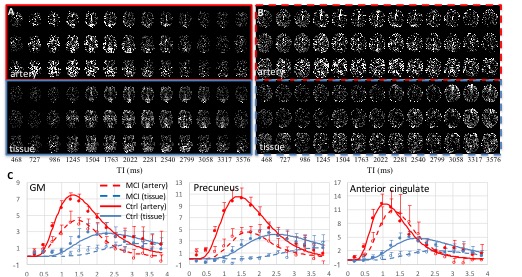
Fig. 1. The measured arterial
blood signal dynamics at 15 different TIs (13 TIs are displayed) from one
control (A) and MCI (B). 3 out of 20 slices are displayed. (C) Averaged arterial blood (red
circles) and tissue (blue circles) signals show the process of arterial blood and its delivery to
tissue and the fitted curves from control (solid lines, n=5) and MCI subjects
(dotted lines, n=4). The delayed
arterial delivery induces lagged tissue perfusion. Overall, sluggish ASL signal
dynamics and lower CBVa were observed in the MCI subject.
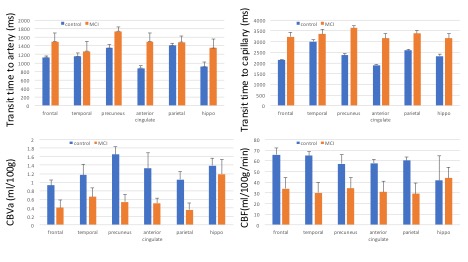
Fig. 2. The averaged values of arterial transit time,
capillary transit time, arterial blood volume (CBVa) and CBF for the multiple regions of brain. Error
bar: SEM