3760
Evaluate the Methanol-induced Alzheimer’s Disease Monkey Model by Resting-state Functional MRIYin-Chieh Liu1, Chaoyang Tian2, Ssu-Ju Li1, Xudong Zhao3, Ting-Chun Lin1, Jianjun Li4, Ching-Wen Chang1, Kaimin Wang2, Yingshan Yang2, Yu-Chun Lo5, YuanYe Ma2, You-Yin Chen*1, Feng Chen*4, and Hsin-Yi Lai*6
1Department of Biomedical Engineering, National Yang Ming University, Taipei City, Taiwan, 2Department of Research and Development, Hainan Jingang Biotech Co.,Ltd, Haikou, China, 3Institute of Biophysics, Chinese Academy of Sciences, Beijing, China, 4Department of Radiology, Hainan General Hospital, Haikou, Haikou, China, 5The PhD Program for Neural Regenerative Medicine, Taipei Medical University, Taipei City, Taiwan, 6Interdisciplinary Institute of Neuroscience and Technology, Qiushi Academy for Advanced Studies, Zhejiang University, Hangzhou City, China
Synopsis
Alzheimer’s disease (AD) is the most comment neurodegenerative disorder that results in the irreversible loss of neurons, especially in the cortex and hippocampus. The aim of this study is to evaluate the changes of brain functional connectivity in methanol-induced AD monkey. To find the corresponding response areas of AD, five brain regions defined by independent component analysis (ICA) were analyzed using seed-based correlation analysis (SCA). Results of resting-sate fMRI showed that the AD Monkey presented abnormal functional connectivity in anterior cingulate cortex (ACC), primary visual cortex (V1) and ventrolateral prefrontal cortex (VLPFC), those were also shown in AD patient.
Introduction
Alzheimer’s disease (AD) is a progressive neurodegenerative disorder that leads to cognitive and memory impairment. AD patients showed BOLD responses increased in the neocortical and medial temporal brain areas during processing of repeated face-name stimulation in previous functional MRI study[1]. Furthermore, not only hippocampus but whole-brain neural networks are critical for higher cognitive functions responsible for memory[2]. Yang’s researched has shown that methanol metabolized product, formaldehyde and methanol metabolite could cause cognitive impairment, hippocampal neuron apoptosis, and tau protein hyperphosphorylation, which could give rise to AD-like symptoms in monkey and rodent studies[3, 4]. However, these studies were only based on behavior test and histology investigation result. Accordingly, we proposed to investigate brain functional connectivity in order to understand the methanol induced AD-monkey by resting-state functional MRI (rsfMRI).Methods
Ten adult Macaca fascicularis were raised in conventional environment class and permitted by Administration of Affairs Concerning Experimental Animals of China. The AD group (n = 5) were fed 3% methanol solution for nine months, and the control group (n = 5) were given water instead. Anatomical T2-weighted images were acquired with a GRE sequence (TR = 6000 ms, TE = 24 ms, BW= 120 Hz, Voxel size: 0.5 0.5 1.5. mm3) and rsfMRI were acquired with a gradient-echo EPI sequence (TR = 2200 ms, TE = 22 ms, BW = 1226 Hz, Voxel size: 1.5 1.5 1.5 mm3) by using 3T MRI system (SIEMENS MAGNETOM Skyra syngo MR D13) with 15Ch Knee Coil. Those rsfMRI data were preprocessed by FSL and the regions of interest (ROIs) were determined by Independent component analysis (ICA) by FSL MELODIC. Then the functional connectivity was analyzed by the seed-based correlation analysis (SCA) in AFNI. Statistical results were computed in SPSS by two-sample t-test, and significant difference between two groups was set if p < 0.05.Results and Discussion
The ICA results showed the bilaterally consistent activation at five brain regions, including medial parietal cortex (PGm), anterior cingulate cortex (ACC)[5], primary visual cortex (V1), ventrolateral prefrontal cortex (VLPFC)[6], and primary motor cortex (M1) (Fig.1). According to ICA results, we performed SCA on these brain regions to confirm the functional connectivity at resting state. Connectivity matrix showed the interesting results in some brain bilateral connection in PGm, ACC, V1, M1, and VLPFC win AD groups, as shown in Fig. 2. The overall connectivity was loss between five ROIs in AD group, especially left ACC to right V1 and bilateral VLPFCs with significant difference. (Fig 3). We found that the oscillations between these regions were getting weaker after chronic feeding with the methanol. We could hypothesize that brain may loss the connectivity due to methanol uptake. Previous study indicated that VLPFC played an important role in working memory and episodic recognition[6], which may decrease its activity during recognition tasks. Furthermore, the task-based fMRI would decrease its connectivity in ventral and medial extrastriate visual areas in AD patients[7]. Hence, we supposed in visual cortex, the methanol may induce AD-like syndrome by decrease its connection to other brain regions. Previous study found that functional connectivity of Alzheimer’s patients decreased in ACC between right occipital lobe and right lingual gyrus play an important role in the neuropathophysiology of depression in AD[8], and were responsible for remote memory[5]. Also, previous study has indicated that the visual cortex (v1) activity may decrease in health aging and AD patients[9]. With these correlation with AD in human neuroimaging studies, we manifested that methanol-induced AD model could produce AD-like results.Conclusion
The overall connectivity decreased between PGm, ACC, V1, VLPFC and M1 in the AD group. The results of functional connectivity at ACC, V1 and VLPFC in methanol-induced AD monkey showed same features in human AD studies suggested the proposed AD monkey model could be reliable for further investigation of AD. In addition, rsfMRI could be a potential tool to diagnose and evaluate the AD course.Acknowledgements
This work was supported by grants from the Fundamental Research Funds for the National Natural Science Foundation of China (81460261,81760308, 81527901, 61673346, 81527901) and the Central Universities (2016QN81017).References
[1] Kivistö J., Soininen H., Pihlajamaki M. (2014). Functional MRI in Alzheimer’s Disease. In Advanced Brain Neuroimaging Topics in Health and Disease-Methods and Applications. InTech, DOI: 10.5772/58264. [2] Zamboni G., Wilcock G. K., Douaud G., Drazich E., et al. (2013). Resting functional connectivity reveals residual functional activity in Alzheimer’s disease. Biological Psychiatry, 74(5), 375-383. [3] Yang M., Lu J., Miao J., et al. (2014). Alzheimer's disease and methanol toxicity (part 1): chronic methanol feeding led to memory impairments and tau hyperphosphorylation in mice. Journal of Alzheimer's Disease, 41(4), 1117-1129. [4] Yang M., Miao J., Rizak J., Zhai R.,et al. (2014). Alzheimer's disease and methanol toxicity (part 2): lessons from four rhesus macaques (Macaca mulatta) chronically fed methanol. Journal of Alzheimer's Disease, 41(4), 1131-1147. [5] Weible A. P. (2013). Remembering to attend: the anterior cingulate cortex and remote memory. Behavioural Brain Research, 245, 63-75. [6]. Badre D., Wagner, A. D. (2007). Left ventrolateral prefrontal cortex and the cognitive control of memory. Neuropsychologia, 45(13), 2883-2901. [7] Grady C. L., McIntosh A. R., Beig S., et al. (2003). Evidence from functional neuroimaging of a compensatory prefrontal network in Alzheimer's disease. Journal of Neuroscience, 23(3), 986-993. [8] Liu, X., Chen, W., Hou, H., et al. (2017). Decreased functional connectivity between the dorsal anterior cingulate cortex and lingual gyrus in Alzheimer's disease patients with depression. Behavioural Brain Research, 326, 132-138. [9] Brewer, A. A., & Barton, B. (2014). Visual cortex in aging and Alzheimer's disease: changes in visual field maps and population receptive fields. Frontiers in Psychology, 5, 74.Figures
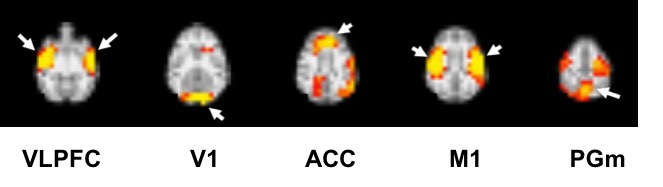
Fig 1. The siginifant defference in bilateral
connectivity among AD and control group were illustrated by ICA results, including
medial parietal cortex (PGm), anterior cingulate
cortex (ACC), primary visual cortex (V1), ventrolateral prefrontal cortex
(VLPFC).
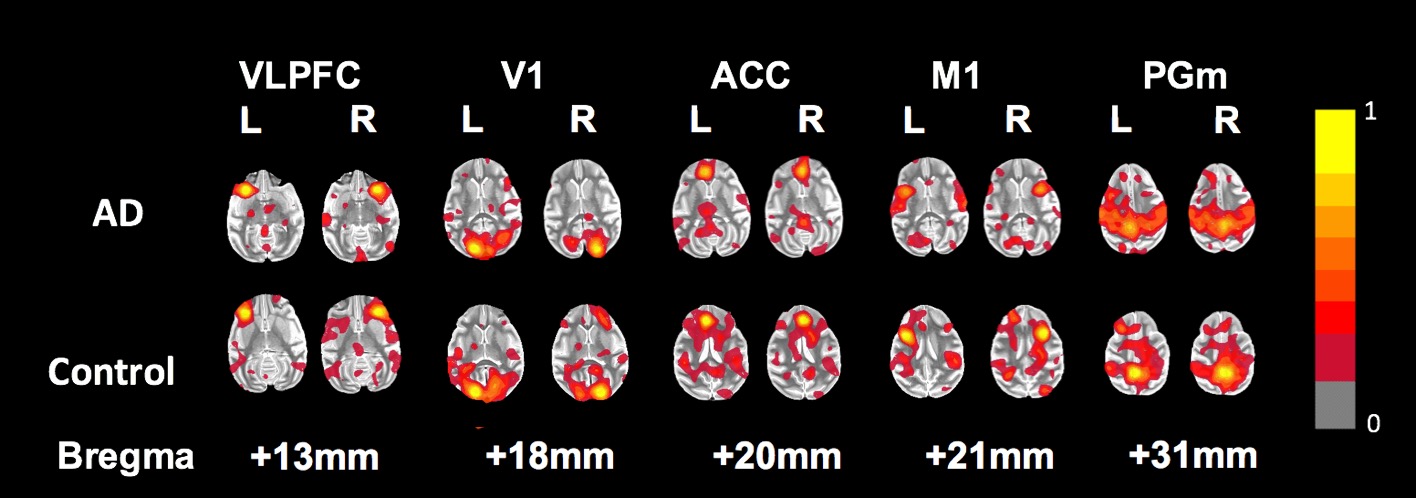
Fig 2. Functional connectivity of correlation mapping with regard to five ROIs chosed
by ICAs. The color bar indices the Pearson's
correlation (p<0.05).
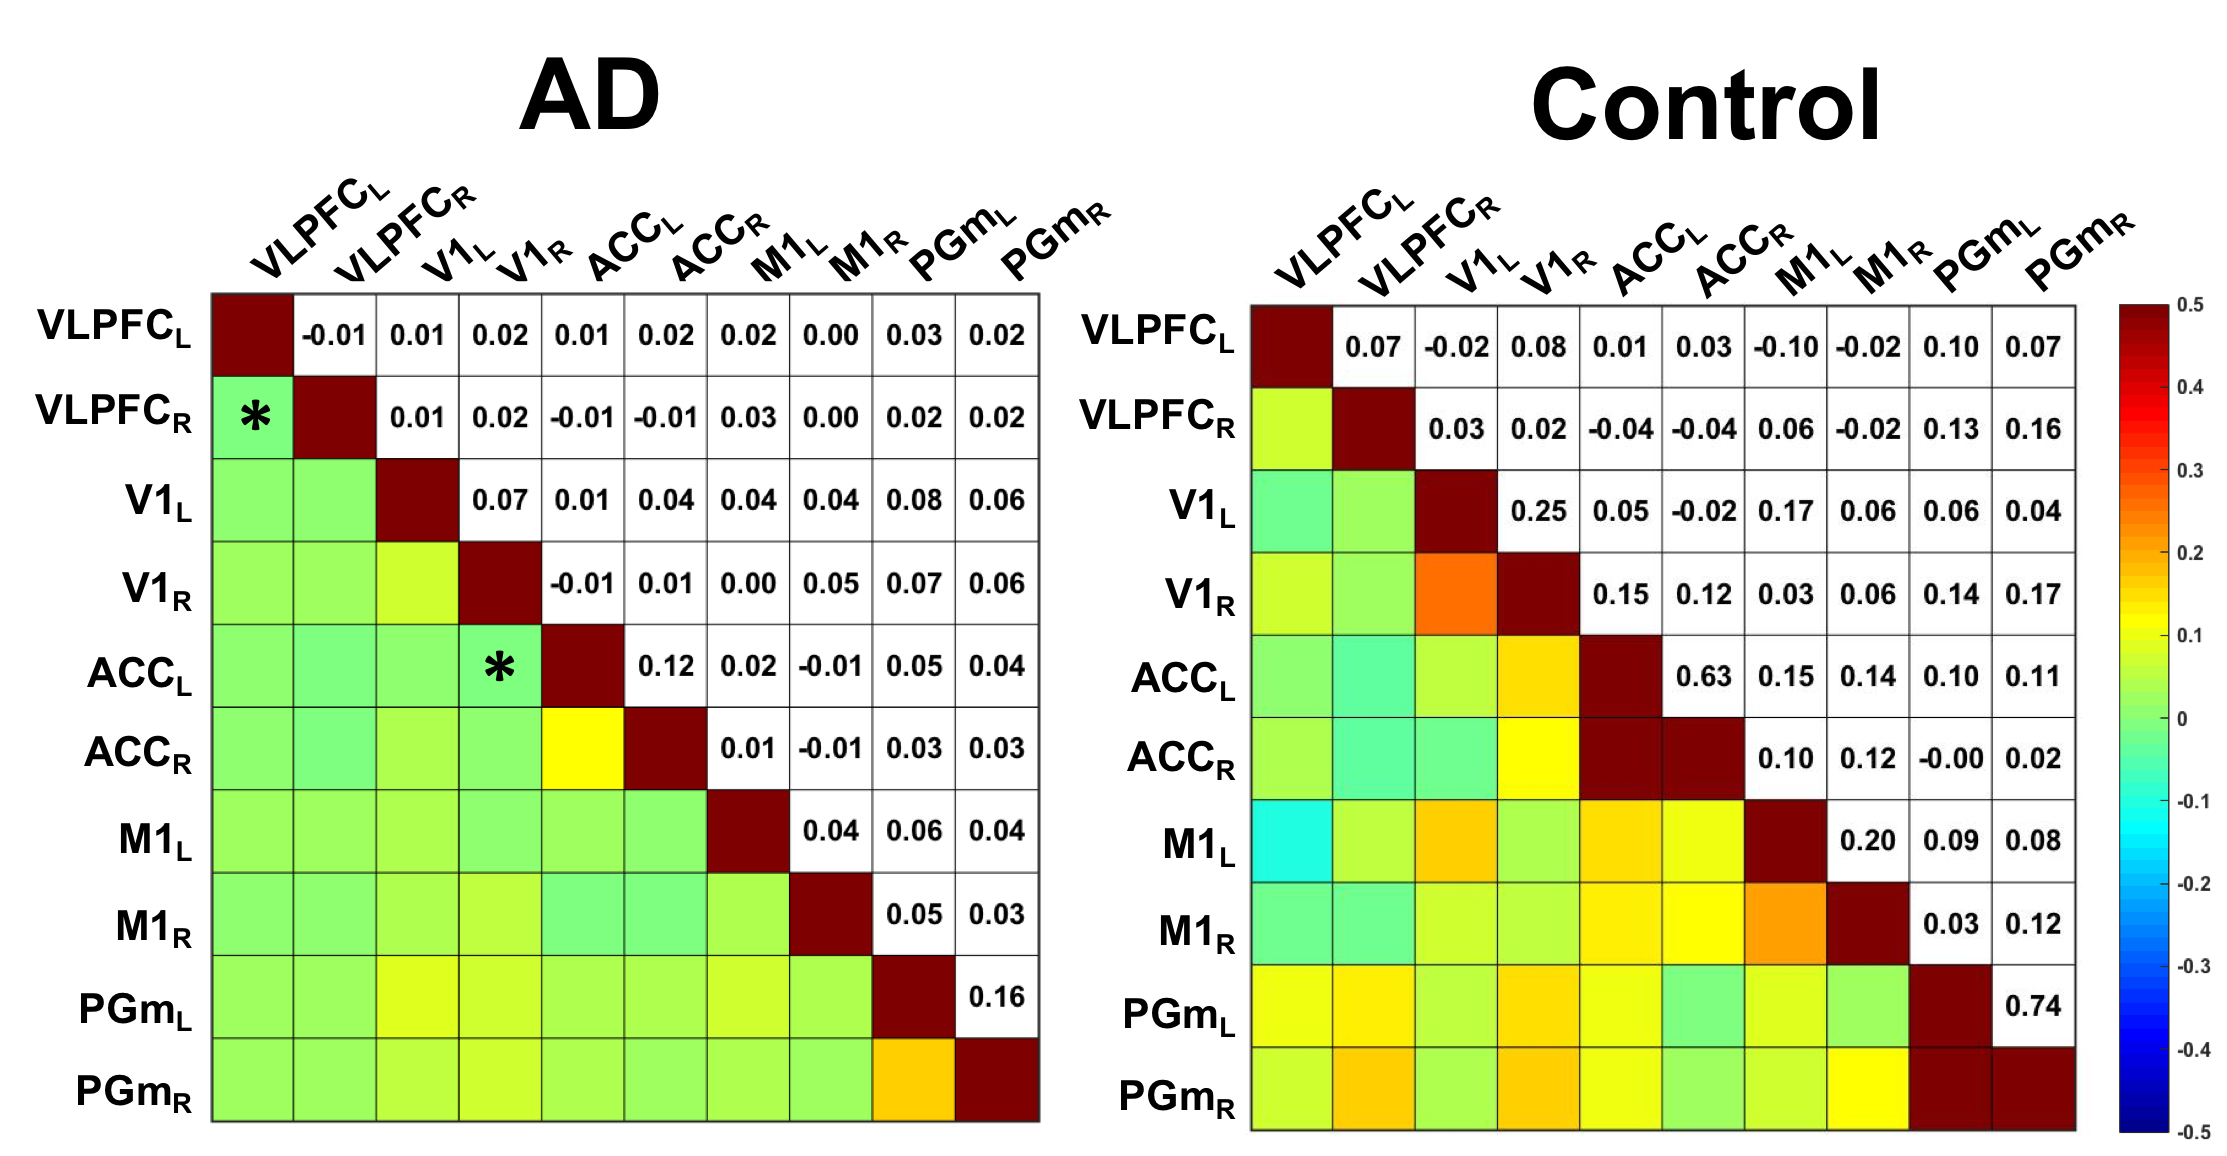
Figure 3. The
connectivity matrix of ROIs. The subscripts in x-axis and y-axis represented the
right or left hemispheric ROIs. The color bar indicats Pearson's correlation ranged
from -0.5 to +0.5.