3759
Quasi-Periodic patterns contribute to rsfMRI functional connectivity in a mouse model of Alzheimer’s disease1University of Antwerp, Antwerpen, Belgium, 2Emory university, Atlanta, GA, United States, 3Emory University, Georgia, GA, United States
Synopsis
We show the detection of Quasi-Periodic patterns (QPPs) in a mouse model of Alzheimer’s disease and illustrate that QPP detection was altered between wild-type and transgenic animals. We show that QPPs contributed to BOLD functional connectivity (FC) within groups and to FC differences between groups. Regression of QPPs diminished FC in co-active regions within the QPP, while anti-correlated regions became correlated. Regression of similar QPPs in wild-type and transgenic animals altered between-group FC differences by 30-50%. These findings shed light on how QPPs contribute to FC and are promising for the application of QPPs as a new pre-clinical tool.
Introduction
Recently, we showed for the first time the existence off Quasi-periodic patterns (QPPs) in mice1. QPPs represent large-scale recurring patterns in the brain, which appear as promising contributors to low frequency BOLD fluctuations2,3. Given control over genetic and environmental conditions, mouse models provide an ideal platform to elucidate how QPPs might underlie BOLD FC and to construct tools that allow quantitative comparison across conditions. We present a case study in TG2576 mice, an Alzheimer’s disease model in which amyloidosis causes synaptic degeneration and dysfunction4. We illustrate how QPPs are detected in wild-type and transgenic groups and how they contribute to FC differences.Methods
RsfMRI was acquired in 18-month TG2576 mice (TG, N=10) and age-matched wild-type (WT, N=8) littermates on a 9.4T scanner (GE-EPI - TR:500ms; TE:16ms; 3 slices positioned on somatosensory cortex). Animals were anesthetized with isoflurane (0.4%) and medetomidine (bolus:0.3mg/kg, continuous infusion:0.6mg/kg/h). Scans were acquired 30min post-bolus.
Subject preprocessed images (SPM12) were concatenated per group (WT/TG) to extract group-wise QPPs, at multiple window sizes, with and without global signal (GS) regression (GSR). (Analysis performed in MATLAB2015a).
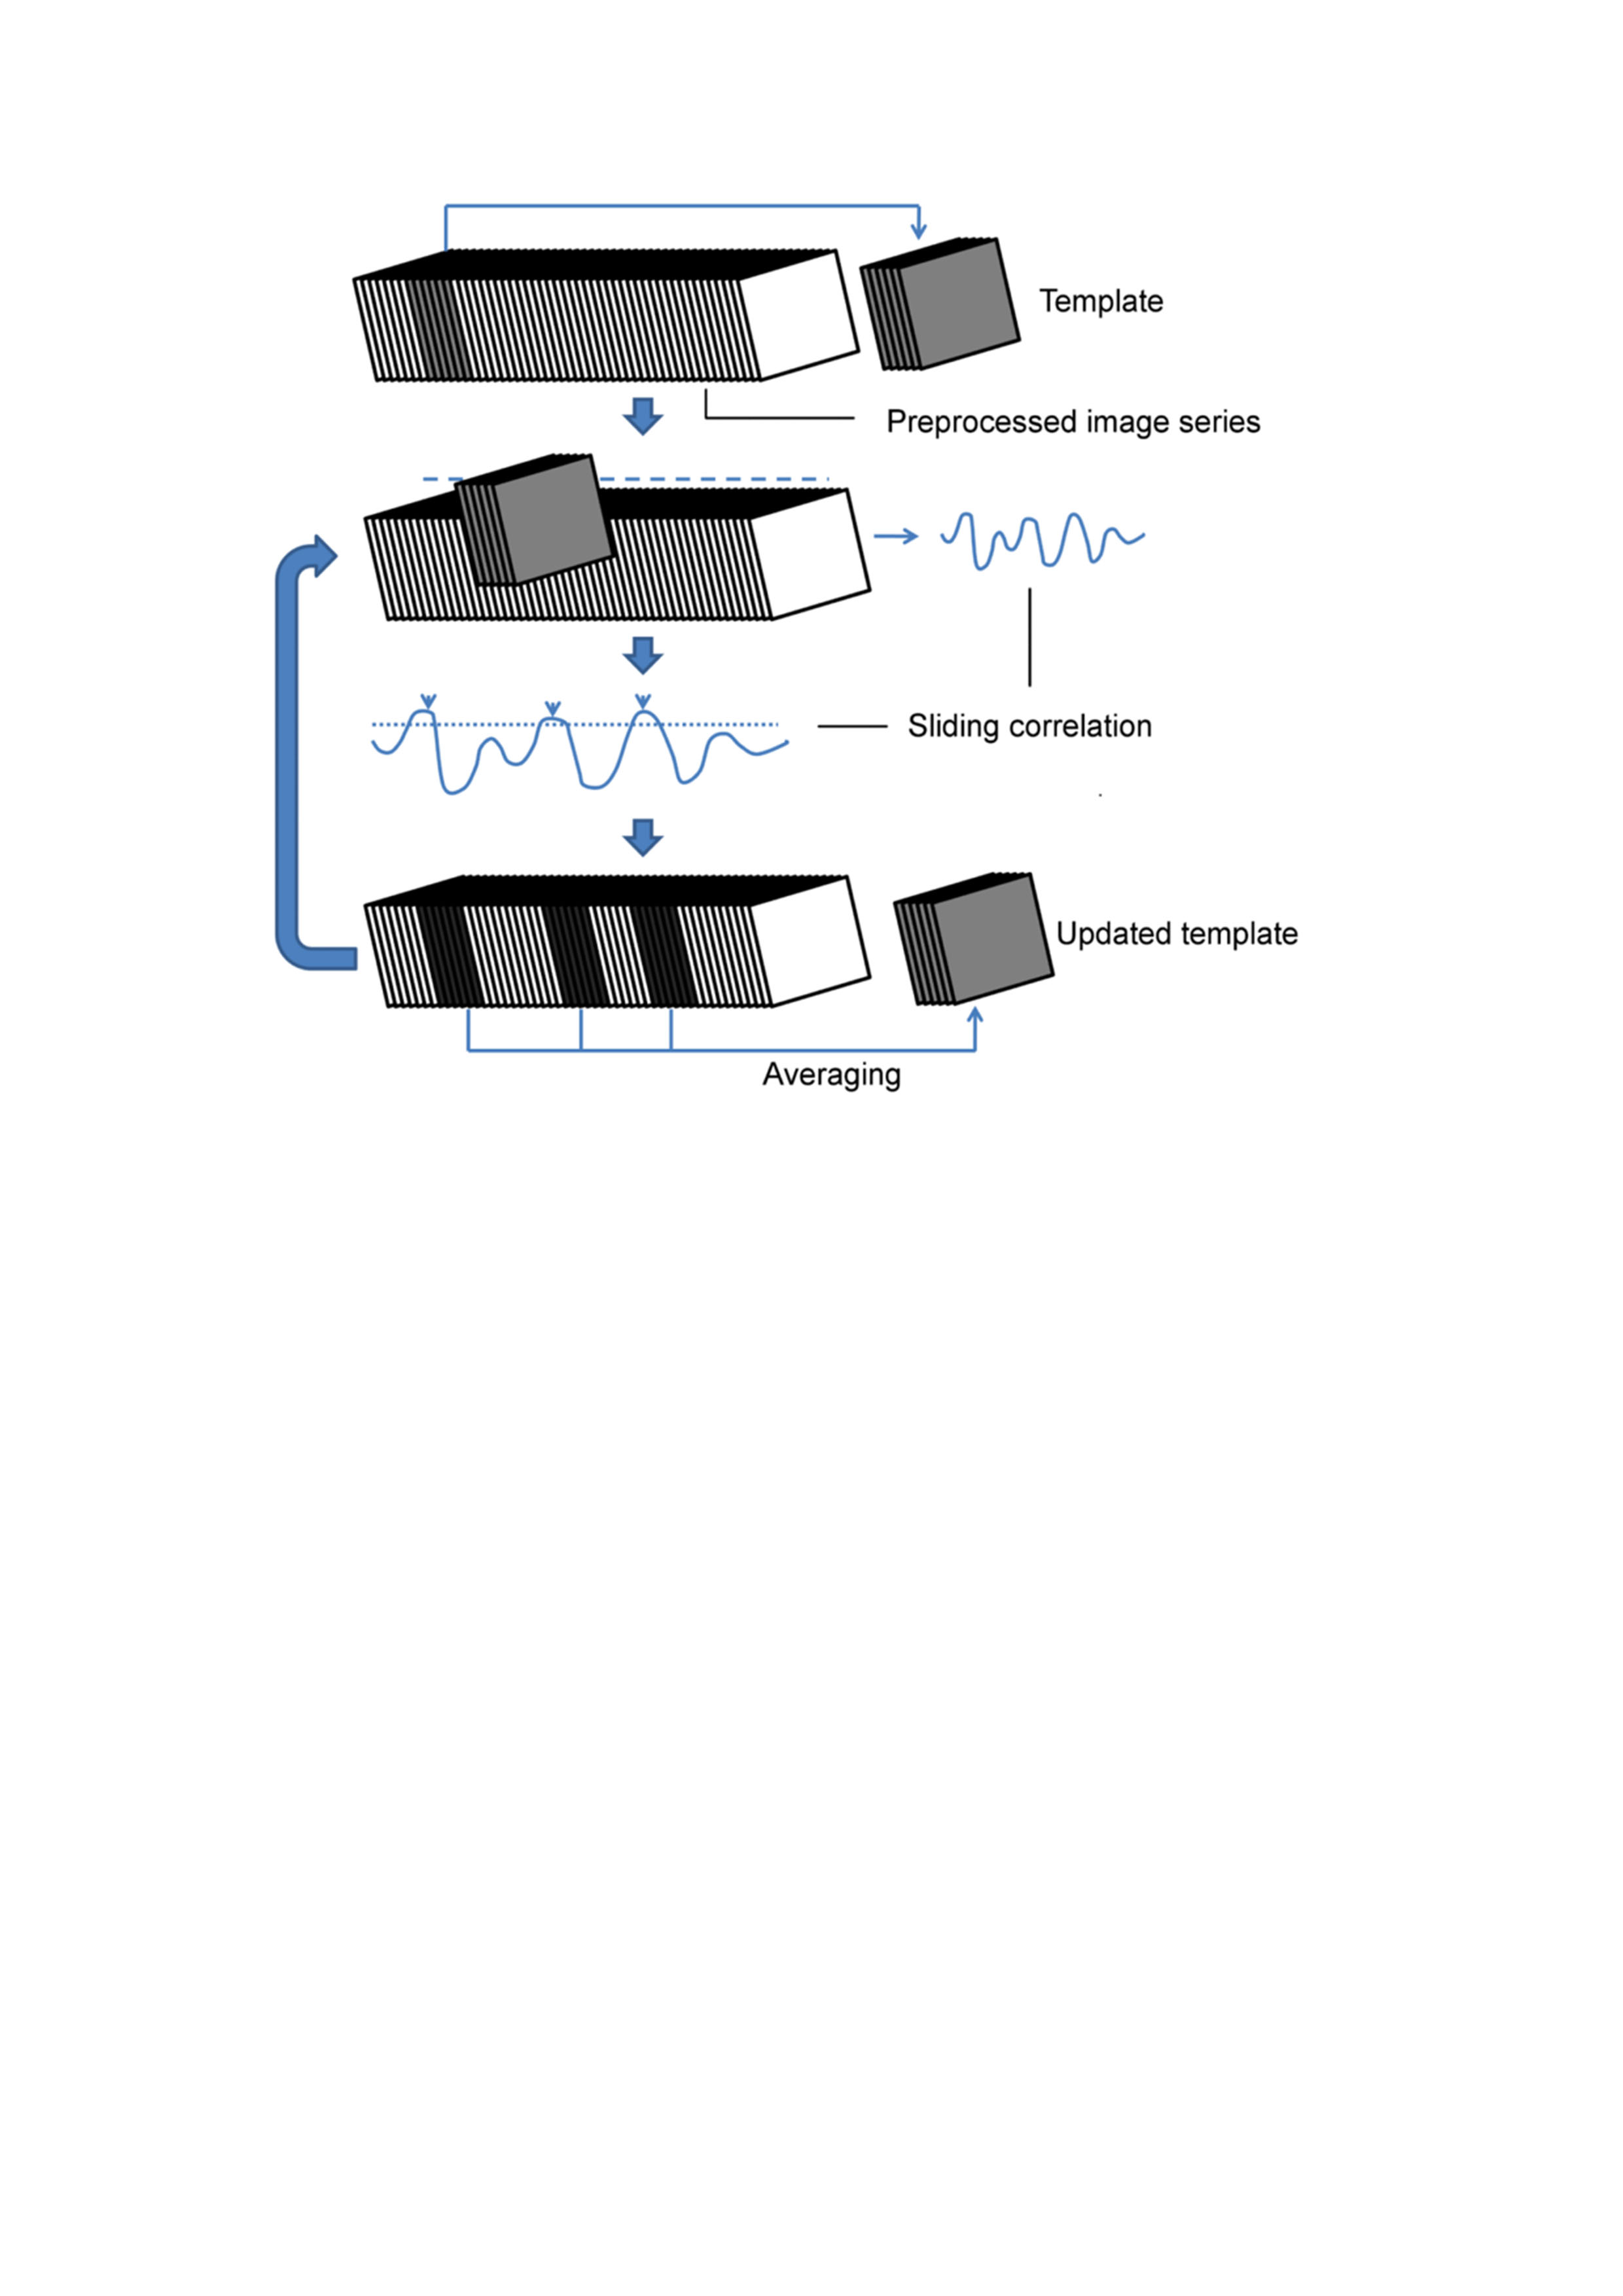
QPPs are accompanied by their Sliding window Template Correlation (STC) with the reference image series (YR) from which they are derived, through averaging frames at STC peak values (Fig.1)5. Similar STCs can be constructed with another target image series (YT), i.e. projection (e.g. YR-WT -> YT-TG). This allows (1) assessment of pattern detection rate in the YT and (2) identification of similar QPPs, independently obtained from the target image series (e.g. YR-TG). Similar QPPs are identified via the highest cross-correlation (cc) of STCs in respective conditions (e.g. STCT-TG × STCR-TG). STC peak image frames were used for statistical parametric mapping of QPPs within and across groups.
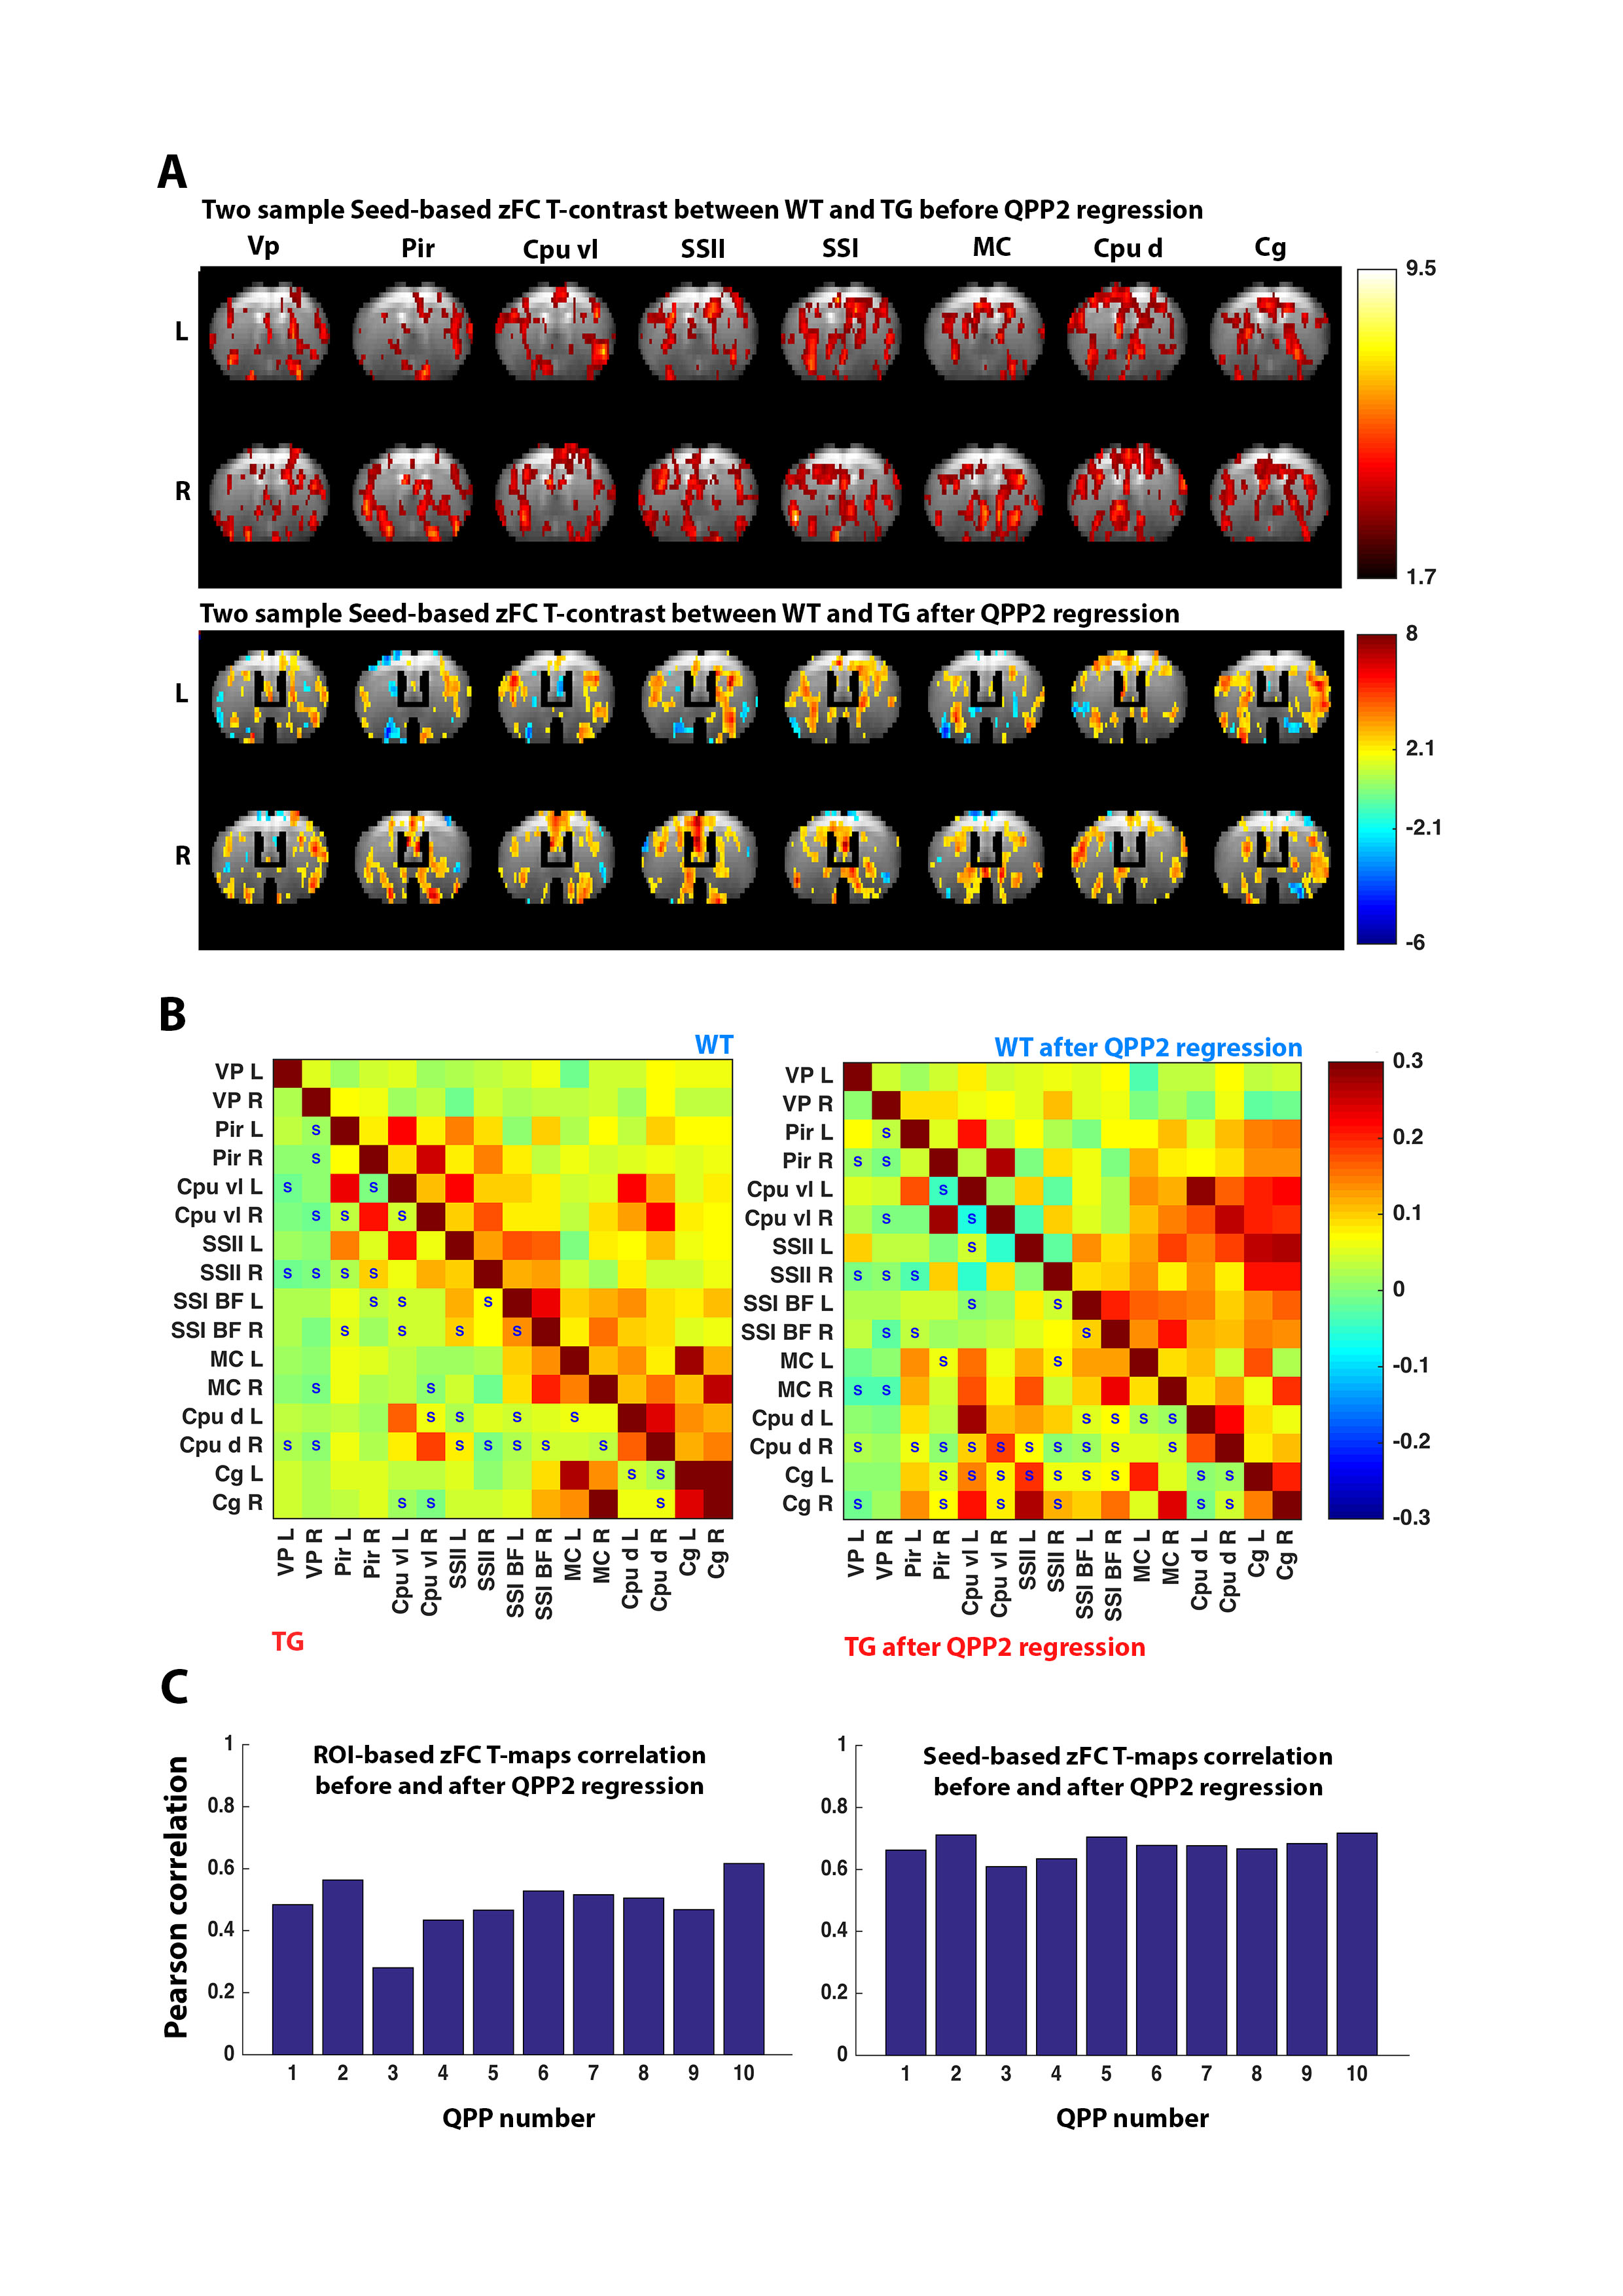
To assess the impact on FC, QPPs were convolved with their STCs, constructing QPP-image series (YQPP). Using the general-linear model approach, the YQPP were regressed voxel-wise out of the respective images. zFC was compared between YR and the residual image (YRES). To assess QPP impact on FC differences, the zFC two-sample T-test T-contrast between YR-WT and YR-TG was correlated with that between YRES-WT and YRES-TG.
Results
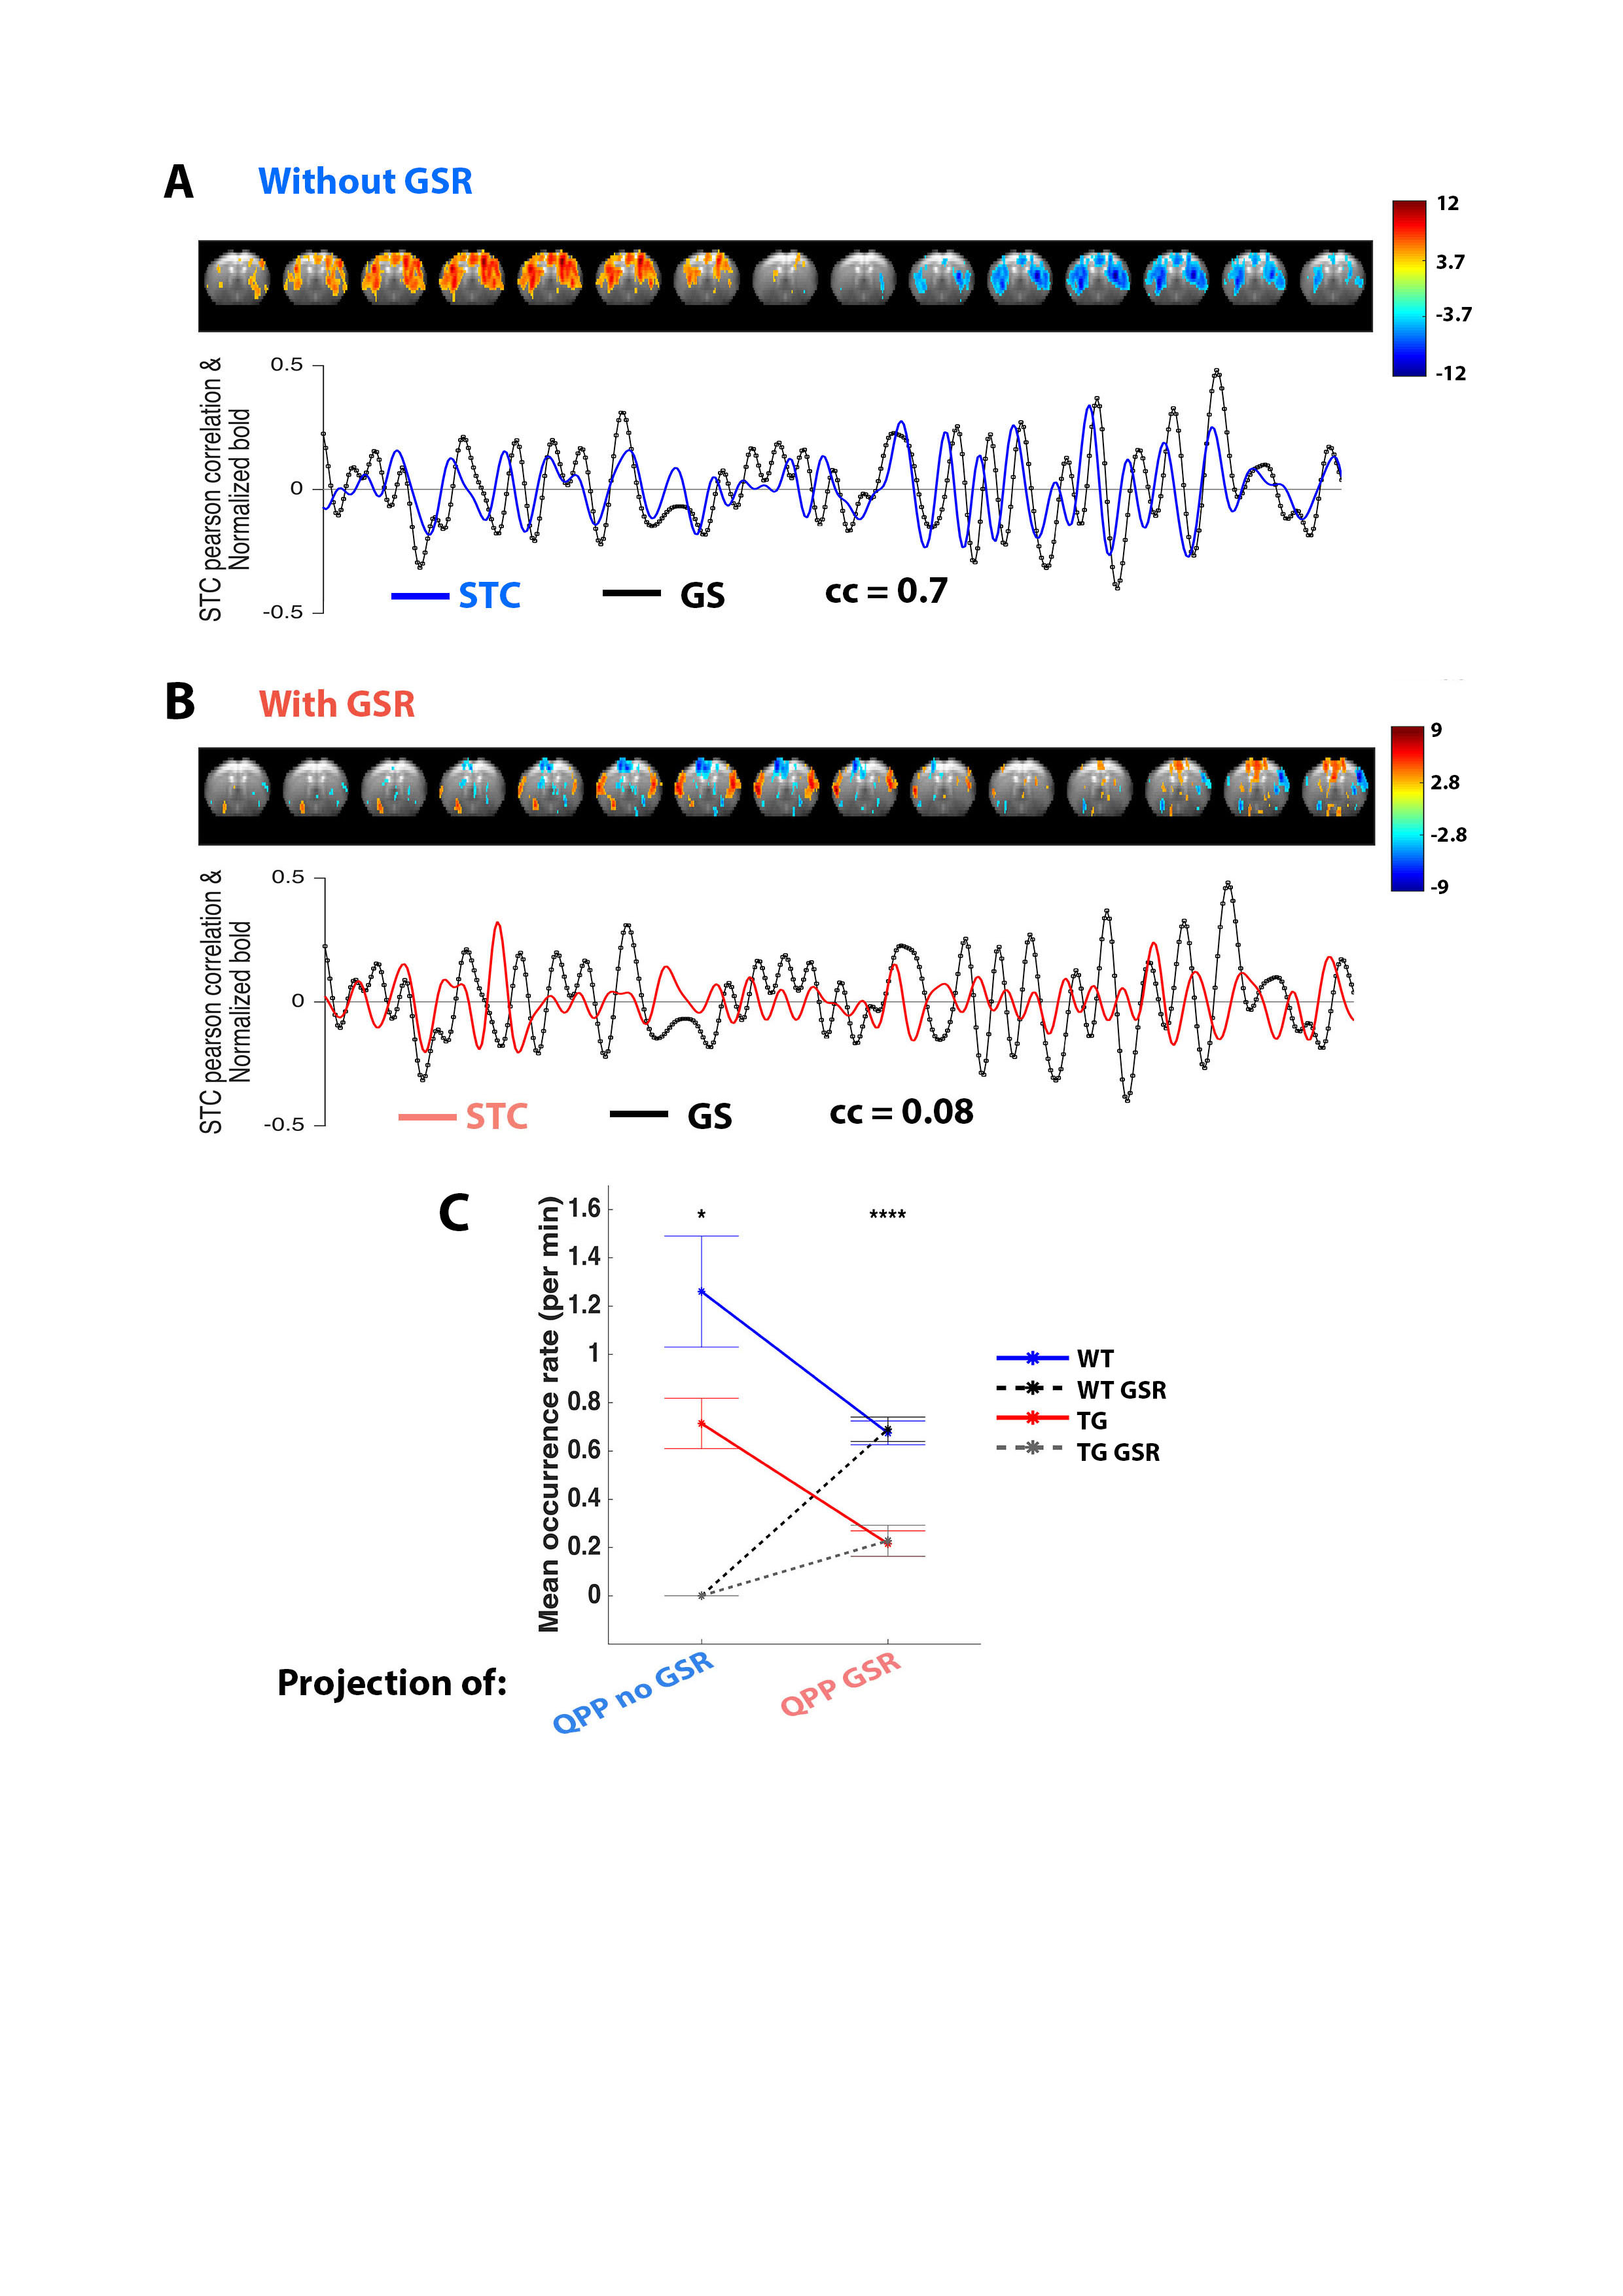
In both WT and TG animals, without GSR, QPPs longer than 3s consistently showed high STC cc (±0.7) with the global signal (Fig.2A). After GSR, both animal groups displayed a plethora of QPPs that follow a similar architecture: lateral-to-medial cortical propagation (Fig.2B). Projection of WT QPPs onto YWT-GSR, YTG and YTG-GSR revealed that GSR abolished detection of the QPPno-GSR, and that detection of QPPno-GSR and QPPGSR were significantly lowered in TG (Fig.2C). T-contrast maps illustrated that QPPno-GSR was highly consistent between groups, while QPPGSR displayed strong differences in spatiotemporal dynamics and low projection STC cc. We therefore concluded that ‘long’ QPPGSR were less reliable to identify similar dynamics across groups.
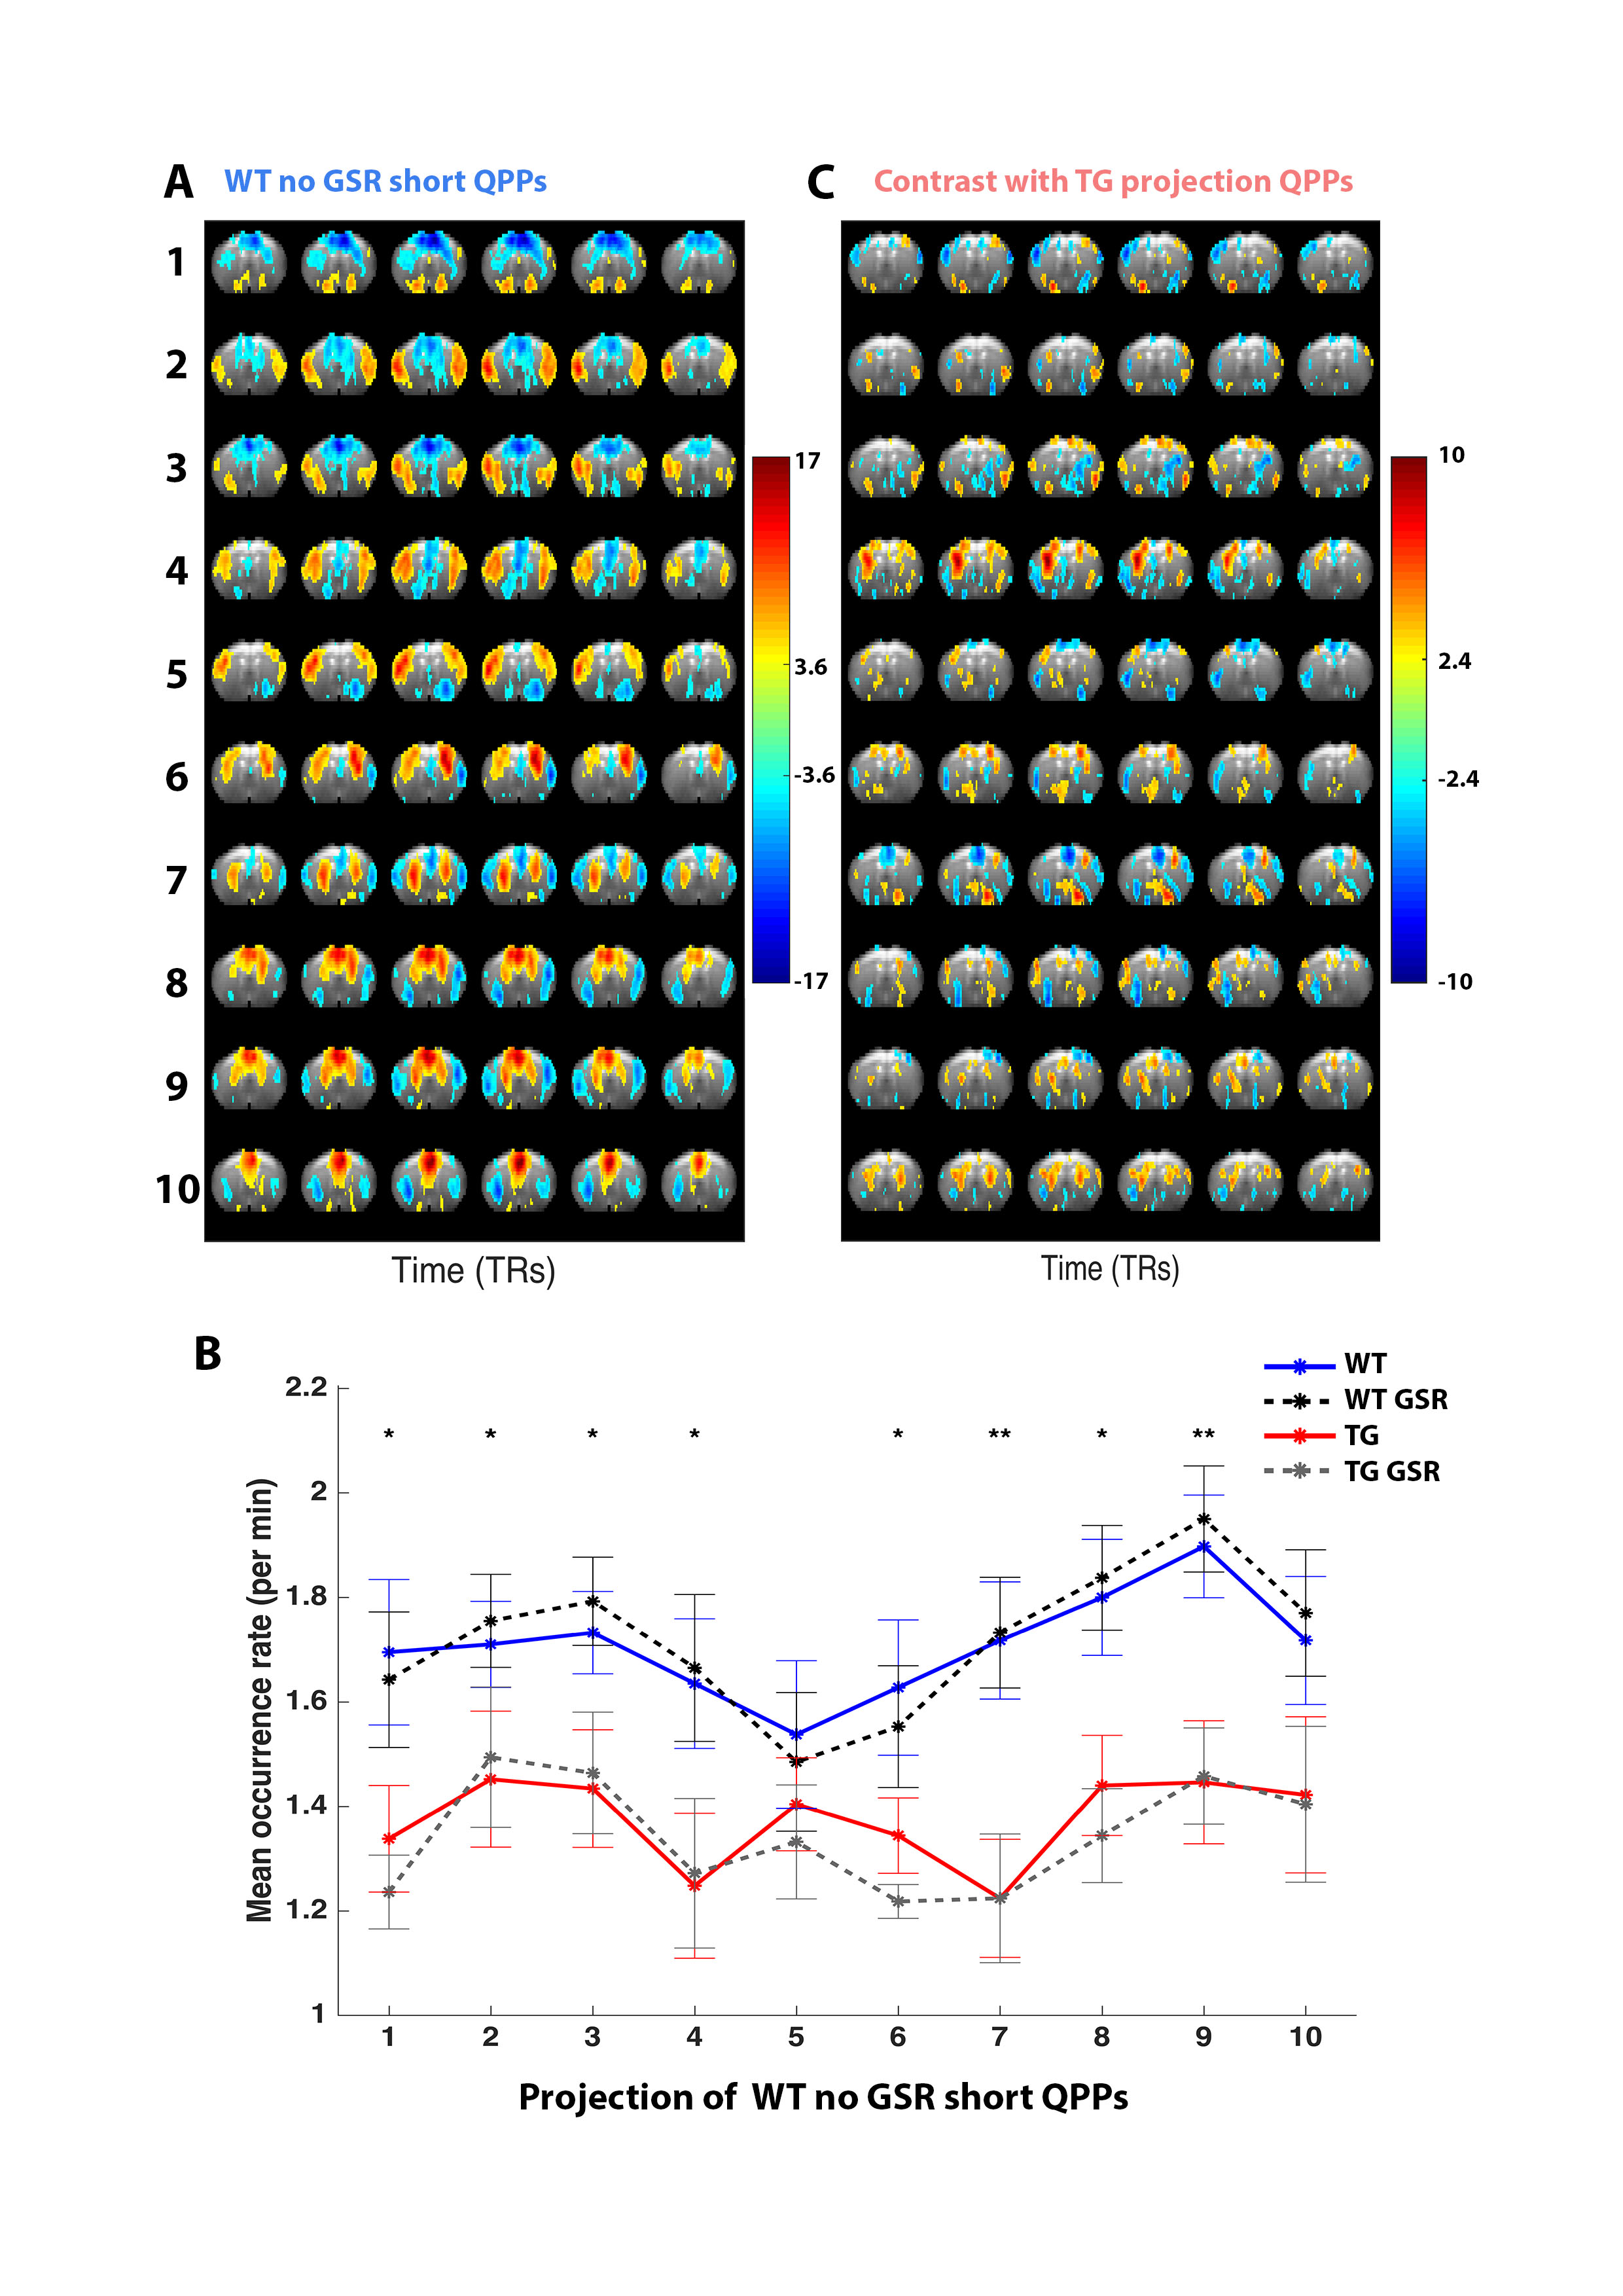
Interestingly, WT and TG animals revealed many similar short 3s QPPs, regardless of GSR, that visually identified as subcomponents of larger QPPs (Fig.3A). Projection of a set of short WT QPPno-GSR onto YWT-GSR, YTG and YTG-GSR revealed that these were unaffected by GSR, but displayed significantly lowered detection in TG (Fig.3B). Average projection STC cc was high (±0.87), allowing identification of similar QPPs in the TG and consequent comparison of spatiotemporal structure (Fig.3C).
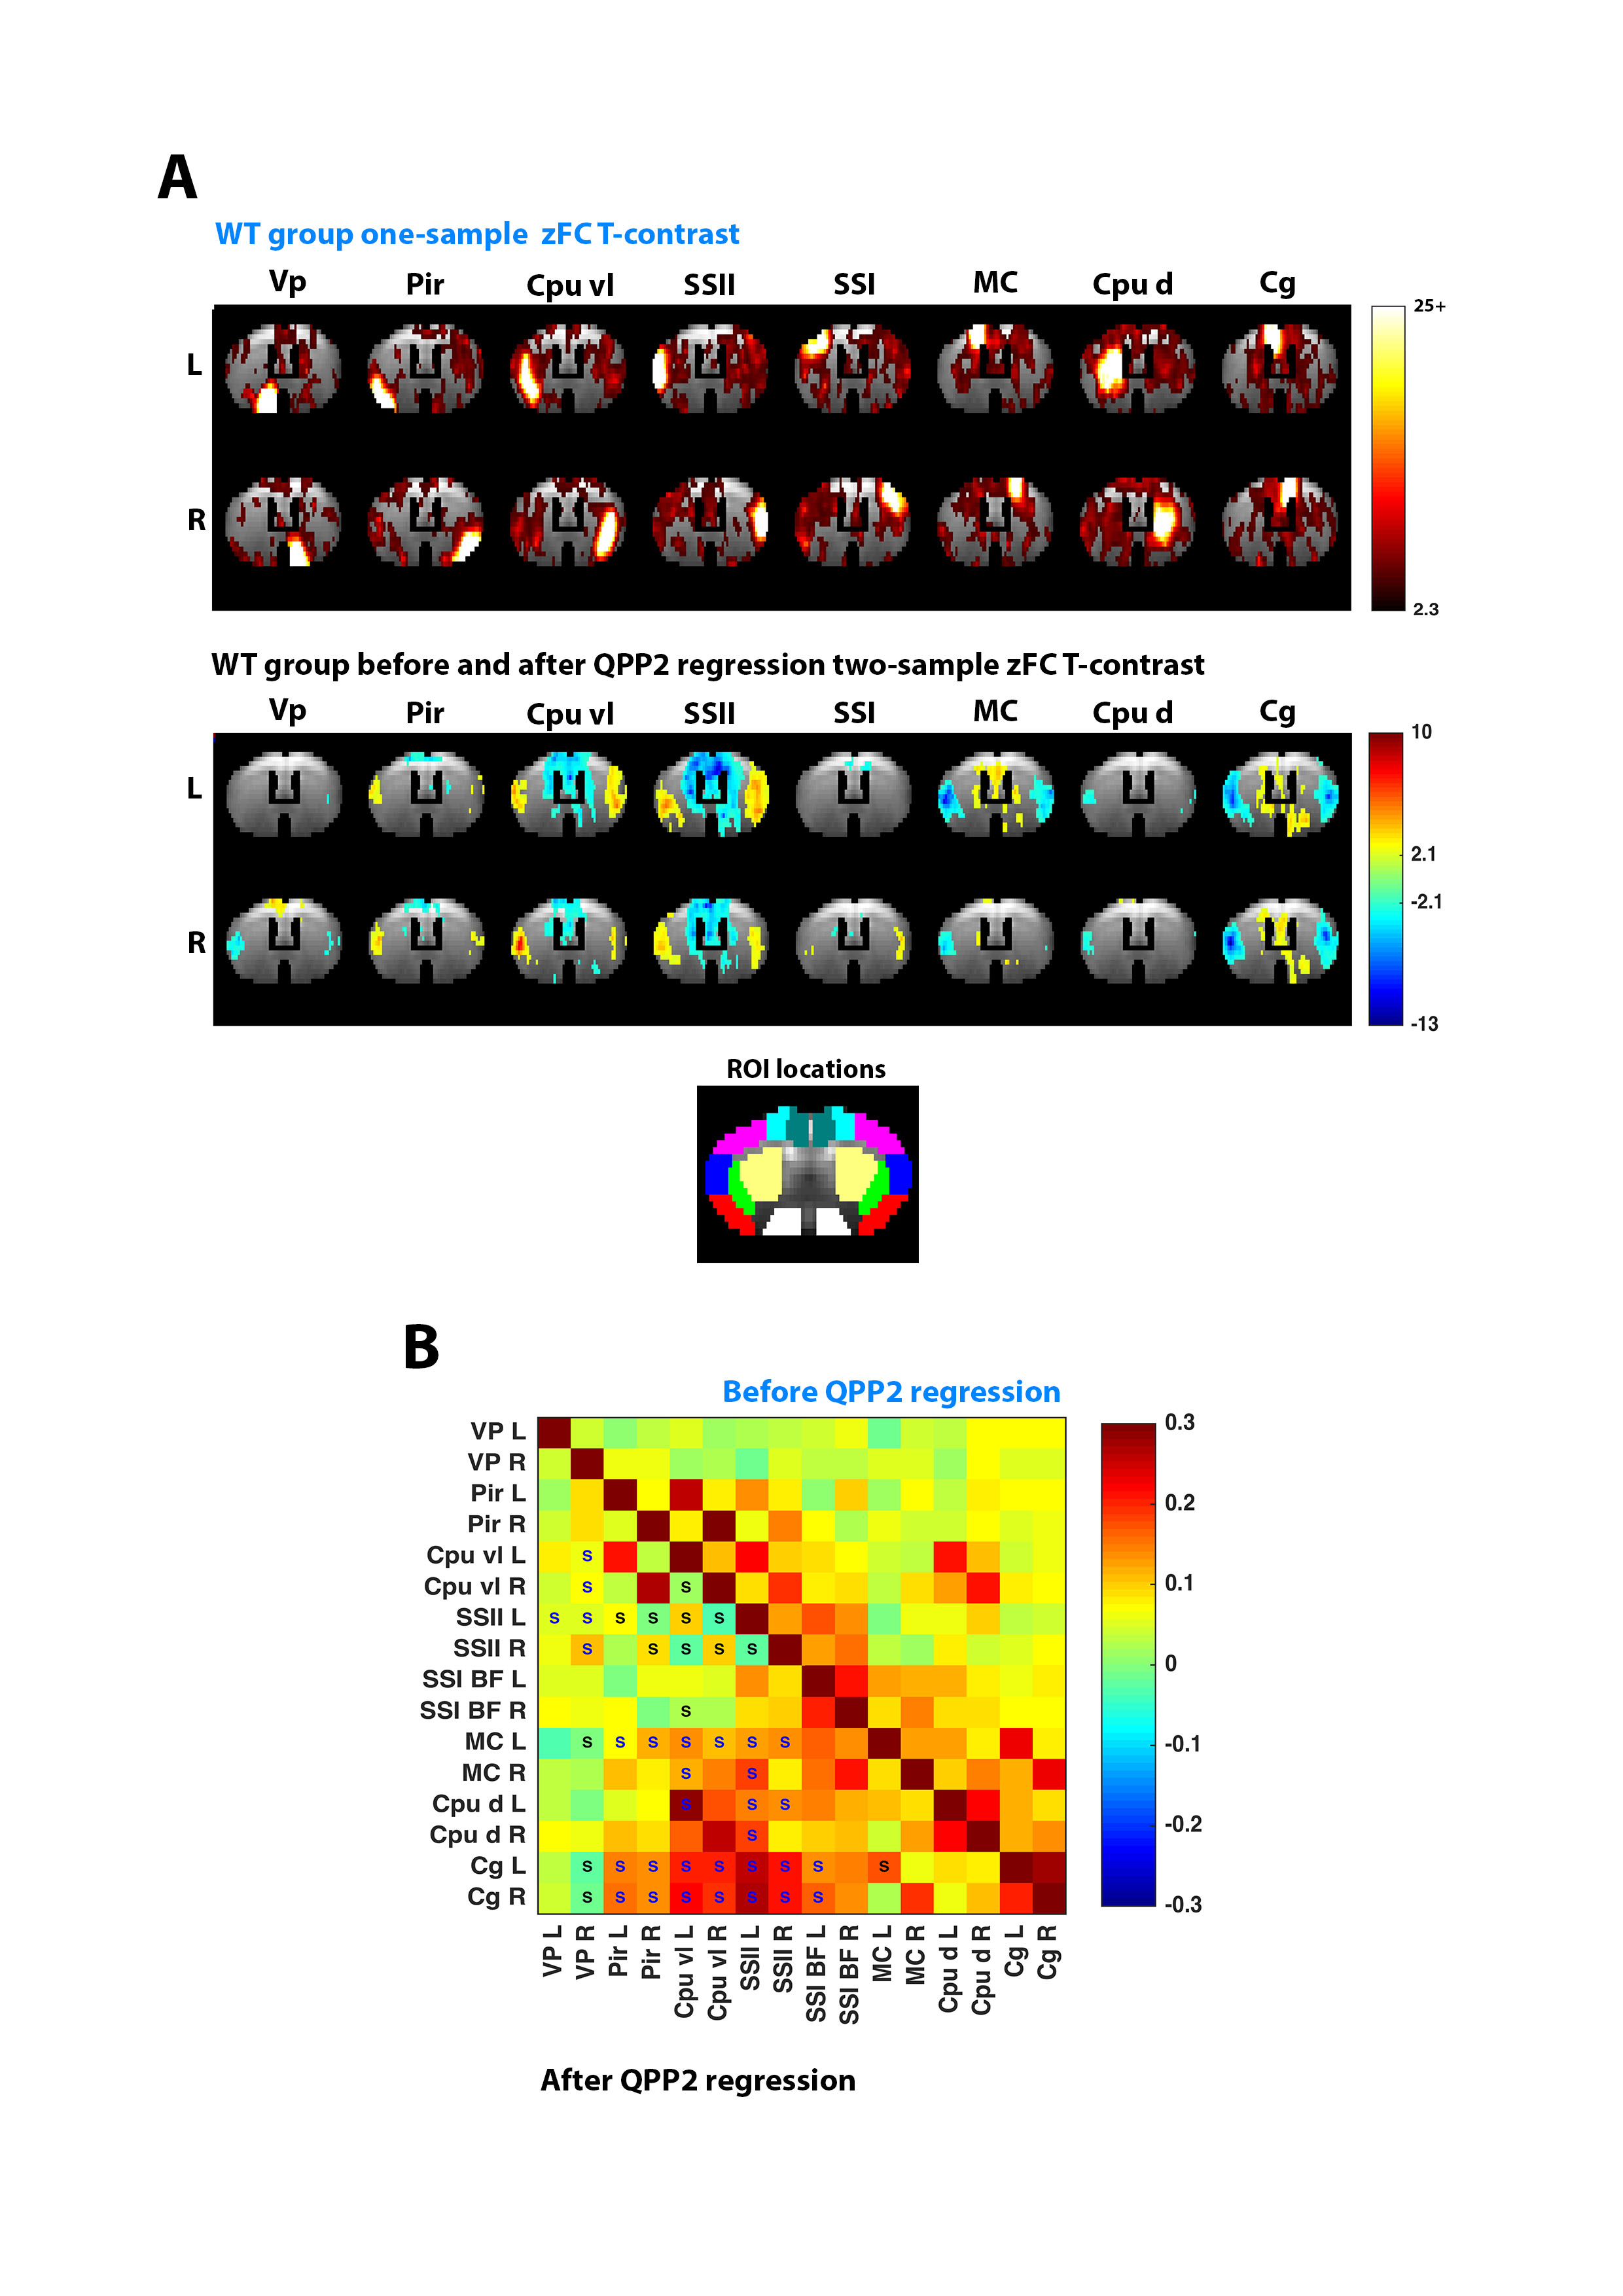
Regression of QPPs showed clear diminishment of Fisher Z-transformed (z)FC between regions displaying matching intensities in the respective QPP, while anti-correlated regions became correlated (Fig.4).
Finally, regression of QPPs in WT and of related QPPs in TG, determined with projection, revealed that zFC T-contrast between both became altered (Fig.5A-B). The similarity of zFC T-contrasts were assessed before and after regression of several QPPs, indicating that QPPs alter FC differences by ~30-50% (Fig.5C).
Discussion
We describe the observation of QPPs in old TG2576 Alzheimer mice, illustrating how WT QPP detection is significantly lowered in TG animals. For the presented data, we determined that 3s QPPs, which show high resemblance with known mouse resting state networks, provide a more reliable source for cross-group comparison, using our novel analysis methodology ‘projection’. Regression of QPPs out of the functional image series indicated diminished FC in QPP co-active regions, but increased FC in anti-correlated regions. In other work, we show that this increased FC is not solely a result of regression, but rather suggest it over-accentuates removal of anti-correlations, emphasizing dynamic positive correlations. QPP regression might thus provide novel insights into the dynamic interaction of resting state networks. Finally, we compared the effect of regressing similar QPPs in WT and TG animals, which showcases how QPPs could alter FC differences between both groups up to 50%.Acknowledgements
This work was supported by the interdisciplinary PhD grant (ID) BOF DOCPRO 2014 and further partially supported by funding received from: the European Union’s Seventh Framework Programme (INMiND) (grant agreement 278850, granted to AVdL), the molecular Imaging of Brain Pathohysiology (BRAINPATH) and the Marie Curie Actions-Industry-Academia Partnerships and Pathways (IAPP) program (grant agreement 612360, granted to AVdL), Flagship ERA-NET (FLAG-ERA) FUSIMICE (grant agreement G.0D7651N), and the Flemish Impulse funding for heavy scientific equipment (granted to AVdL).References
1. Belloy, M. et al. Dynamic resting state fMRI in mice: detection of Quasi‐Periodic Patterns. Proceeding Int. Soc. Magn. Reson. Med. p.0961. (2017).
2. Wang, K. et al. Quasi-periodic pattern of fMRI contributes to functional connectivity and explores differences between Major Depressive disorder and control. Proc Int Soc Magn Reson Med 1683 (2016).
3. Keilholz, S. D. The neural basis of time-varying resting-state functional connectivity. Brain Connect. 4, 769–79 (2014).
4. Shah, D. et al. Early pathologic amyloid induces hypersynchrony of BOLD resting-state networks in transgenic mice and provides an early therapeutic window before amyloid plaque deposition. Alzheimer’s Dement. 12, 964–976 (2016).
5. Majeed, W. et al. Spatiotemporal dynamics of low frequency BOLD fluctuations in rats and humans. Neuroimage 54, 1140–1150 (2011).
Figures