3757
What reference for reference ranges? How scanner and subject data heterogeneity impact MR hippocampal volumetry statistics in Alzheimer’s Disease1Department of Radiology, CHUV, Lausanne, Switzerland, 2Advanced Clinical Imaging Technology, Siemens Healthineers, Lausanne, Switzerland, 3LTS5, EPFL, Lausanne, Switzerland, 4CoVii Ltd, Porto, Portugal
Synopsis
The volume of specific brain structures is of clinical interest in many brain diseases. By using a volumetric reference range for healthy subjects, radiologists can contribute to refining diagnosis. However, both scanner and subject characteristics impact the construction and use of these reference ranges. Using a diverse dataset with 80 MRI scanners and 302 subjects, we show Alzheimer’s disease detection from hippocampal volume is robust to mismatch between training (development) and testing (deployment) environments despite showing some influence, but that estimates of atrophy rates can vary considerably depending on the training set used. Radiologists should interpret volumetry statistical results accordingly.
Introduction
Hippocampal volumetry provides a well-recognized marker for Alzheimer’s disease (AD), correlating with other biomarkers and clinical symptoms1. By using reference ranges for healthy subjects, radiologists can contribute to refining diagnosis. However, the impact of distributional characteristics of data used for reference range building and evaluation is not clear – in other words, how much variability in estimates and prediction can we expect just by changing the training and testing datasets? Here, we investigate the consequences of scanner or subject sample variability.Materials and Methods
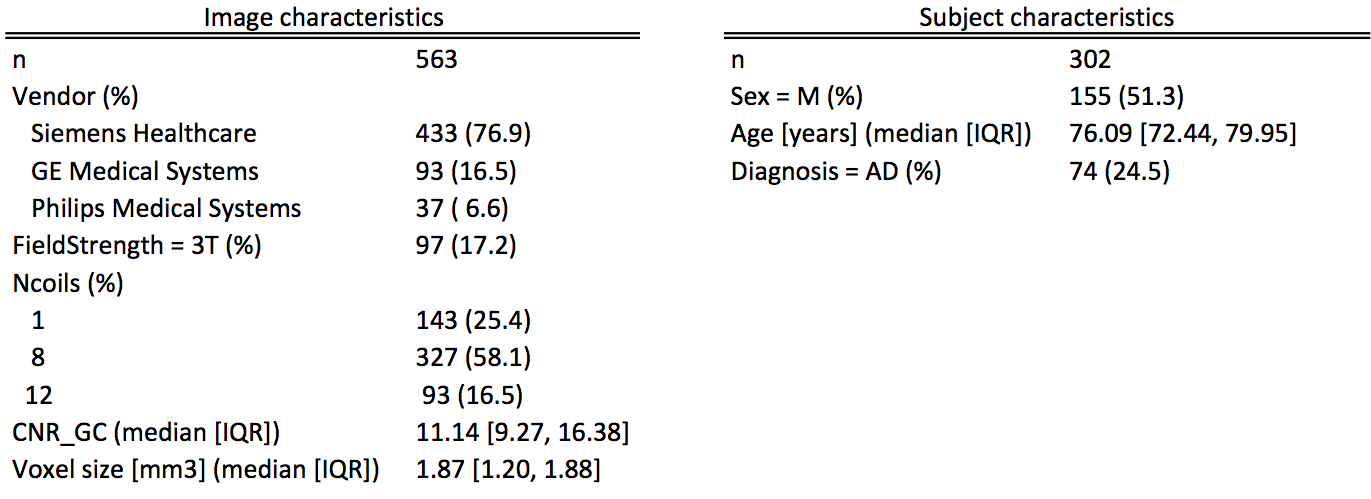
We used 563 ADNI scans from 228 healthy controls (HC) and 74 AD patients, distributed between 80 MRI machines (Figure 1), including both cross-sectional and longitudinal (up to 4 measurements) subjects. We computed bilateral hippocampus volume (HV), total intracranial volume (TIV) with the MorphoBox prototype2, and normalized bilateral HV as $$$NHV=\frac{HV}{TIV}$$$. Scanner identity was given by unique combinations of site, vendor, system, head coil.
Experiment 1: Training variability and atrophy rates
We formed 1000 training subsamples by randomly picking 1/2 of scanners from the full dataset without replacement. For each subsample, we trained the mixed-effects model $$$NHV = 1+Age+Sex+Diagnosis+(1|ScannerID/SubjectID)$$$ ), which accounts for repeated measurements for some subjects.
We then assessed annual atrophy rates (ΔNHV) for HC and AD.
Experiment 2: Testing variability and discriminative performance
We formed a single training sample Xtr by randomly sampling 1/3 of scanners from the full dataset without replacement, assigning the rest to a testing sample Xte (no subject overlap). The same model as in experiment 1 was trained on Xtr. To assess sampling-related variations in discrimination, we formed S=1000 test subsamples Xte,s, each sampling without replacement 1/2 of Xte, For each image Xte,s,n an imaging marker $$$f(X_{te,s,n}) = NHV_n-NHV_{predicted} $$$ was obtained (setting Diagnosis to HC). For each Xte,s we computed the Area Under the Curve (AUC) of a ROC curve on f(Xte,s,n) stratified by diagnosis.
We measured mismatch between Xtr and each Xte,s by standardized mean differences between scanners (Vendor; Field strength; Number of coils; Voxel size; grey matter-CSF Contrast-to-Noise Ratio, squared and divided by voxel size in order to decorrelate from Voxel size (CNRGC)) and subjects (Sex, Age, Diagnosis), testing for associations between mismatch and discrimination performance by linearly regressing the AUC on the standardized mean differences of these variables, ignoring non-independence of the subsamples.
We repeated experiment 2 with a confound-corrected model including voxel size and (CNRGC )
Results
Experiment 1
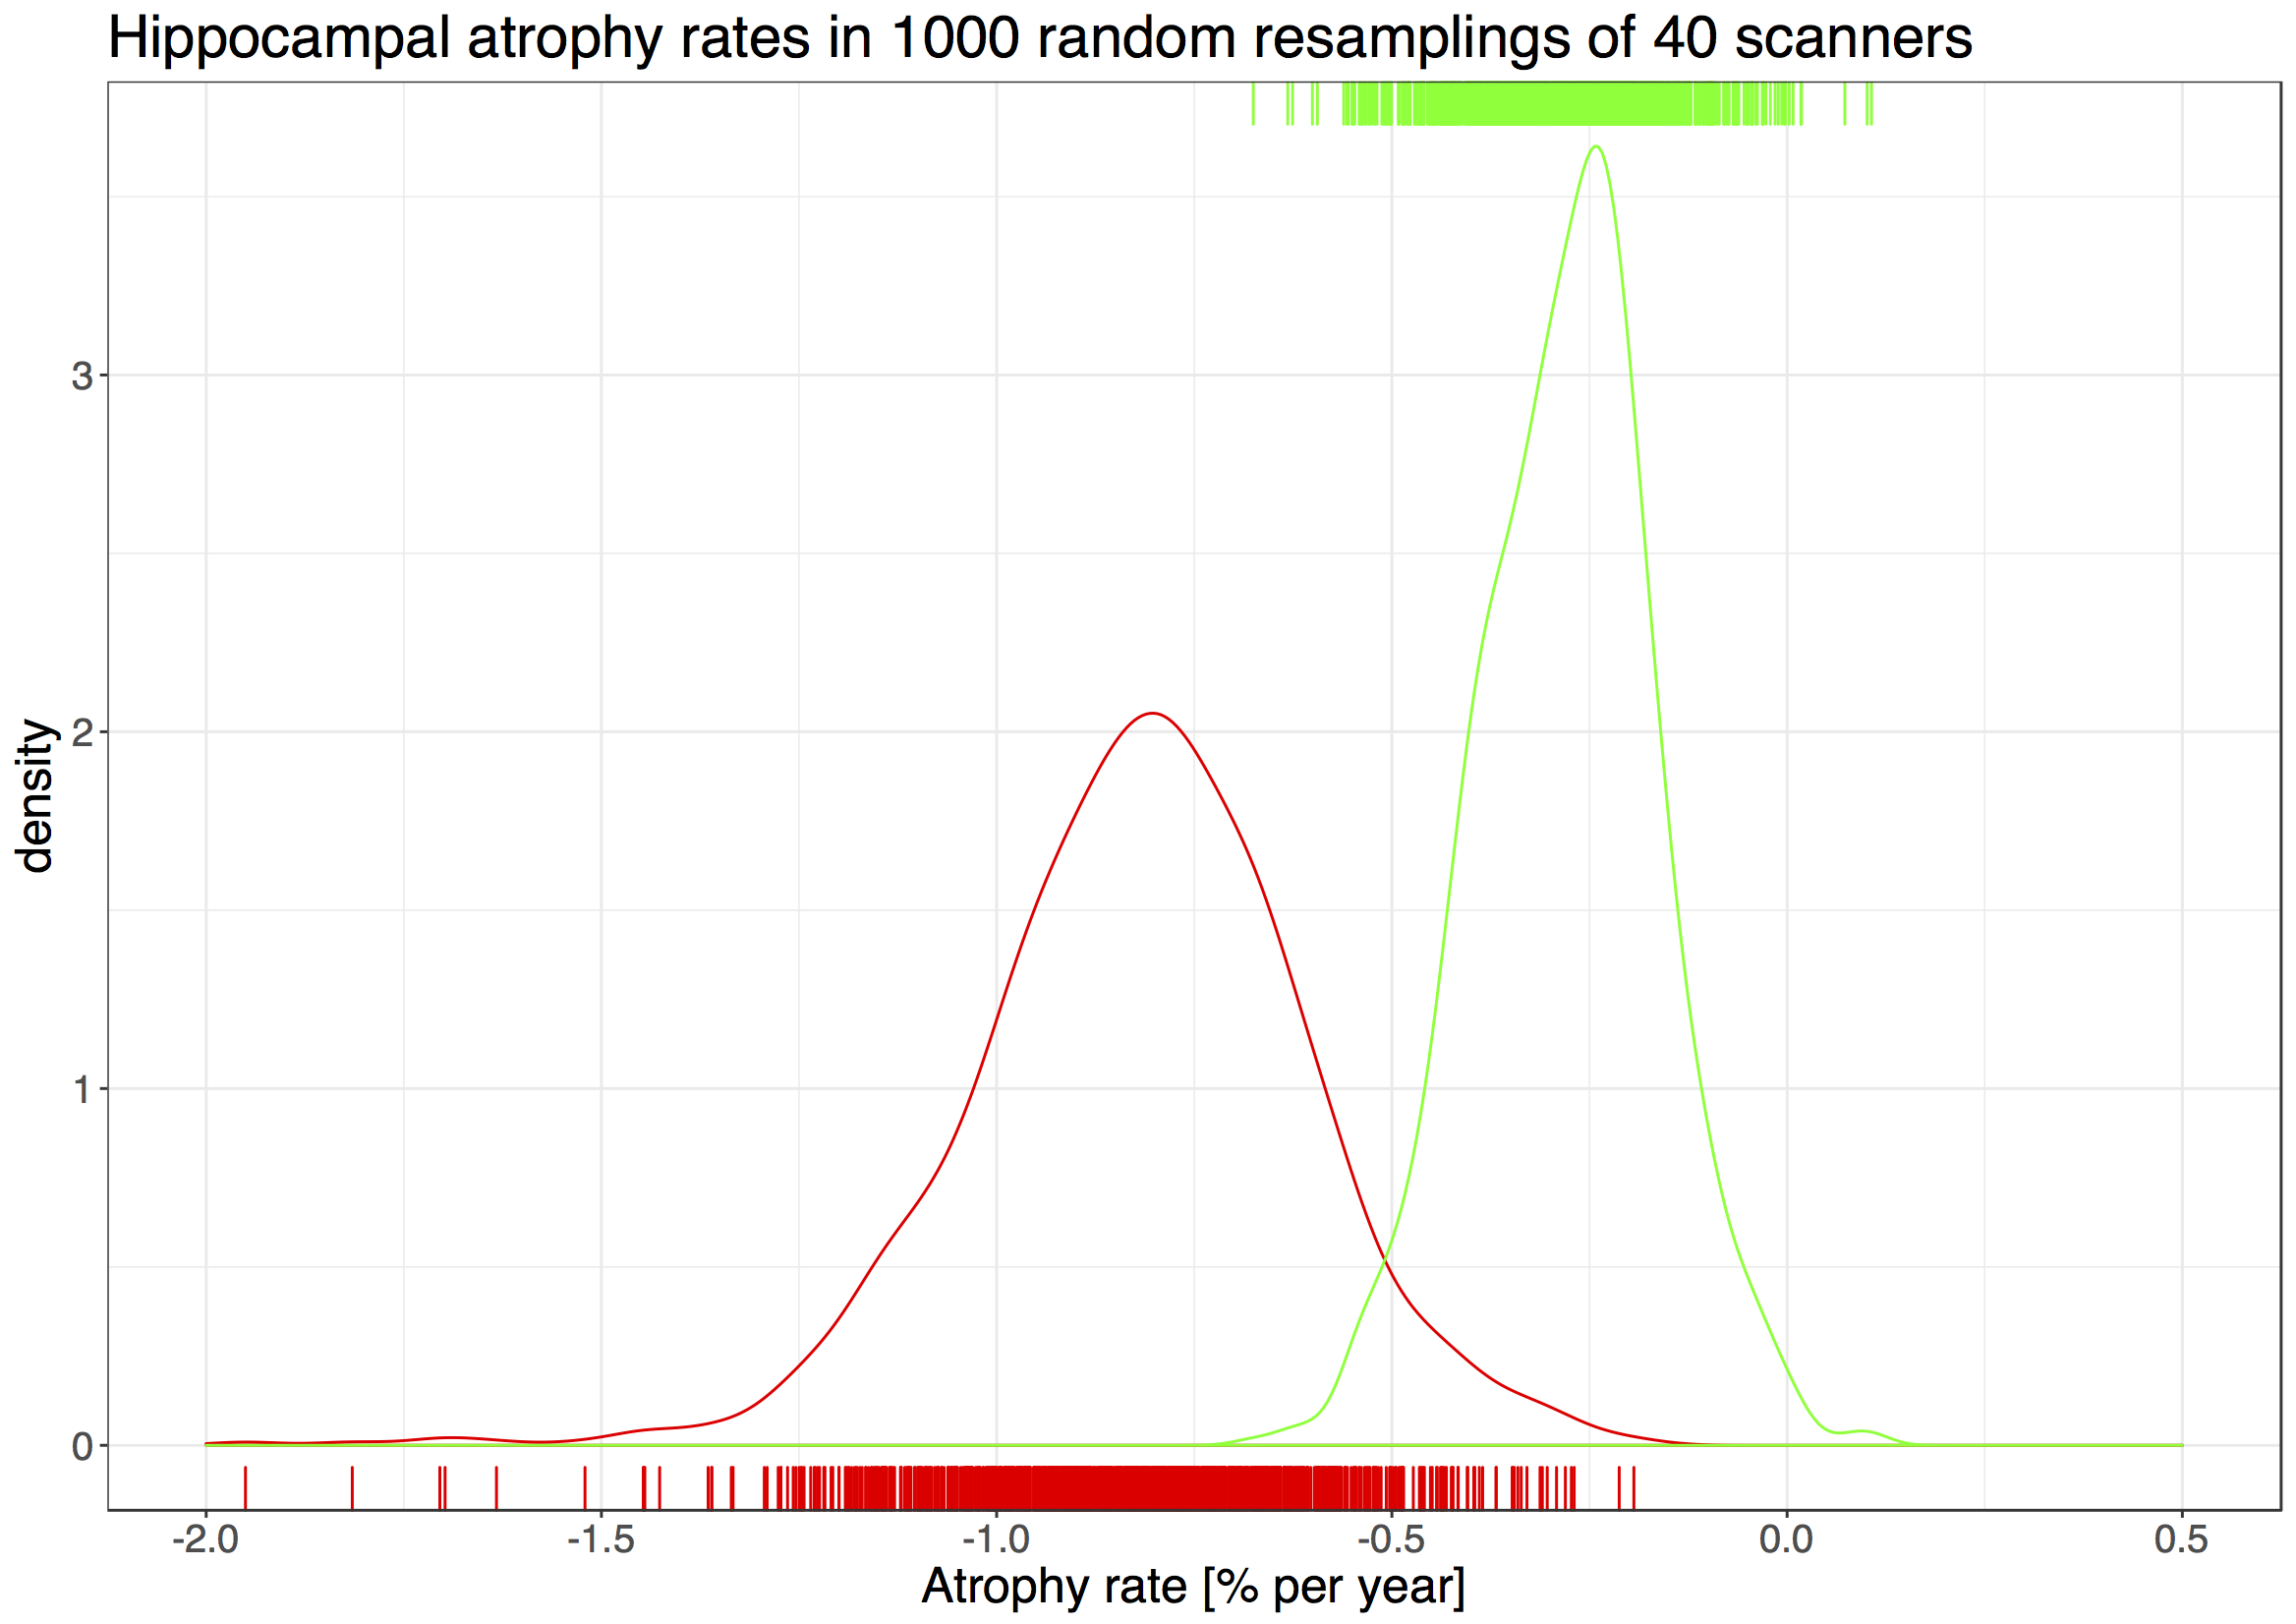
Over 1000 random resamplings of 40 scanners (median N(HC)=210, median N(AD)=76), estimated ΔNHV for HC had a median of -0.19% (IQR -0.28% - -0.13%), while estimates for AD had a median of -0.76 % (IQR -0.88% - -0.66%) (Figure 2). This is slightly lower but consistent with the literature, and larger variance of AD rates was previously reported1.
Experiment 2
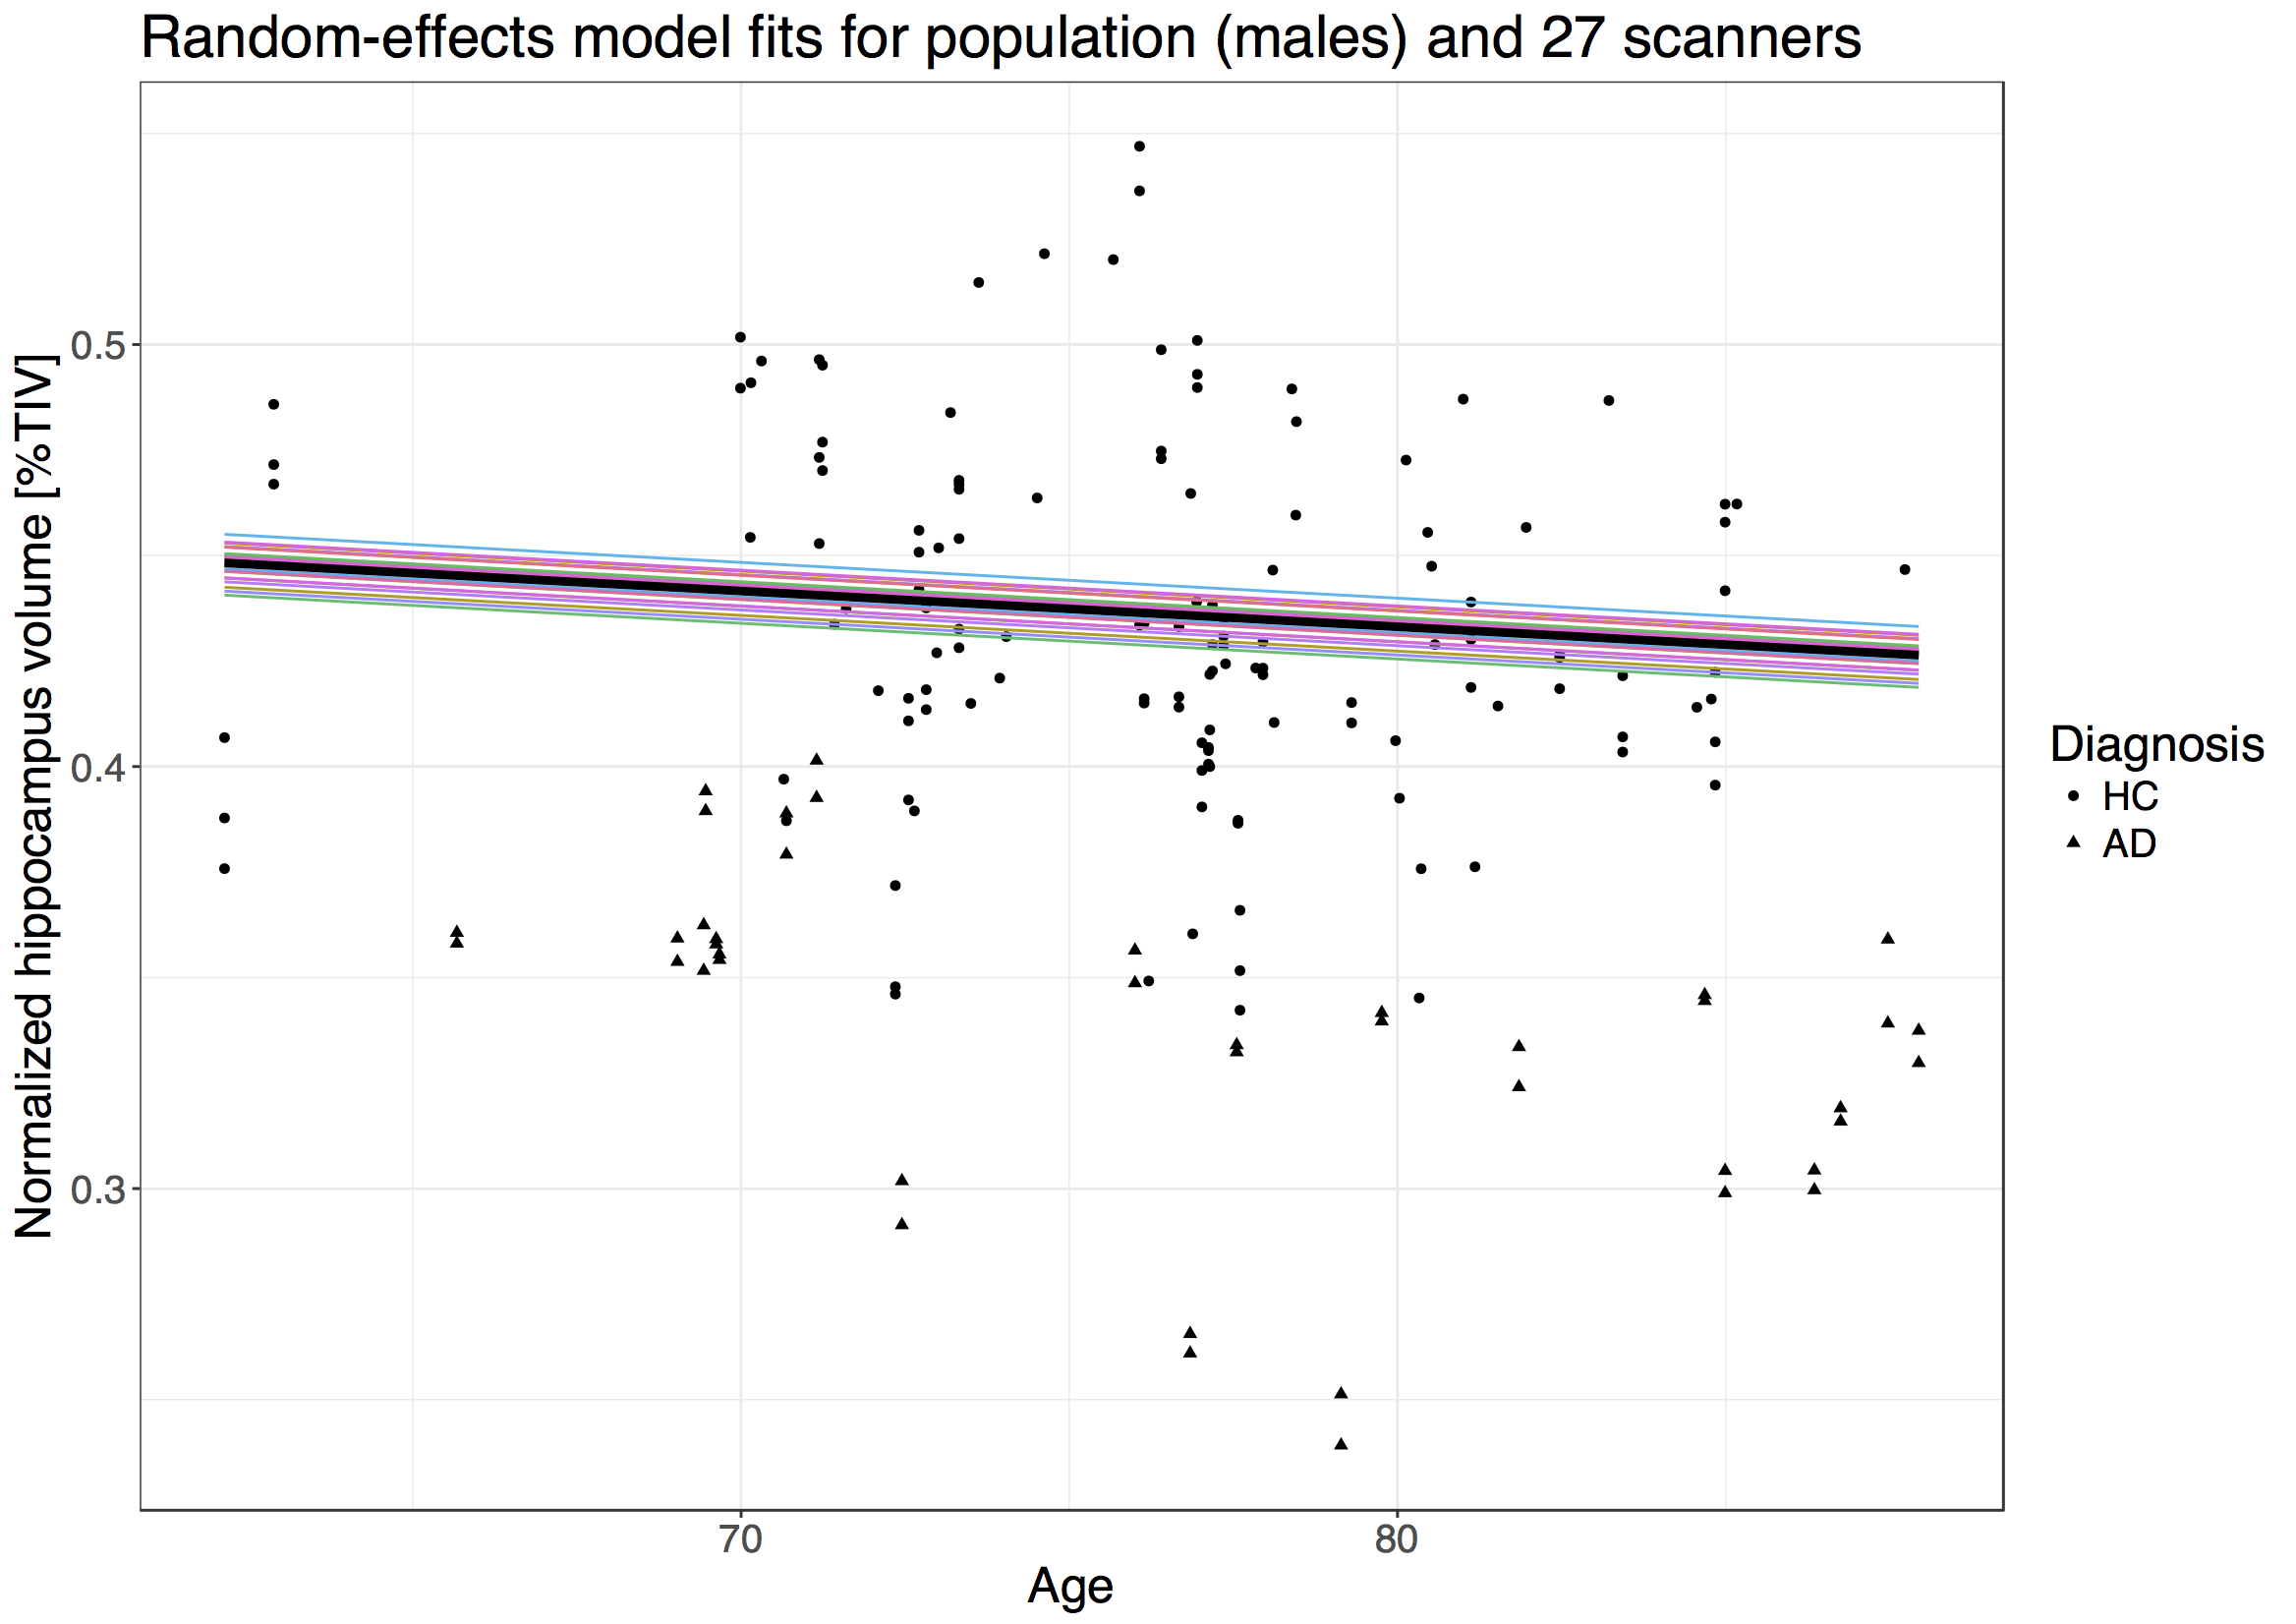
The estimated ΔNHV was -0.20 % (HC) and -0.79 % (AD). Scanner random effects had a standard deviation roughly 4 times smaller than subject random effects (Figure 3).
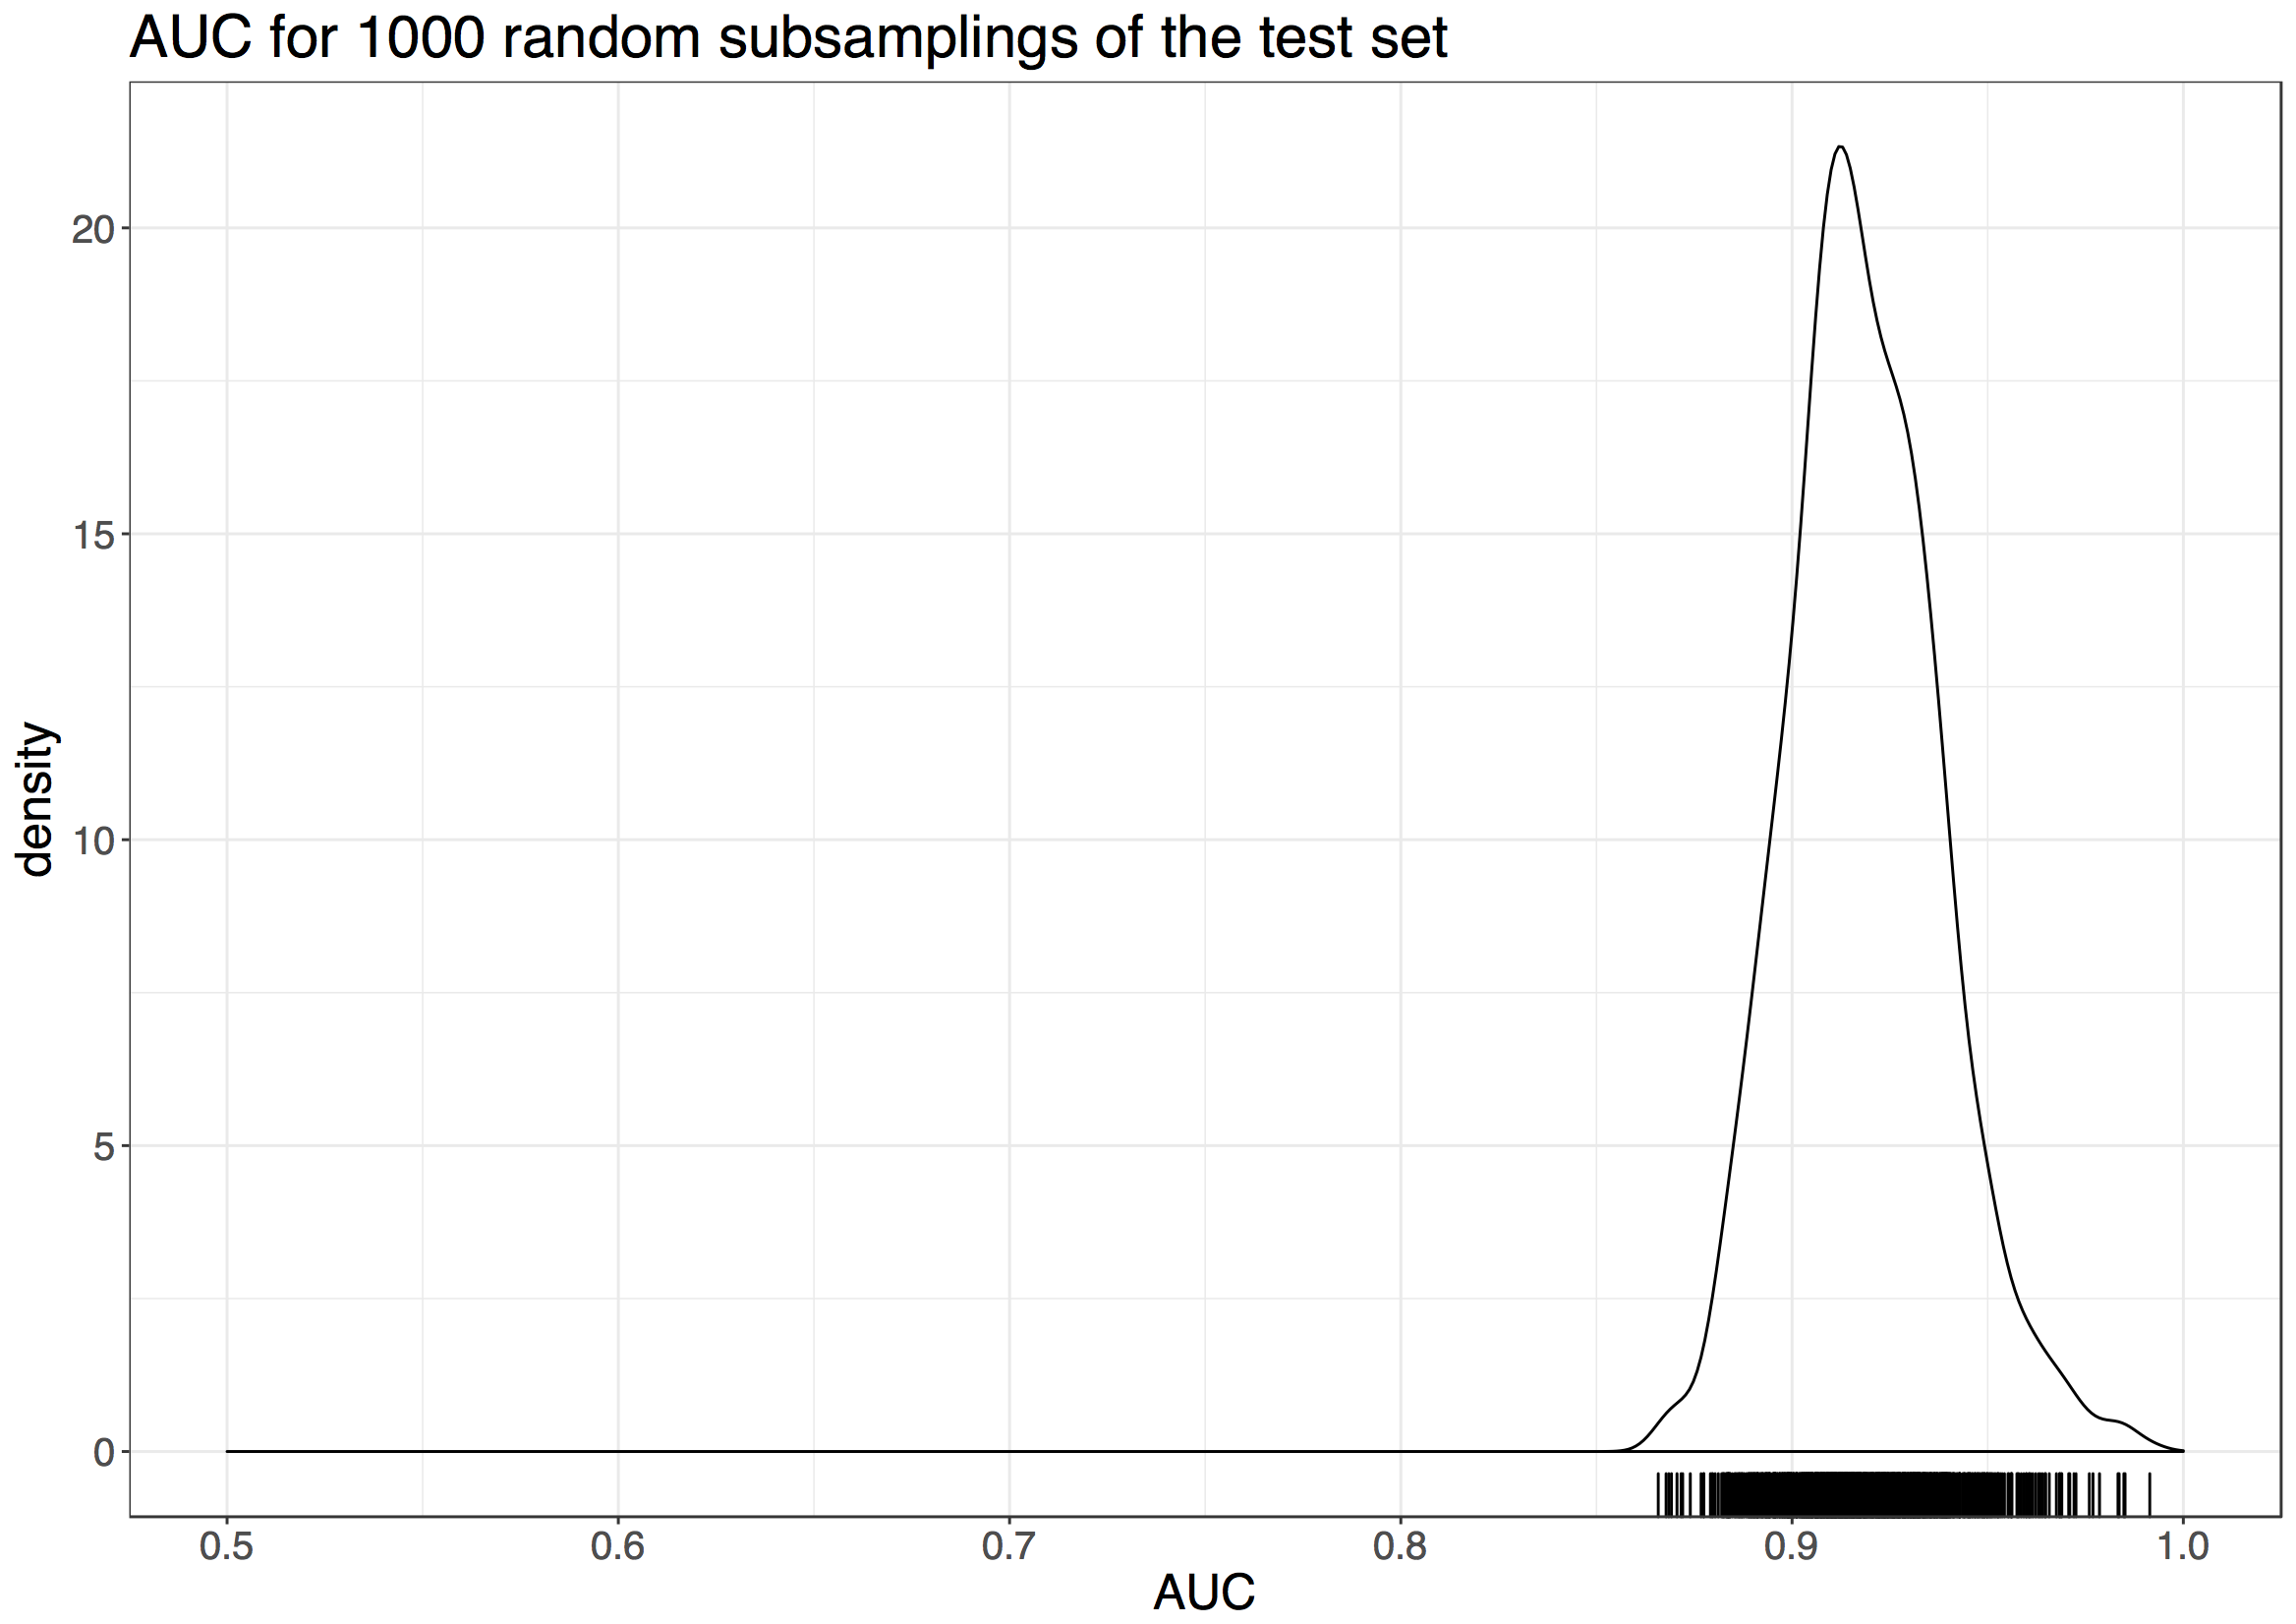
The 1000 Xte,s each had 26 scanners, with a median N(HC) of 138 (IQR 127-149) and a median N(AD) of 52 (IQR 44-60). All subsets gave good discriminative performance with a median AUC of 0.92 (IQR 0.91-0.93) (Figure 4). Note that this figure is in terms of scans, not individual subjects, and that there were repeated measurements for some subjects.
All measures of subject differences between Xtr and Xte,s, plus differences in CNRGC, Voxel size, and Vendor, were significantly associated with AUC, although explaining only 23.4% of variance. The confound-corrected model lowered variance explained to 15%, with a slightly lower AUC (median 0.9, IQR 0.89-0.92).
Conclusions
We showed that ΔNHV estimates fluctuate with dataset variability, and should be interpreted cautiously. However, practically, AD detection from NHV performs relatively well and is stable, even if scanner/subject differences explain some variation in performance.
This is promising since volume estimates from new hardware could be compared to reference ranges without unduly affecting diagnostic accuracy.
Acknowledgements
No acknowledgement found.References
1 Frisoni, G. B., Fox, N. C., Jack, C. R., Jr., Scheltens, P. & Thompson, P. M. The clinical use of structural MRI in Alzheimer disease. Nat Rev Neurol 6, 67-77, doi:10.1038/nrneurol.2009.215 (2010).
2 Schmitter, D. et al. An evaluation of volume-based morphometry for prediction of mild cognitive impairment and Alzheimer's disease. Neuroimage Clin 7, 7-17, doi:10.1016/j.nicl.2014.11.001 (2015).
3 Jack, C. R., Jr. et al. Update on the magnetic resonance imaging core of the Alzheimer's disease neuroimaging initiative. Alzheimers Dement 6, 212-220, doi:10.1016/j.jalz.2010.03.004 (2010).
4 ADNI. ADNI MRI protocols, <http://adni.loni.usc.edu/methods/documents/mri-protocols/>
5 Nakagawa, S., Schielzeth, H. & O'Hara, R. B. A general and simple method for obtainingR2 from generalized linear mixed-effects models. Methods in Ecology and Evolution 4, 133-142, doi:10.1111/j.2041-210x.2012.00261.x (2013).
Figures