3755
Fixel-based fiber-specific analysis of white matter lesions in Binswanger disease1The Mind Research Network, Albuquerque, NM, United States, 2Department of Neurology, University of New Mexico Health Sciences Center, Albuquerque, NM, United States
Synopsis
Binswanger's disease (BD) is a form of vascular dementia which is prevalent in older population. BD is characterized by the presence of white matter lesions due to injured small vessels in the brain. Magnetic resonance imaging findings related to BD reported large white matter lesions in FLAIR and high blood-brain barrier permeability in dynamic contrast enhanced MRI. Changes in water diffusion in white matter lesions and axonal damage were reported using diffusion tensor imaging metrics. While all the studies focused on exploring the voxel level measures as BD markers, we aimed to quantify the WM integrity through measures estimated for fibers within a voxel. In this study, we apply fixel-based analysis (FBA) to multi-shell diffusion data to evaluate the fiber specific measures such as fiber density (FD) and fiber cross-section (FC) in regions of white matter lesions in BD subjects and compared the measures with healthy controls. Reduced FD and FDC are revealed in areas of white matter lesions in BD subjects as compared to those in control group.
INTRODUCTION
Binswanger disease (BD) is a form of vascular dementia which is accompanied by neuro-inflammation, breakdown of blood brain barrier, and cerebral small vessel ischemia leading to extensive presence of white matter lesions1. In this study we apply multi-tissue constrained spherical deconvolution fixel-based analysis2 (FBA) method to multi-shell diffusion data for characterizing white matter damage in BD subjects. FBA decomposes crossing fibers in a voxel into distinct fiber bundles in each voxel. The differences in fiber density (FD), fiber cross-section (FC), and a combined measure FDC (=FDxFC) for each fiber bundle are analyzed between health controls (HC) and BD subjects. We compare each BD subject individually to group of controls because location of white matter damage can vary across BD subjects.METHODS
The diffusion data was acquired on a Siemens 3T TRIO scanner with three non-zero b-values (800, 1600, and 2400 s/mm2) with 165 gradient directions equally distributed across three b-values and eight b=0 values. For each non-zero b-value there were equal number of anterior-posterior and posterior-anterior phase-encoding directions for distortion correction. We studied 10 healthy controls and 6 BD subjects. The University of New Mexico Human Research Review committee approved the study. The BD subjects were individually compared to group of controls. The distortion and motion correction was done based on TOPUP and the EDDY programs from FSL software3. FBA analysis was performed using mrtrix3 software4. Each data set was bias-field corrected and up-sampled to 1.25 mm isotropic resolution to improve accuracy of spatial normalization. A tissue response function was found for each subject in voxel consisting of single direction pure white matter in an unsupervised manner. The average response function across subjects was used to calculate fiber orientation distribution function (fODF) for each subject based on multi-tissue constrained spherical deconvolution method5. A study specific fODF was found for group of healthy controls by non-linear diffeomorphic registration. The fODF of each subject was then non-linearly warped to the study template. The fiber bundle measures (FD, FC, and FDC) were calculated for each subject based on warped fODF. The regions of WML were analysed by comparing the histograms of FD, FC and FDC measures between control group and each of the BD subject.RESULTS
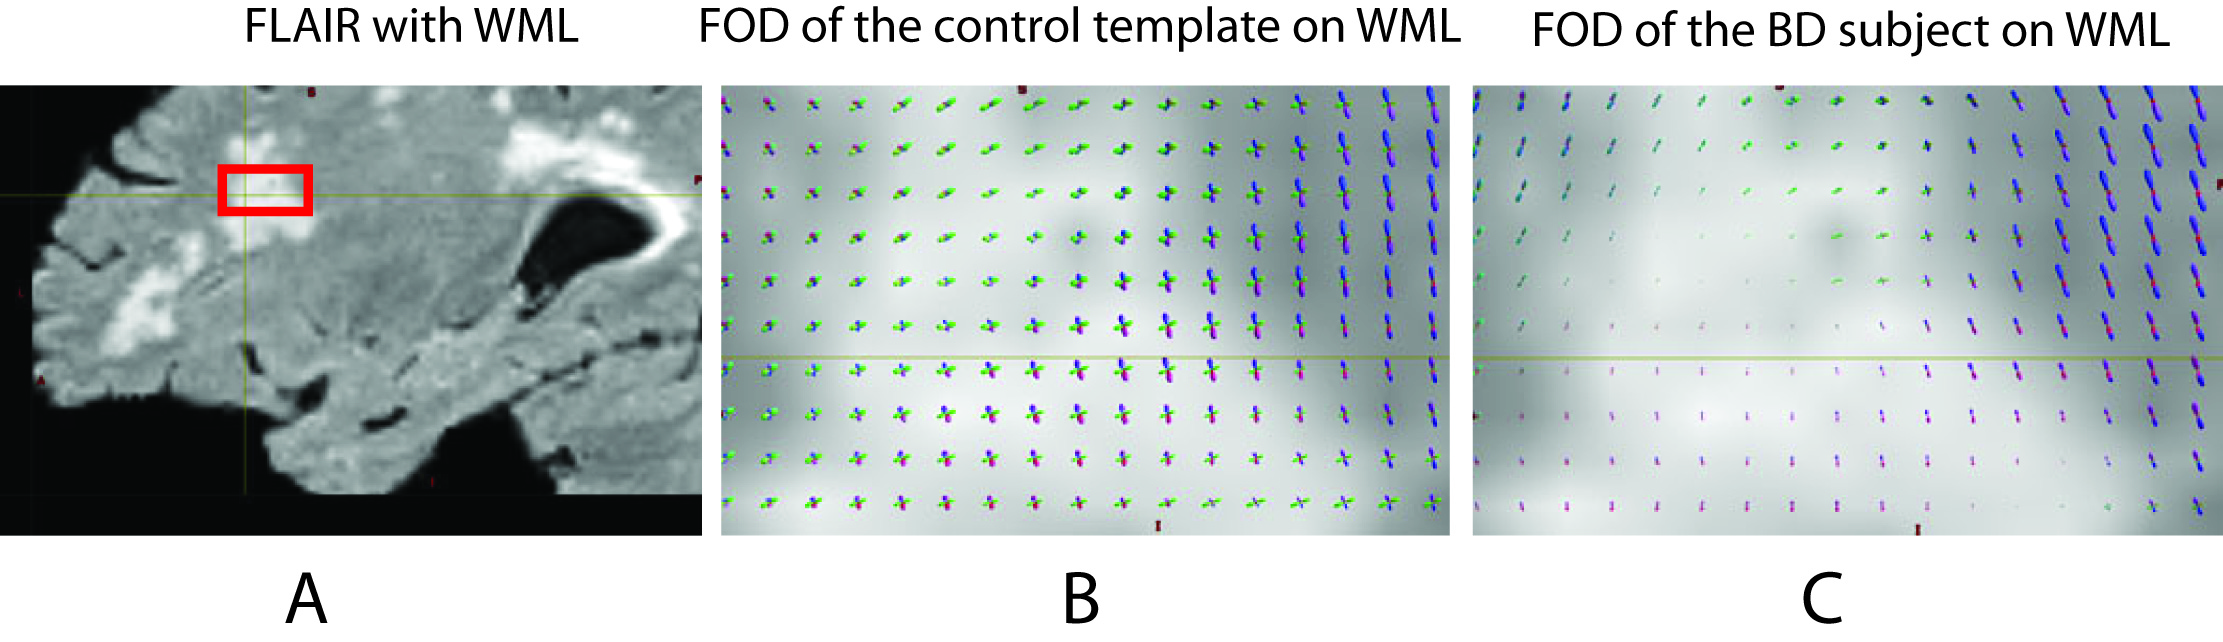
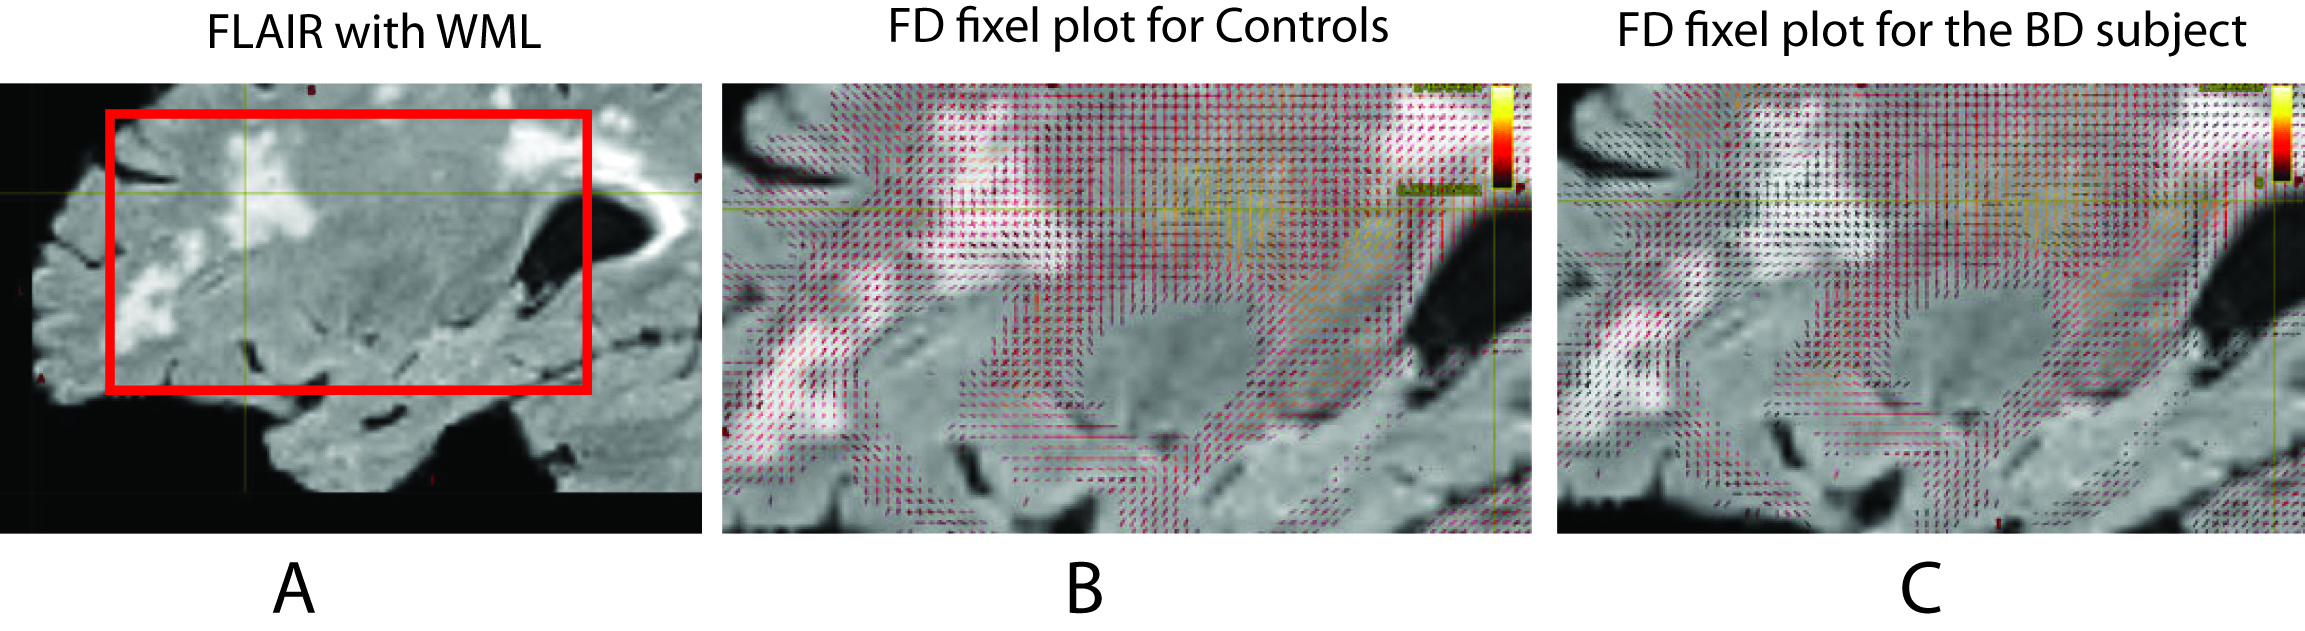
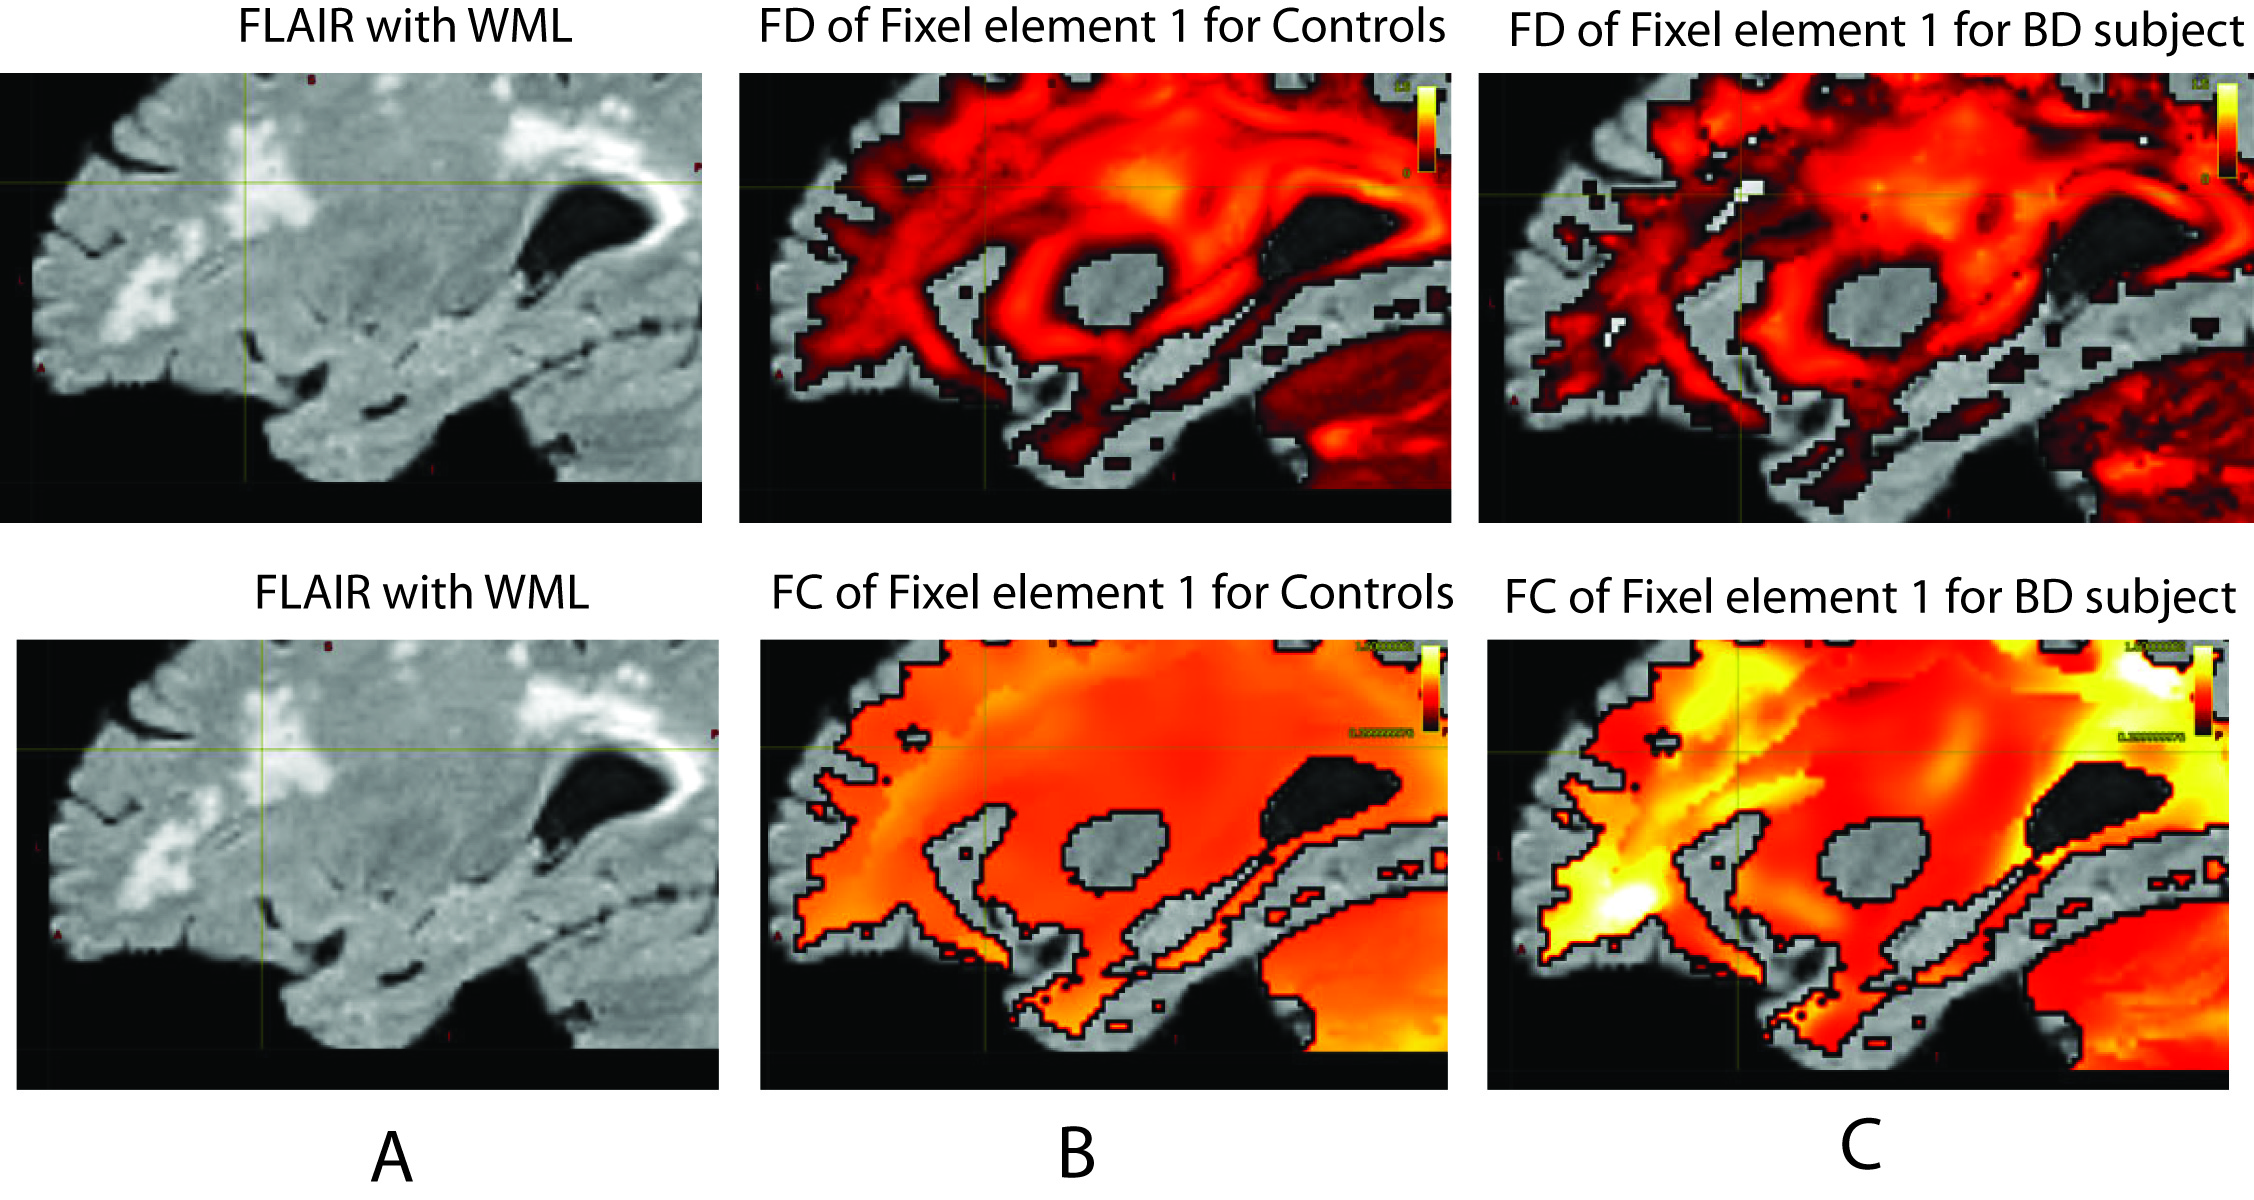
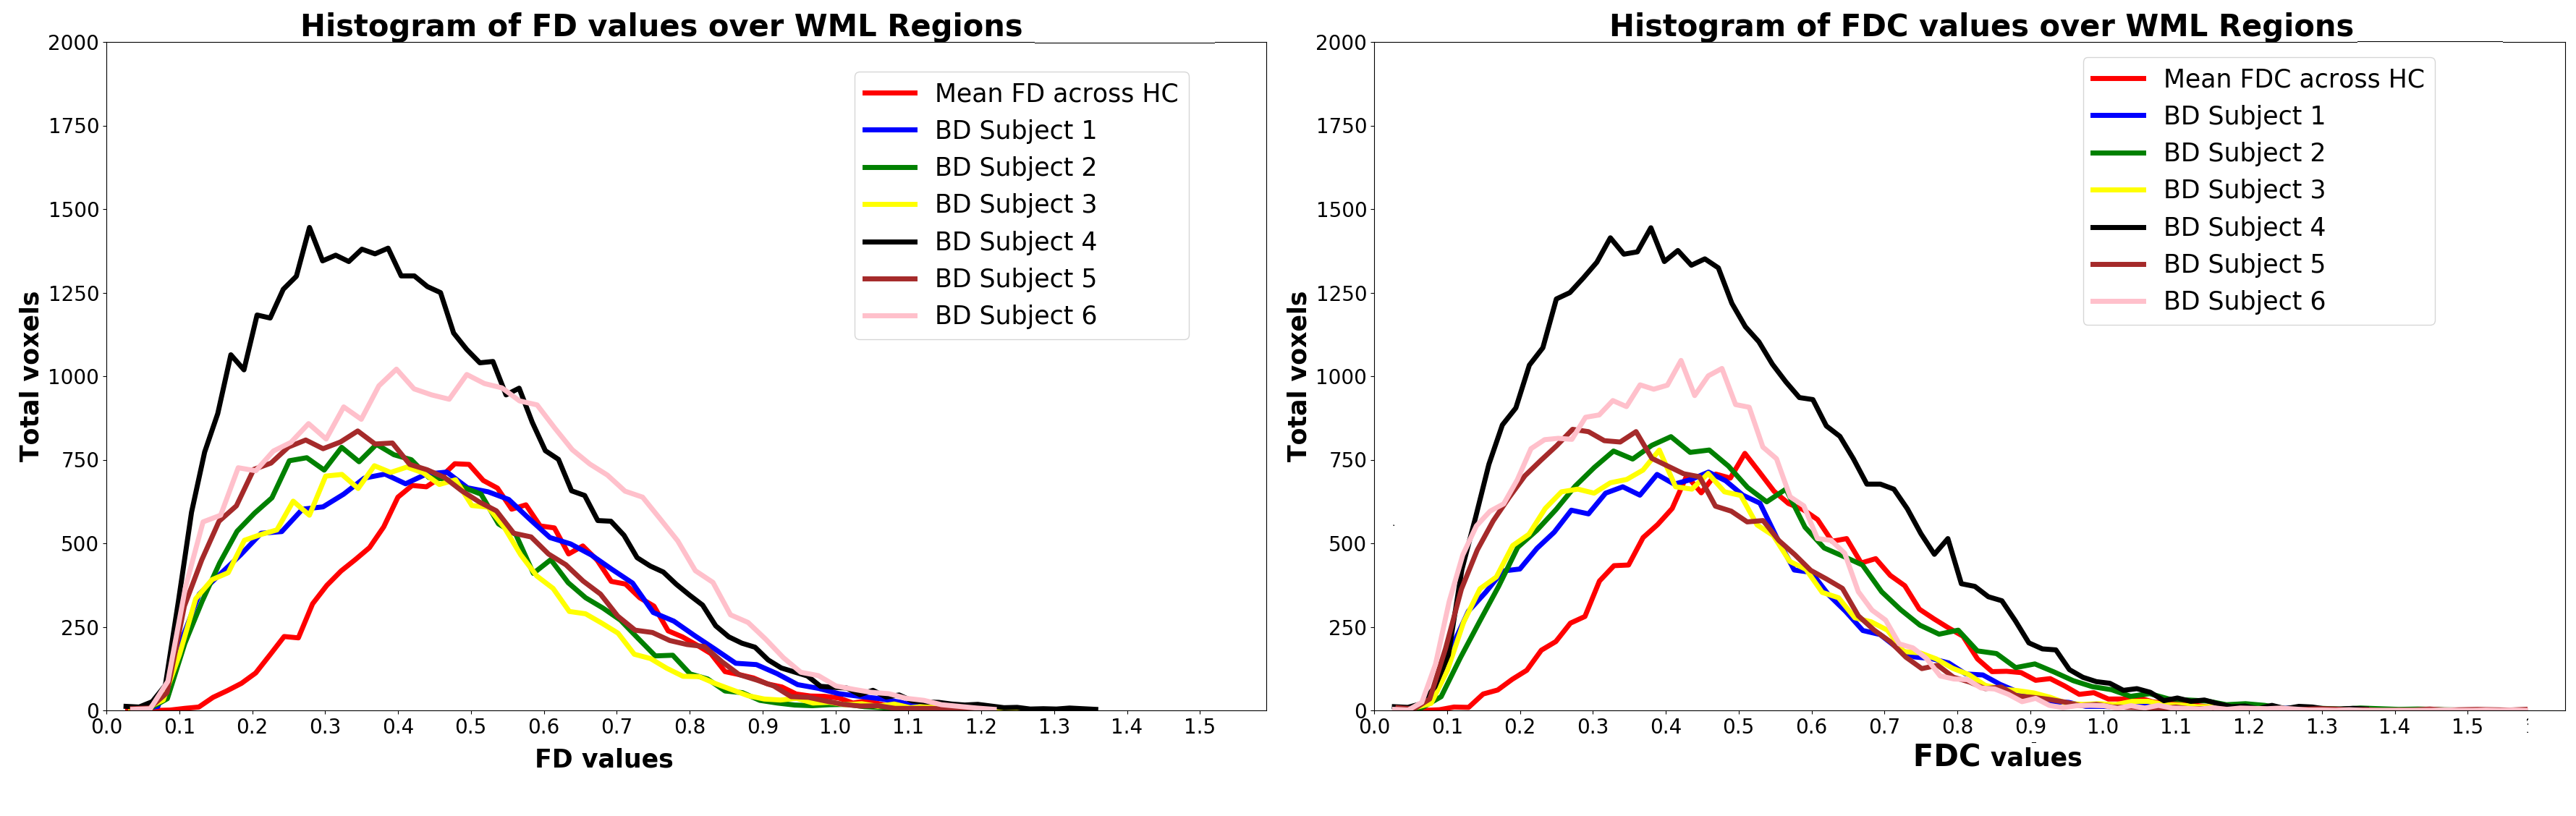
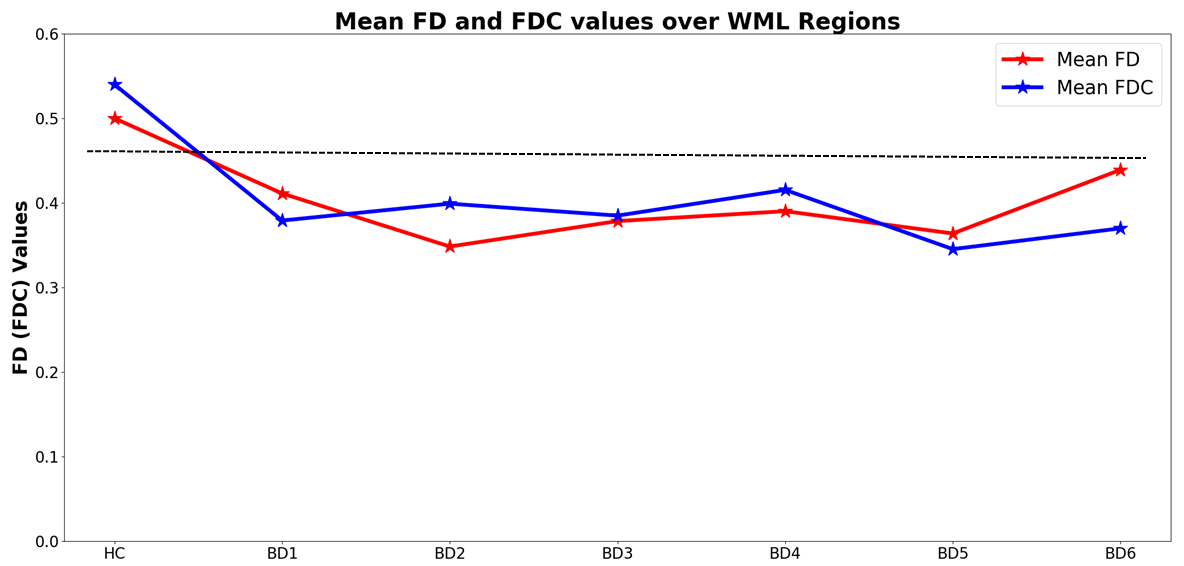
Figure 1 compares the difference in fODF for the control template and a BD subject over the white matter lesion defined by the FLAIR image. The flair image of a BD subject is shown as background image in Figures 1-3 to visually compare fibers inside WML regions. Figure 2 shows the fixel plot for FD. The color scales indicates fiber density with black being the lowest. FD decreases in the WML as seen by the change in colors from red to black. Figure 3 shows plots of the first fixel element for FD and FC. A similar plot is not shown for FDC because of its visual similarity to the FD plot. The scale of Figure 3 was chosen to visually emphasize the increase. FD decreases in regions of WML as is to be expected but FC increases in and around white matter lesions. The differences in the range of FD, FDC and FC values in the WML regions are shown as histograms in Figure 4. The voxels for the histogram of healthy control group were extracted from WML voxel positions of a representative BD subject. The shift in the histogram peaks of BD as compared to that of HC is shown. The decreasing patterns of FD and FDC measures are illustrated in Figure 5. Mean of FD and FDC values calculated over the voxels extracted from WML regions are plotted for the control group and each of the BD subject. The dotted line shows a clear distinction between the mean values of control group and BD subjects.DISCUSSION AND CONCLUSION
The advent of multi-shell imaging allows us to model crossing fibers in a voxel and estimate properties of different fiber populations in a voxel. We have shown that FD and FDC are sensitive parameters for characterizing white matter damage. Changes observed in FC are inconsistent and hard to explain. We have a limited number of BD subjects. This requires careful evaluation of FC to find the source of variations in the FC pattern between BD subjects. The BD subjects exhibit large volumes of WML. The decrease in values of FD and FDC for BD subjects makes these measures potential markers for diagnosis of BD. There are other models to explain multi-shell data (such as NODDI) and a comparison with standard parameters such as FA and MD is warranted for white matter characterization.Acknowledgements
This research was supported by NIH grant UH2NS100598.References
- Huisa BN, Rosenberg GA., 2014. Binswanger’s disease: Toward a diagnosis agreement and therapeutic approach. Expert Rev Neurother. 14, 1203–1213. 2.
- Raffelt, D. A., Tournier, J. D., Smith, R. E., Vaughan, D. N., Jackson, G., Ridgway, G. R., Connelly, A., 2017. Investigating white matter fibre density and morphology using fixel-based analysis. Neuroimage. 144, 58-73.
- S.M. Smith, M. Jenkinson, M.W. Woolrich, C.F. Beckmann, T.E.J. Behrens, H. Johansen-Berg, P.R. Bannister, M. De Luca, I. Drobnjak, D.E. Flitney, R. Niazy, J. Saunders, J. Vickers, Y. Zhang, N. De Stefano, J.M. Brady, and P.M. Matthews., 2004. Advances in functional and structural MR image analysis and implementation as FSL. NeuroImage, 23(S1), 208-219.
- Tournier, J., Calamante, F., & Connelly, A., 2012. MRtrix: diffusion tractography in crossing fiber regions. International Journal of Imaging Systems and Technology, 22(1), 53-66.
- Jeurissen, B., Tournier, J. D., Dhollander, T., Connelly, A., Sijbers, J., 2014. Multi-tissue constrained spherical deconvolution for improved analysis of multi-shell diffusion MRI data. Neuroimage 103, 411-426.
Figures