3753
White matter free water content at different stages of Alzheimer’s disease1Imeka Solutions, Inc, Sherbrooke, QC, Canada, 2Clinical & Translational Imaging, Pfizer, Inc, Cambridge, MA, United States, 3Sherbrooke Connectivity Imaging Laboratory (SCIL), University of Sherbrooke, Sherbrooke, QC, Canada, 4Computer Science, University of Sherbrooke, Sherbrooke, QC, Canada, 5ECD Non-Clinical Statistics, Pfizer, Inc, Cambridge, MA, United States, 6Internal Medicine Research Unit, Pfizer, Inc, Cambridge, MA, United States
Synopsis
Recent evidence shows that neuroinflammation plays a role in many
neurological diseases including Alzheimer’s disease (AD), and that free water
(FW) diffusion imaging can be sensitive to this phenomenon. We processed MRI data
from the ADNIGO and ADNI2 databases with a state-of-the-art processing pipeline
that uses T1 weighted (T1w), diffusion weighted (DW), and fluid-attenuated
inversion recovery (FLAIR) scans to extract FW fractional volume in normal
appearing white matter. We call this metric relative FW volume (rFW volume). We
demonstrate for the first time that rFW volume in white matter is higher for
subjects with greater cognitive impairments.
Introduction
Free water fractional volume, computed from diffusion MRI, models the fraction of the diffusion signal explained by isotropically unconstrained water1. In white matter this measurement represents either FW in extracellular space around axons or FW contamination from cerebrospinal fluid in adjacent voxels. Elevated FW in white matter has been suggested to indicate neuroinflammation2 and prior studies indicate that neuroinflammation plays a role in many neurological diseases3,4 including AD5,6. In this study we investigate differences in FW in white matter in subjects ranging from those with no cognitive impairment to AD, taken from ADNIGO and ADNI2. We also explore whether this global measure of FW fractional volume is different at baseline for subjects who progress from normal control (NC) or mild cognitive impairment (MCI) to a more advanced stage.
Methods
We identified subjects with complete T1w, DW, and FLAIR scans at two 24-month-spaced time points from the ADNIGO and ADNI2 databases. The DW scans were acquired along 41 evenly distributed directions using a b-value of 1000 s/mm2 with a 1.3x1.3.x2.7mm spatial resolution. The T1w and FLAIR scans were acquired at 1.2x1.05x1.05 and 0.85x0.85x5 mm spatial resolution, respectively.
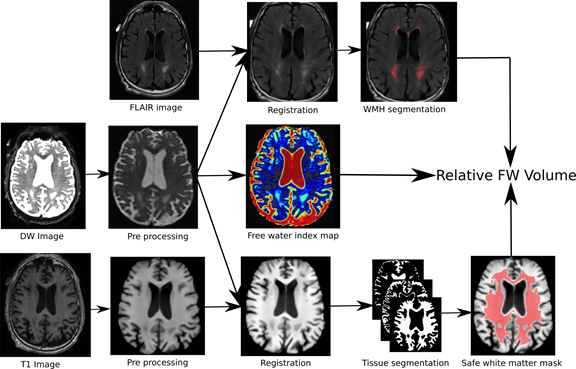
The processing pipeline is illustrated in Figure 1. After the T1w and DW images are preprocessed (denoising, brain extraction, N4 correction), the T1w image is nonlinearly registered to native diffusion space. Tissue segmentation is then performed on the transformed T1w to obtain a binary map of the cerebrospinal fluid (CSF), grey matter, and white matter. Using these maps a “safe white matter mask” is built to prevent any CSF contamination in regions susceptible to partial volume effects. Using the FLAIR and T1w images, a binary map of the white matter hyperintensities (WMH) is also computed. A FW fractional volume map is then obtained by fitting a bi-tensor model on each voxel of the DW image1. The safe white matter mask, the WMH mask, and FW map are then combined to extract the relative FW volume (rFW volume). This rFW volume is the total volume of FW voxels in the “normal appearing” portion of the safe white matter with values greater than 0.1, divided by the total volume of the safe white matter mask. This threshold was chosen to minimize the impact of noise on this summary parameter. All processing was done using a Nextflow7 pipeline with all software dependencies bundled in a Singularity8 container ensuring quick and easy reproducibility of the results.
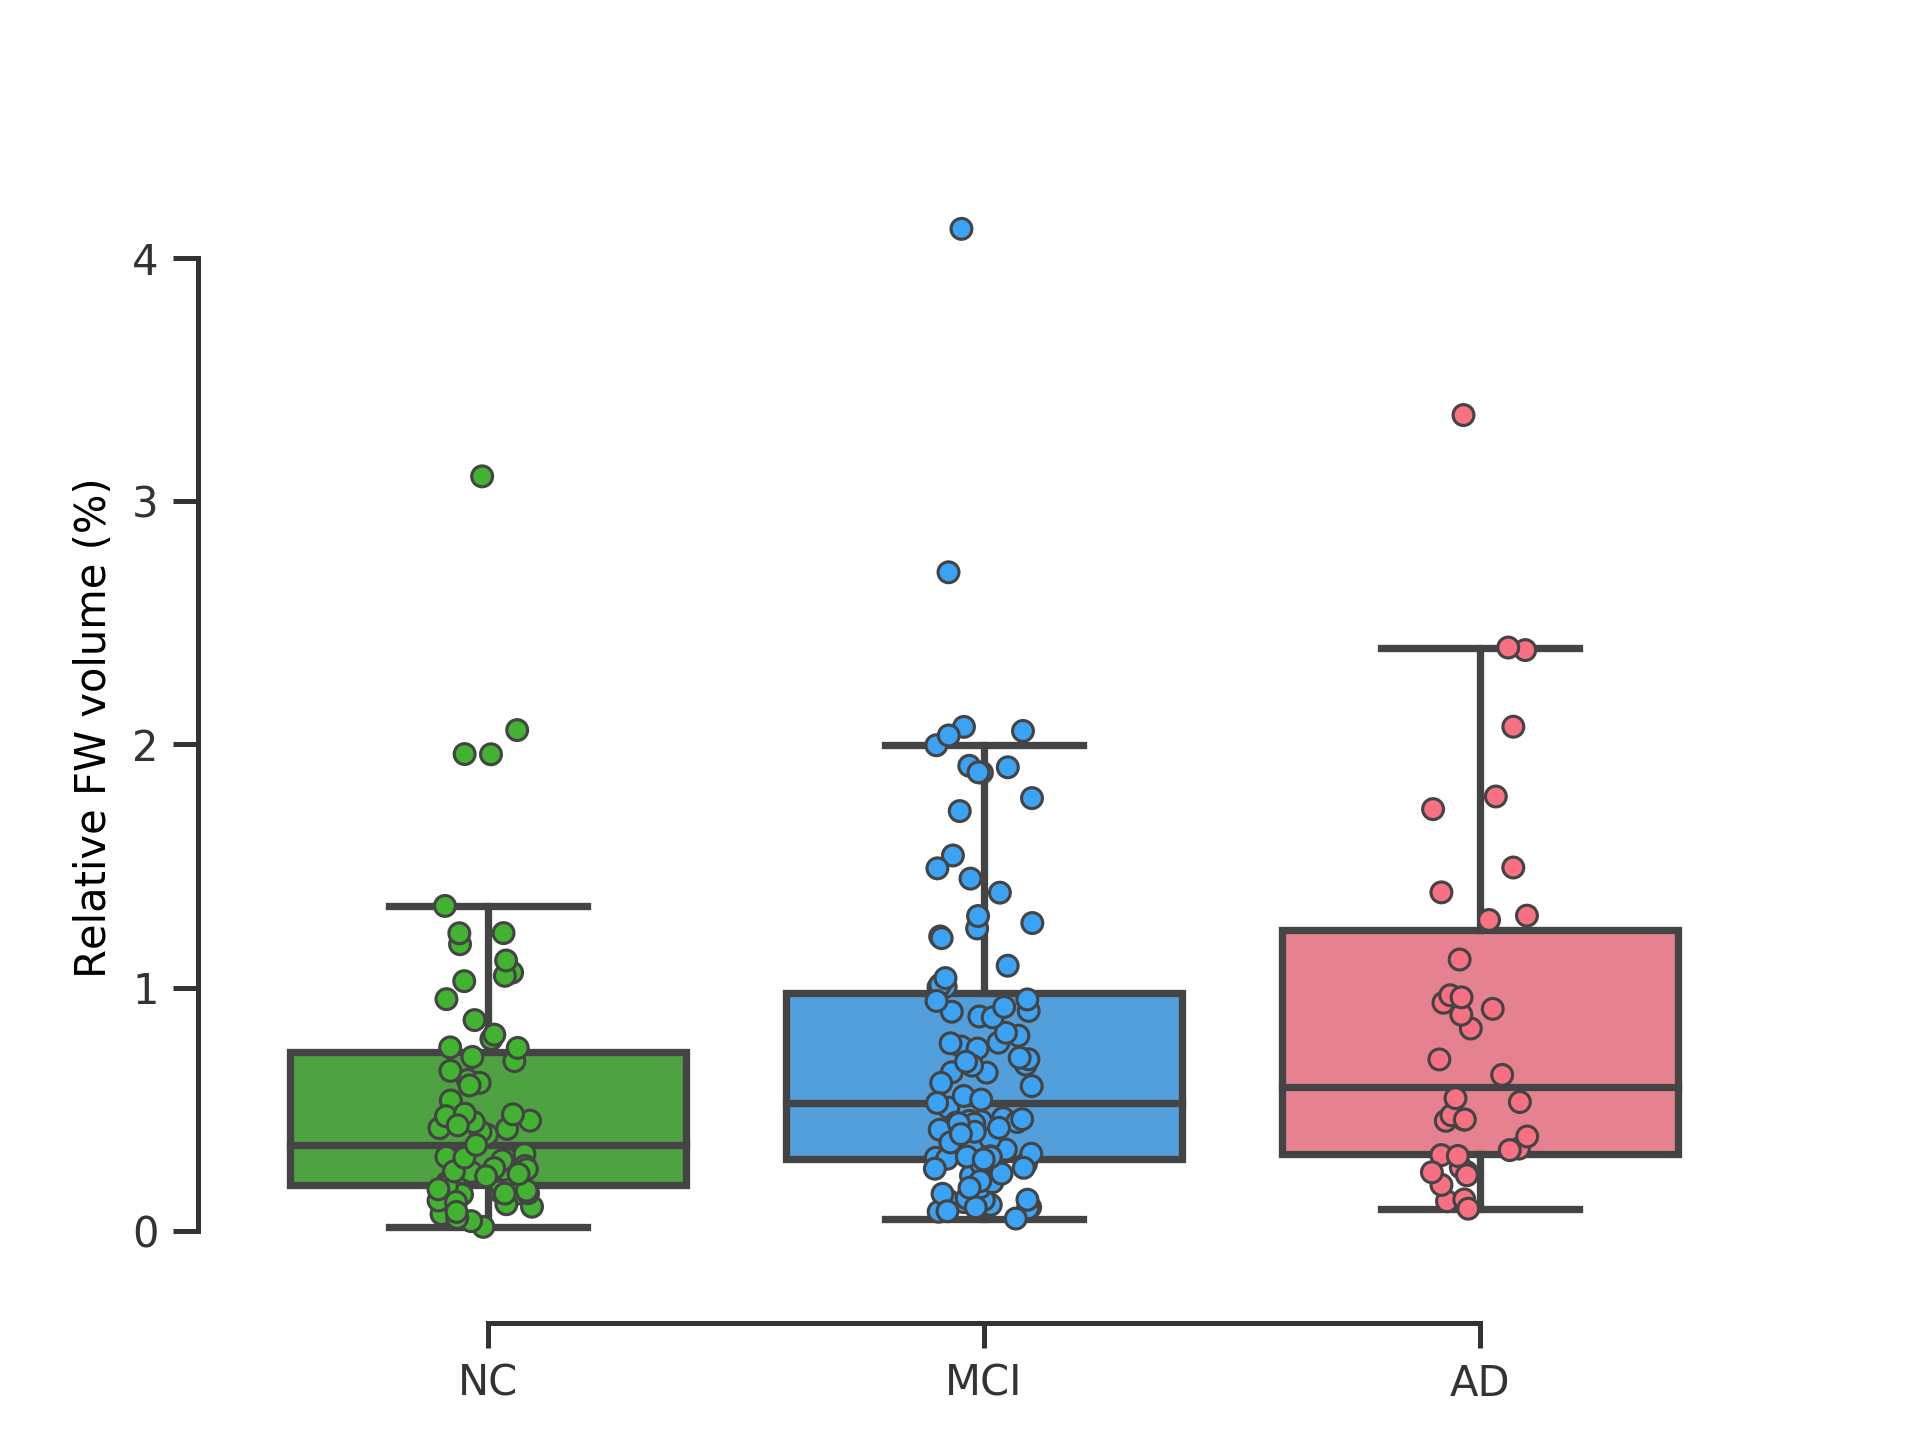
A cross-sectional analysis was performed at the first available time point comparing NC (n=71), MCI (n=103), and AD (n=38). Group results were compared with an ANOVA test followed by a post-hoc pairwise Tukey test to assess differences in sub groups. An analysis was also performed to determine whether the rFW volume at the first available time point predicted, in isolation, conversion to a more advanced stage 24 months later. A log transformation was applied to the rFW volume metric to improve normality of the distribution before analyses.
Results
Figure 2 illustrates the rFW volume for each group at the first available time point. The ANOVA showed a significant effect of group (F(2, 209)=5.06, p = 0.0071). Although post-hoc tests indicated that rFW volume in MCI and AD was not significantly different (p = 0.56), rFW volume was significantly higher in AD when compared to NC (p = 0.011), as well as in MCI when compared to NC (p = 0.035). Simple t-tests comparing the first available measurement of rFW volume for stable subjects versus converting subjects 24 months later (NC-stable, n=68 versus NC-convert, n=3 and MCI-stable, n=85 versus MCI-convert, n=18) did not show significant differences on the present measure of global rFW volume.
Conclusion
This study demonstrates that rFW volume in white matter is significantly higher in AD patients when compared to NC as well as in MCI compared to NC. We intend to extend this work with analyses of FW fraction of specific white matter bundles and parts of bundles affected by neuroinflammation since regionally specific effects are likely9. We are also planning characterization of rFW volume changes over time. This added specificity could help differentiate those older adults who will remain relatively stable and those who will progress to AD, which has utility for patient selection and stratification of subjects in preclinical stages of AD.
Acknowledgements
No acknowledgement found.References
Pasternak O, Sochen N, Gur Y, Intrator N, Assaf Y: Free water elimination and mapping from diffusion MRI Magn Reson Med. 2009;62(3):717-30.
Pasternak O, E. Shenton M, Westin C-F. Estimation of Extracellular Volume from Regularized Multi-Shell Diffusion MRI. Med Image Comput Comput Assist Interv. 2012; 15(0 2): 305–312.
Edward Ofori Ofer Pasternak Peggy J. Planetta Hong Li Roxana G. Burciu Amy F. Snyder Song Lai Michael S. Okun and David E. Vaillancourt: Longitudinal changes in free-water within the substantia nigra of Parkinson's disease. Brain. 2015; 138(8): 2322–2331.
Ofori E, Pasternak O, Planetta PJ, Burciu R, Snyder A, Febo M, Golde TE, Okun MS, Vaillancourt DE: Increased free water in the substantia nigra of Parkinson's disease: a single-site and multi-site study. Neurobiol Aging. 2015;36(2):1097-104.
Hensley K. Neuroinflammation in Alzheimer’s Disease: Mechanisms, Pathologic Consequences, and Potential for Therapeutic Manipulation. J Alzheimers Dis 2010;21(1):1-14.
Heneka MT, Carson MJ, El Khoury J, Landreth GE, Brosseron F, Feinstein DL, Jacobs AH, Wyss-Coray T, Vitorica J, Ransohoff RM, Herrup K, Frautschy SA, Finsen B, Brown GC, Verkhratsky A, Yamanaka K, Koistinaho J, Latz E, Halle A, Petzold GC, Town T, Morgan D, Shinohara ML, Perry VH, Holmes C, Bazan NG, Brooks DJ, Hunot S, Joseph B, Deigendesch N, Garaschuk O, Boddeke E, Dinarello CA, Breitner JC, Cole GM, Golenbock DT, Kummer MP: Neuroinflammation in Alzheimer's disease. Lancet Neurol. 2015;14(4):388-405
Di Tommaso, P., Chatzou, M., Floden, E. W., Barja, P. P., Palumbo, E., & Notredame, C. (2017). Nextflow enables reproducible computational workflows. Nature Biotechnology, 35(4), 316–319.
Kurtzer GM, Sochat V, Bauer MW (2017) Singularity: Scientific containers for mobility of compute PLoS ONE 12(5): e0177459.
Montal V, Vilaplana E, Alcolea D, Pegueroles J, Pasternak O, González-Ortiz S, Clarimón J, Carmona-Iragui M, Illán-Gala I, Morenas-Rodríguez E, Ribosa-Nogué R, Sala I, Sánchez-Saudinós MB, García-Sebastian M, Villanúa J, Izagirre A, Estanga A, Ecay-Torres M, Iriondo A, Clerigue M, Tainta M, Pozueta A, González A, Martínez-Heras E, Llufriu S, Blesa R, Sanchez-Juan P, Martínez-Lage P, Lleó A, Fortea J. Cortical microstructural changes along the Alzheimer's disease continuum. Alzheimers Dement. (In Press). doi: 10.1016/j.jalz.2017.09.013.
Figures