3751
Loss of Intra- and Inter-Network Resting State Functional Connectivity in Patients with Mild and Moderate Alzheimer’s Disease1Department of Radiology, First Central College,Tianjin medical university, Tianjin, China, 2Department of Radiology, Tianjin Hospital, Tianjin, China, 3Academy of Medical Engineering and Translational Medicine, Tianjin University, Tianjin, China, 4MR Collaboration NEA, Siemens Healthcare, Beijing, China, 5Department of Radiology, Tianjin first center hospital, Tianjin, China
Synopsis
This study aimed to investigate the differences in the alteration of the entire brain network functional connectivity of mild and moderate AD patients based on fMRI, taking the cerebellum network into consideration. There have seldom been reports regarding the cerebellum and cerebral connectivity alteration during the progression of clinical AD. Moreover, the cerebellum network functional connectivity is significantly changed in moderate AD, and we further suspected that the cerebellum network is a pivotal one in the progression to the moderate AD stage.
INTRODUCTION
Alzheimer’s disease (AD) is the primary cause of dementia. Clinical Alzheimer’s disease (AD), from the mild stage to death, is characterized by a gradual but significant destruction in cognitive function, such as executive function, language and visuo-spatial functions, particularly during the progression from the mild clinical stage to the moderate clinical stage1.The mechanism of the progression of AD remains unclear. Functional imaging studies have found that AD is associated with complex neural disconnection among intrinsic brain networks that ordinarily remain coordinated and connected2. However, there have seldom been reports about whole brain, large-scale network functional connectivity alterations during the progression of the mild to moderate stages of clinical AD3 .The purpose of this study was to explore the alteration in entire brain intra- and inter-network resting state functional connectivity in patients with mild AD and moderate AD, assessed through functional magnetic resonance imaging (fMRI).METHODS
A total of fourteen patients with mild AD, fifteen with moderate AD and 25 normal controls (NC) were selected to undergo a resting-state fMRI scan. All the fMRI data were acquired on a MAGNETOM Trio a Tim system 3T MR scanner (Siemens Healthcare, Erlangen, Germany). Based on whole brain fMRI data, the whole brain was divided based on the AAL Atlas into 116 regions, and six previously well-defined4 resting-state networks (RSNs) were extracted: the default mode network (DMN), the fronto-parietal network (FPN), the sensorimotor network (SMN),the occipital network (OCC),the cingulo-opercular network (CON), and the cerebellum network (CER). We identified abnormal connectivity by comparing the correlation coefficients of each connectivity pair before investigating altered functional connectivity (FC) at the brain network level in mild AD and moderate AD. The differences were compared among the three groups by one-way ANOVA. If significant differences existed, a post-hoc t-test was performed between the mild AD and NC groups and the moderate AD and NC groupsRESULTS
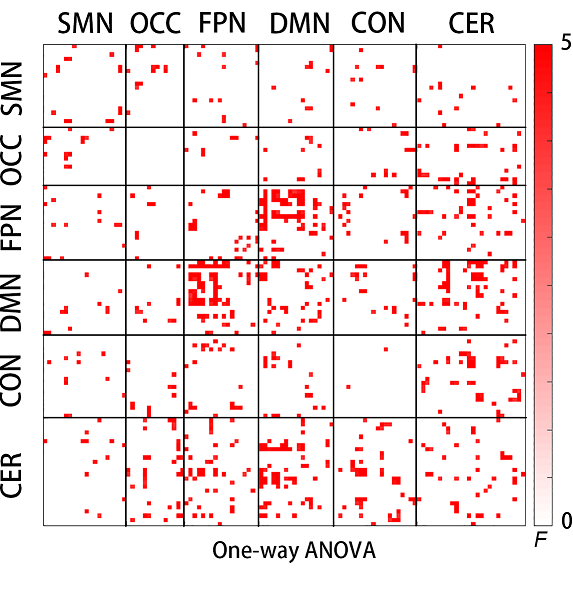
Using one-way ANOVA analysis, there were significant differences found among three groups in intra-network connectivity within the CER and DMN, and among the between-network connections, particularly in the DMN-linked and CER-linked inter-networks (FIGURE 1). The remainder of the post-hoc t-test further showed that compared with the healthy control group: 1) the connectivity within the cerebellum network increased slightly in the mild AD group, whereas it decreased sharply in the moderate AD group; and 2) the connectivity within the DMN and between the networks of DMN-FPN pairs was reduced in both the mild and moderate AD groups; 3)Moreover, the moderate AD groups’ exhibited decreased connectivity of the CER-OCC pairs and increased connectivity of the DMN-CON and CER-FPN pairs. ( FIGURE2-3).DISCUSSION
Our results demonstrated that the connectivity within the CER changed, and our interpretation is that the increased connectivity in the cerebellum may be related to memory processing and reflect a coherent compensation at the mild AD stage. For inter-network connectivity, our work demonstrated that changes of the DMN-associated category in RSN functions emerge early in mild AD, and that DMN-associated and CER-associated pair impairment occur in moderate AD.CONCLUSION
This study found a difference in alteration of the brain network functional connectivity in mild AD and moderate AD, which suggests that the cerebellar network is pivotal network of RSN pairs at the moderate AD stage.Acknowledgements
We thank all subjects for their study participation. This study has received funding by National Natural Science Foundation of China (Grant No. 30870713),and Natural Science Foundation of Tianjin under Grant Nos.16JCYBJC25900, 15ZCZDSY00520.References
1. Wattmo, C.; Wallin, A. K.; Minthon, L., Progression of mild Alzheimer's disease: knowledge and prediction models required for future treatment strategies. Alzheimer's research & therapy 2013, 5 (5), 44.
2. Palesi, F.; Castellazzi, G.; Casiraghi, L.; Sinforiani, E.; Vitali, P.; Gandini Wheeler-Kingshott, C. A. M.; D'Angelo, E., Exploring Patterns of Alteration in Alzheimer's Disease Brain Networks: A Combined Structural and Functional Connectomics Analysis. Frontiers in Neuroscience 2016, 10.
3. Damoiseaux, J. S.; Prater, K. E.; Miller, B. L.; Greicius, M. D., Functional connectivity tracks clinical deterioration in Alzheimer's disease. Neurobiology of aging 2012, 33 (4), 828.e19-30.4. He, Y.; Wang, J.; Wang, L.; Chen, Z. J.; Yan, C.; Yang, H.; Tang, H.; Zhu, C.; Gong, Q.; Zang, Y.; Evans, A. C., Uncovering Intrinsic Modular Organization of Spontaneous Brain Activity in Humans. PLoS ONE 2009, 4 (4).
Figures