3750
In-vivo mapping of monoaminergic network disruption in Alzheimer’s disease: implications for neuropsychiatric symptomsLaura Serra1, Marcello D'Amelio2, Carlotta Di Domenico1, Camillo Marra3, Nicola Biagio Mercuri4, Carlo Caltagirone5, Mara Cercignani1,6, and Marco Bozzali1,6
1Neuroimaging Laboratory, Santa Lucia Foundation IRCCS, Rome, Italy, 2Laboratory Molecular Neurosciences, Santa Lucia Foundation IRCSS, Rome, Italy, 3Institute of Neurology, Catholic University, Rome, Italy, 4Laboratory of Experimental Neurology, Santa Lucia Foundation IRCCS, Rome, Italy, 5Department of Clinical and Behavioural Neurology, Santa Lucia Foundation IRCCS, Rome, Italy, 6Department of Neuroscience, Brighton & Sussex Medical School, Brighton, United Kingdom
Synopsis
Some recent animal models and neuropathological evidence highlighted the loss of noradrenergic neurons in the locus coeruleus and dopaminergic neurons in the ventral tegmental area (VTA) as important pathophysiological events in Alzheimer's disease. Here we use resting-state functional MRI to show reductions in VTA connectivity in patients with Alzheimer's disease and mild cognitive impairment, which are more prominent in patients with neuropsychiatric symptoms.
Purpose
Some recent animal models (1) and neuropathological (2) evidence highlight the loss of noradrenergic neurons originating from the locus coeruleus (LC) and dopaminergic neurons from the ventral tegmental area (VTA) as important pathophysiological events in early Alzheimer’s disease (AD). Assuming that a loss of these monoaminergic neurons would result in reduction in connectivity between, respectively, LC and VTA and the rest of the brain, we assessed, in humans, the presence of connectivity changes in these regions and how these changes may account for patients’ neuropsychiatric symptoms.Methods
We recruited 169 patients with either AD (mean age: 73.1±6.2 years; M/F=34/50) or amnestic mild cognitive impairment (a-MCI) due to AD (mean age: 71.8±7.4 years; M/F=24/24) and 37 elderly controls (HS, mean age: 70.7±5.3 years. M/F=16/21). They all underwent cognitive and behavioural assessments (using the Neurpsychiatric Inventory [NPI], 3) and MRI at 3T. The MRI protocol included T1-weighted volume, and resting-state functional MRI (RS-fMRI). RS-fMRI data were pre-processed using Statistical Parametric Mapping version 8 (SPM8, http://www.fil.ion.ucl.ac.uk/spm/), and in-house Matlab scripts. The pre-processing steps included correction for head motion, compensation for slice-dependent time shifts, normalization to the EPI template in MNI coordinates, and smoothing with a 3D Gaussian Kernel with 8 mm3 full width at half maximum. The global temporal drift was removed using a third-order polynomial fit, and the signal was regressed against the realignment parameters, and the global signal. Then, all images were filtered by a phase-insensitive band-pass filter (pass band 0.01–0.08 Hz) to reduce the effect of low-frequency drift and high-frequency physiological noise. Every participant’s T1 volume was segmented in SPM8 in order to estimate the total GM volume. LC and VTA masks from the Harvard AAN Atlas (4, https://www.martinos.org/) were used for a seed-based analysis of functional connectivity (5) (Fig.1). The resulting connectivity maps were compared across groups (AD, a-MCI and HS), and then between patients who exhibited neuropsychiatric symptoms and those who did not. Statistical significance was set at p < 0.05 family-wise error (FWE)-corrected at cluster level, forming clusters at uncorrected level with p<0.001.Results
VTA connectivity was reduced in both, a-MCI and AD patients with partially overlapping distributions (Fig.2). Conversely LC connectivity was reduced in AD, but not in a-MCI, compared to HS. Several patients were suffering from at least one neuropsychiatric symptom. As apathy, depression and anxiety were the most represented symptoms, with a similar distribution between AD and a-MCI, we classified patients as affected by neuropsychiatric symptoms if they scored > 0 in at least one of the corresponding NPI subscores. A-MCI patients who suffered from neuropsychiatric symptoms (compared to those who did not) showed a pattern of additional VTA disconnection with the posterior cingulate cortex and the precuneus (Fig. 3A). In the AD group, patients with neuropsychiatric symptoms (compared to those without behavioural symptoms) showed additional areas of reduced VTA connectivity in the anterior cingulate gyrus and in the prefrontal cortex bilaterally (Fig. 3A) and of reduced LC connectivity in the postero-lateral parietal cortex and in the insular and orbitofrontal cortex bilaterally (Fig 3B).Discussion
This study supports a contribution of VTA and LC degeneration to AD pathophysiology, and suggests that a loss of these monoaminergic neurons might underpin some of the neuropsychiatric symptoms often observed in these patients. These results are consistent with animal findings (1) and have potential implications for AD prognosis and therapies. These data also support the use of RS fMRI as a surrogate marker of degenerative process occurring within selected neuronal populations.Acknowledgements
No acknowledgement found.References
1. Nobili A, et al. Dopamine neuronal loss contributes to memory and reward dysfunction in a model of Alzheimer's disease. Nat Commun 2017; 8:14727; 2. Storga D, et al. Monoaminergic neurotransmitters, their precursors and metabolites in brains of Alzheimer patients. Neurosci Lett 1996; 203: 29-32; 3. Cummings, J. L. The Neuropsychiatric Inventory: assessing psychopathology in dementia patients. Neurology 1997; 48, S10-16. 4. Edlow BL, et al. Neuroanatomic connectivity of the human ascending arousal system critical to consciousness and its disorders. Journal of Neuropathology and Experimental Neurology 2012; 71: 531-546. 5. Olivito G, et al. Resting-State Functional Connectivity Changes Between Dentate Nucleus and Cortical Social Brain Regions in Autism Spectrum Disorders. Cerebellum 2017; 16: 283-292.Figures
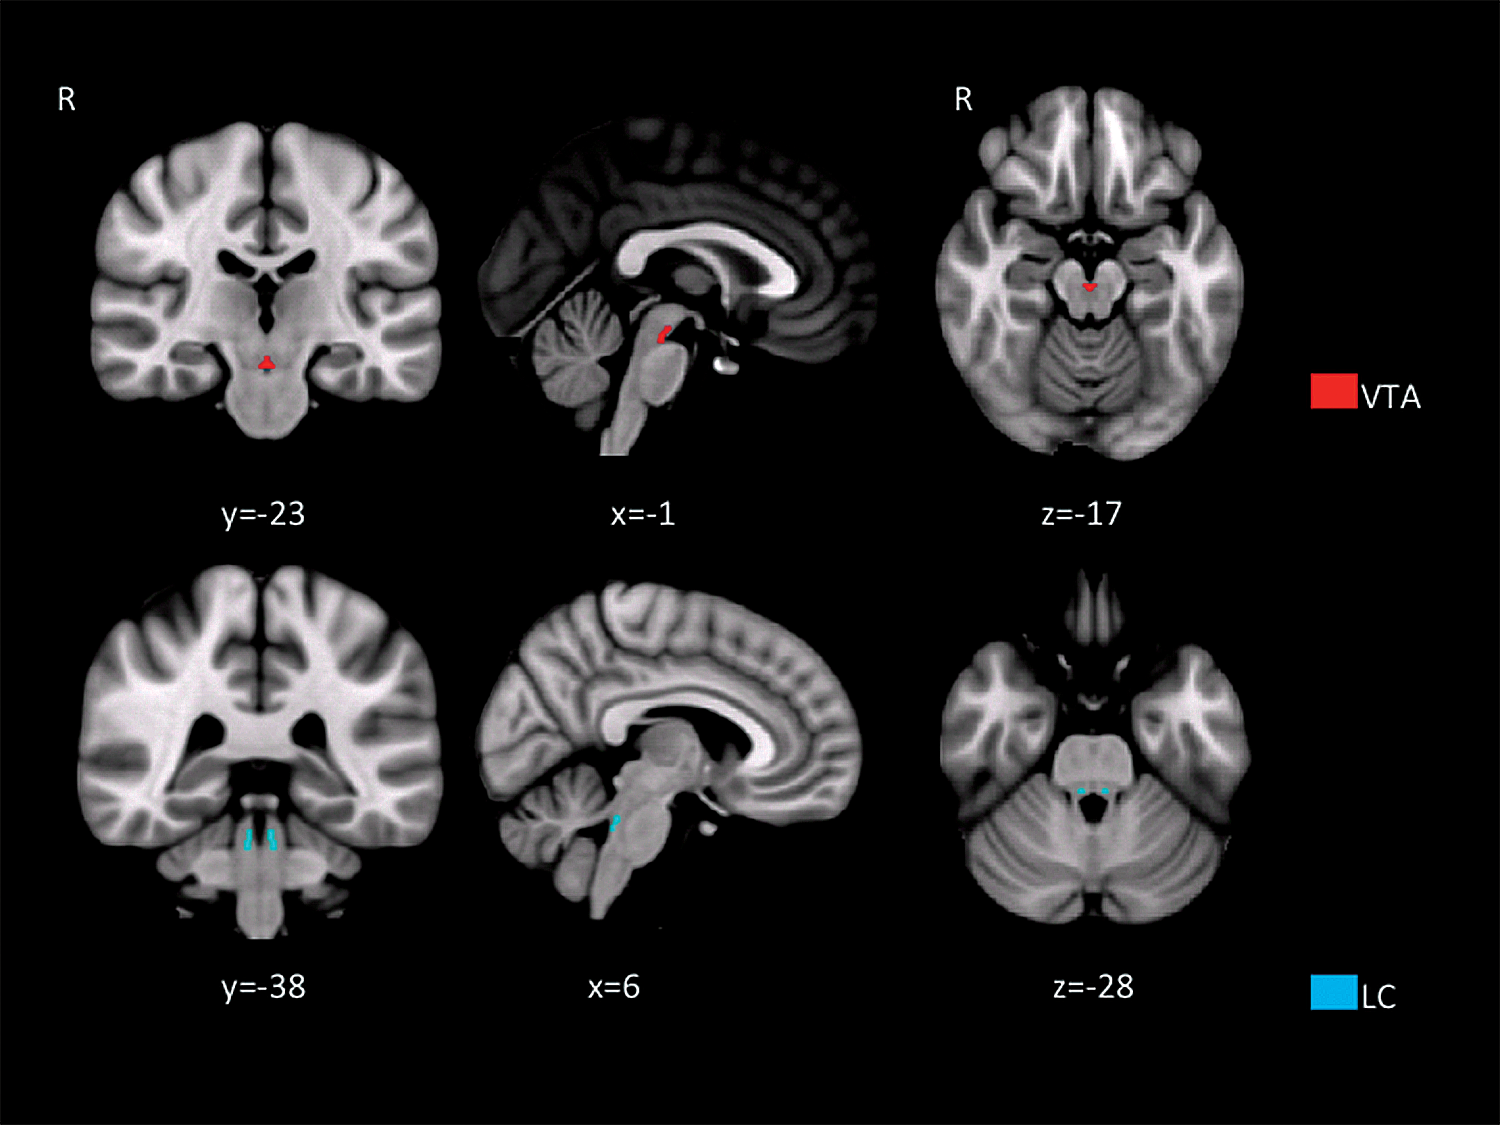
Figure 1. Anatomical regions
used as seed areas for anatomical connectivity. (A) ventral tegmental area (VTA); (B) Locus coeruleus (LC).
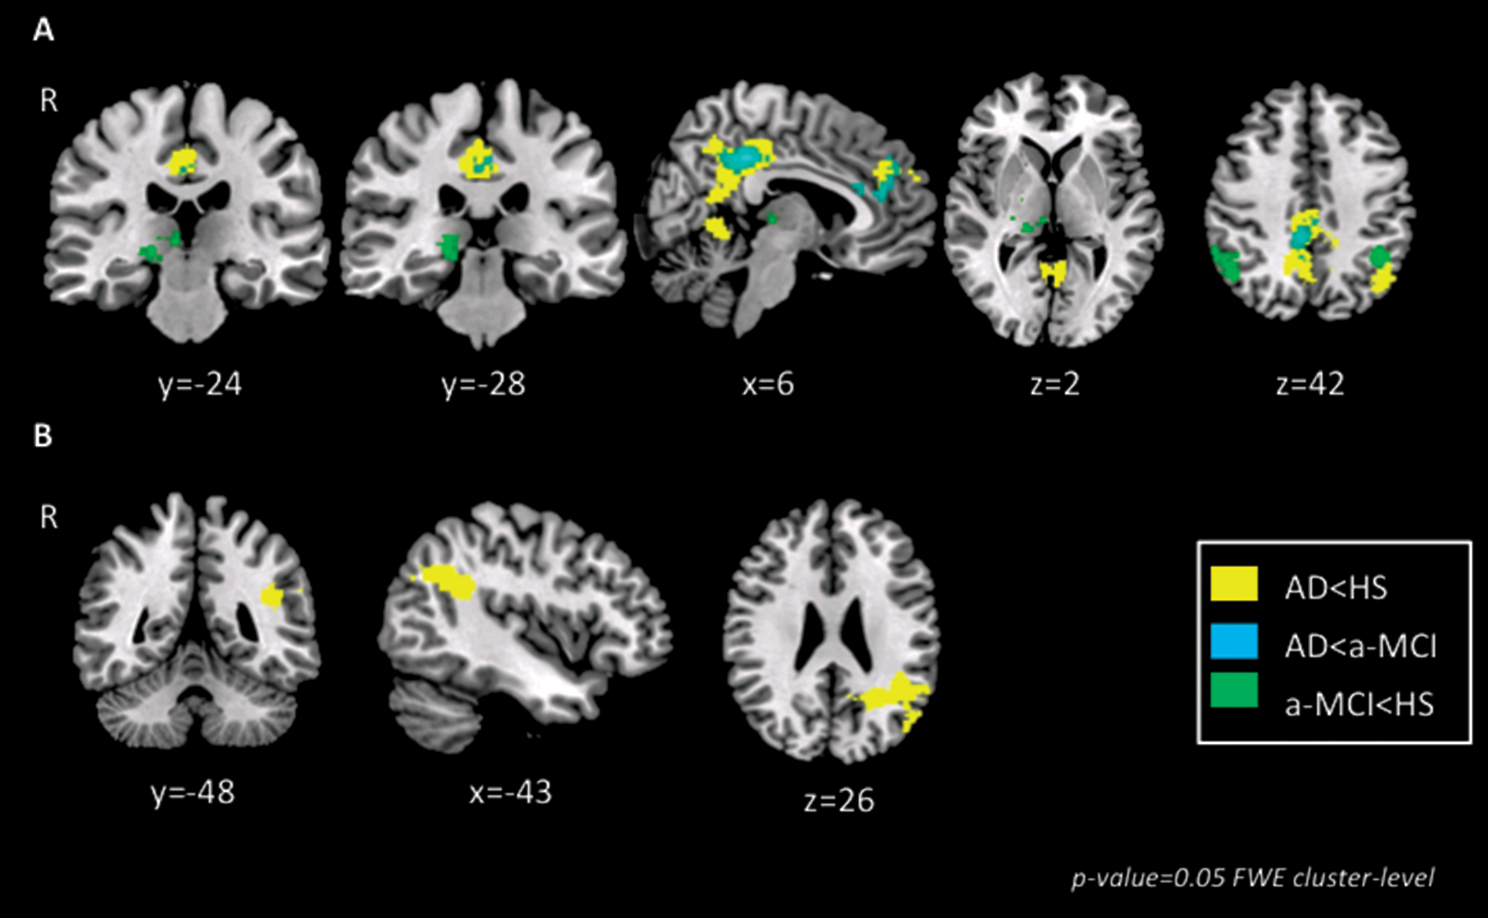
Figure 2. Changes in VTA and LC
connectivity across groups. (A) Changes in VTA connectivity; (B) Changes in LC connectivity
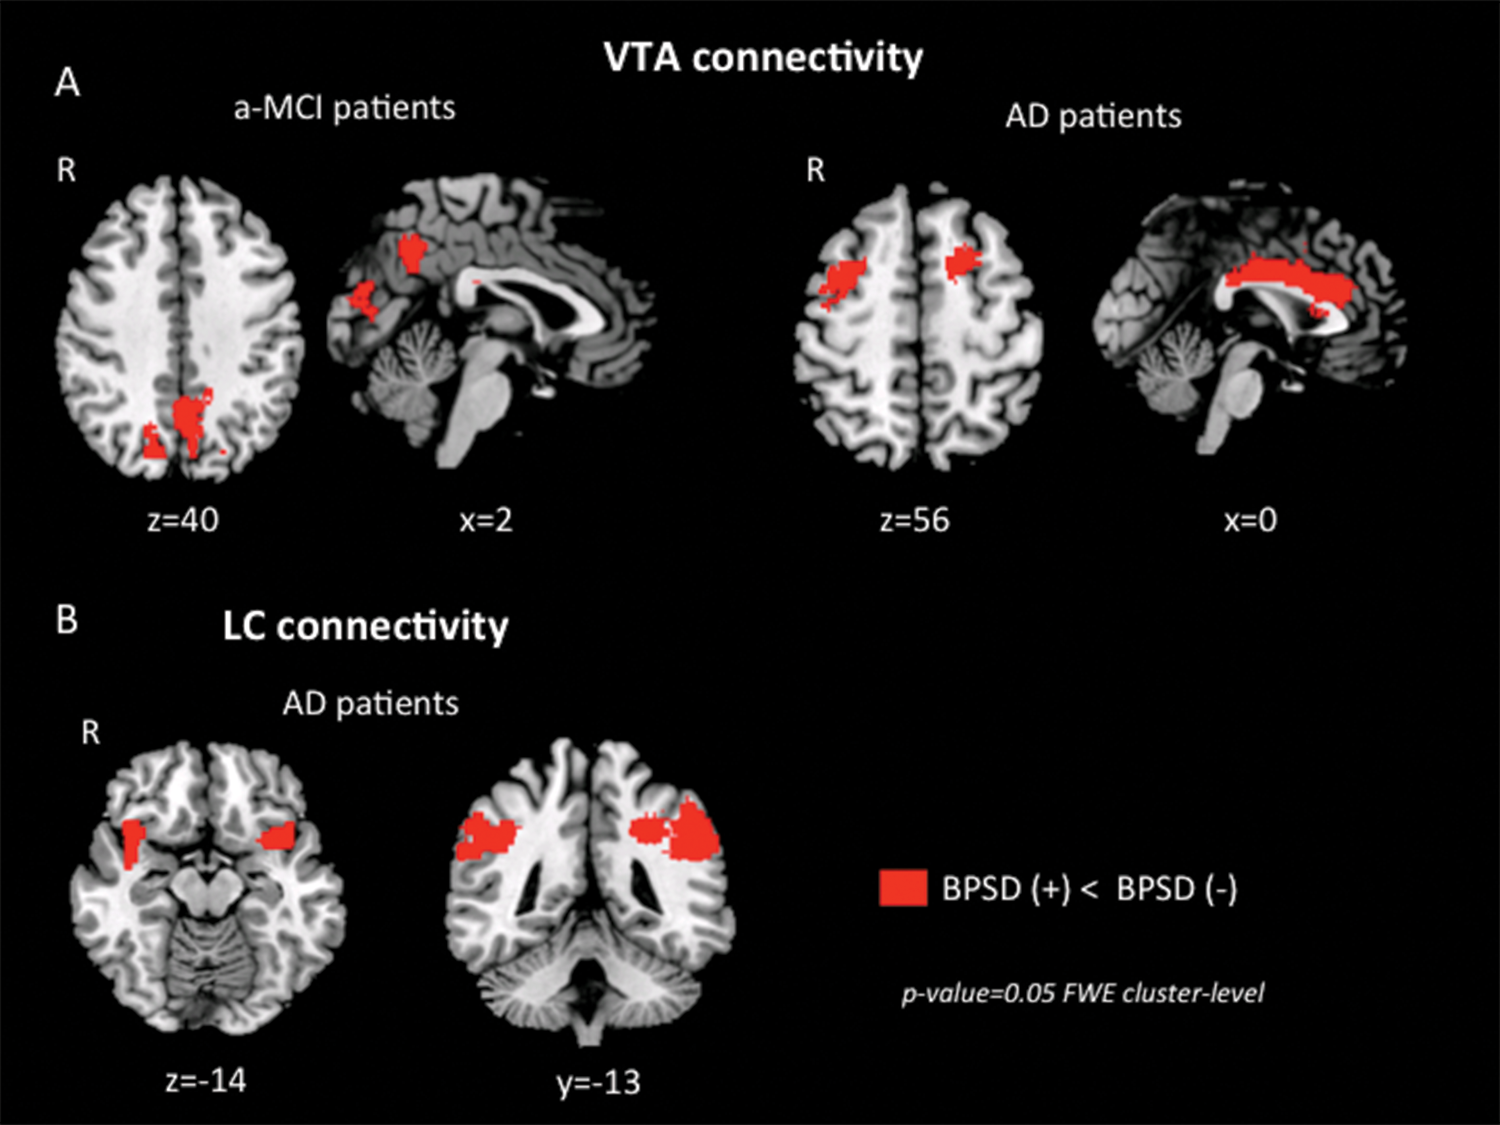
Figure 3. Changes in VTA and LC connectivity between patients who presented with neuropsychiatric symptoms and those who did not. (A) VTA connectivity; (B) LC connectivity