3749
The estimation of diagnostic accuracy of FDG-PET/MR imaging for Alzheimer's disease— simulation study using ADNI-data1Nippon Medical School, Tokyo, Japan, 2University Hospital Zurich, Zurich, Switzerland, 3GE Healthcare, Waukesha, WI, United States, 4University of Toronto, Toronto, ON, Canada
Synopsis
The purpose of this study was to estimate the impact of commercial MRAC on the evaluation of dementia, especially in Alzheimer’s disease (AD). We combined ADNI-data and patients data. We multiplied 14 error map derived from commercial Atlas-based MRAC method and each 203 ADNI data after the same nomalization and smoothing. To clarify the statement of prediction of AD, PET score was calculated by using PALZ. The accuracy, sensitivity and specificity for the discrimination of AD-patients from the normal control was not so impaired by MR-AC (Original vs. Error; 83.2%, 83.3% and 83.1% vs. 81.3% [range 77.6-83.2], 82.6% [range 79.2-85.4%,] and 80.3% [range71.2-86.4%]).
Purpose
One of the best targets of PET/MR applications is thought to be the evaluation of dementia. However, incomplete MR-attenuation correction (MRAC) on commercial PET/MR causes the error on PET images, which may lead to worsen the diagnostic accuracy (1). The purpose of this study was to estimate the impact of commercial MRAC, atlas-based method, on the evaluation of dementia, especially in Alzheimer’s disease (AD).Materials and Methods
ADNI-data; Data used in the preparation of this article were obtained from the Alzheimer’s Disease Neuroimaging Initiative (ADNI) database (adni.loni.usc.edu). From ADNI-1 data, we extracted 203 patients who meet the inclusion criteria; PET images were appropriate for PALZ analysis, and both base-line and 2-years later PET scan were performed.
Patients-data; We recruited 14 clinical patients (6 males, median age 66, range 56 to 80) who underwent both brain PET/CT (GE Discovery 690) and braine PET/MR (GE SIGNA) examination.
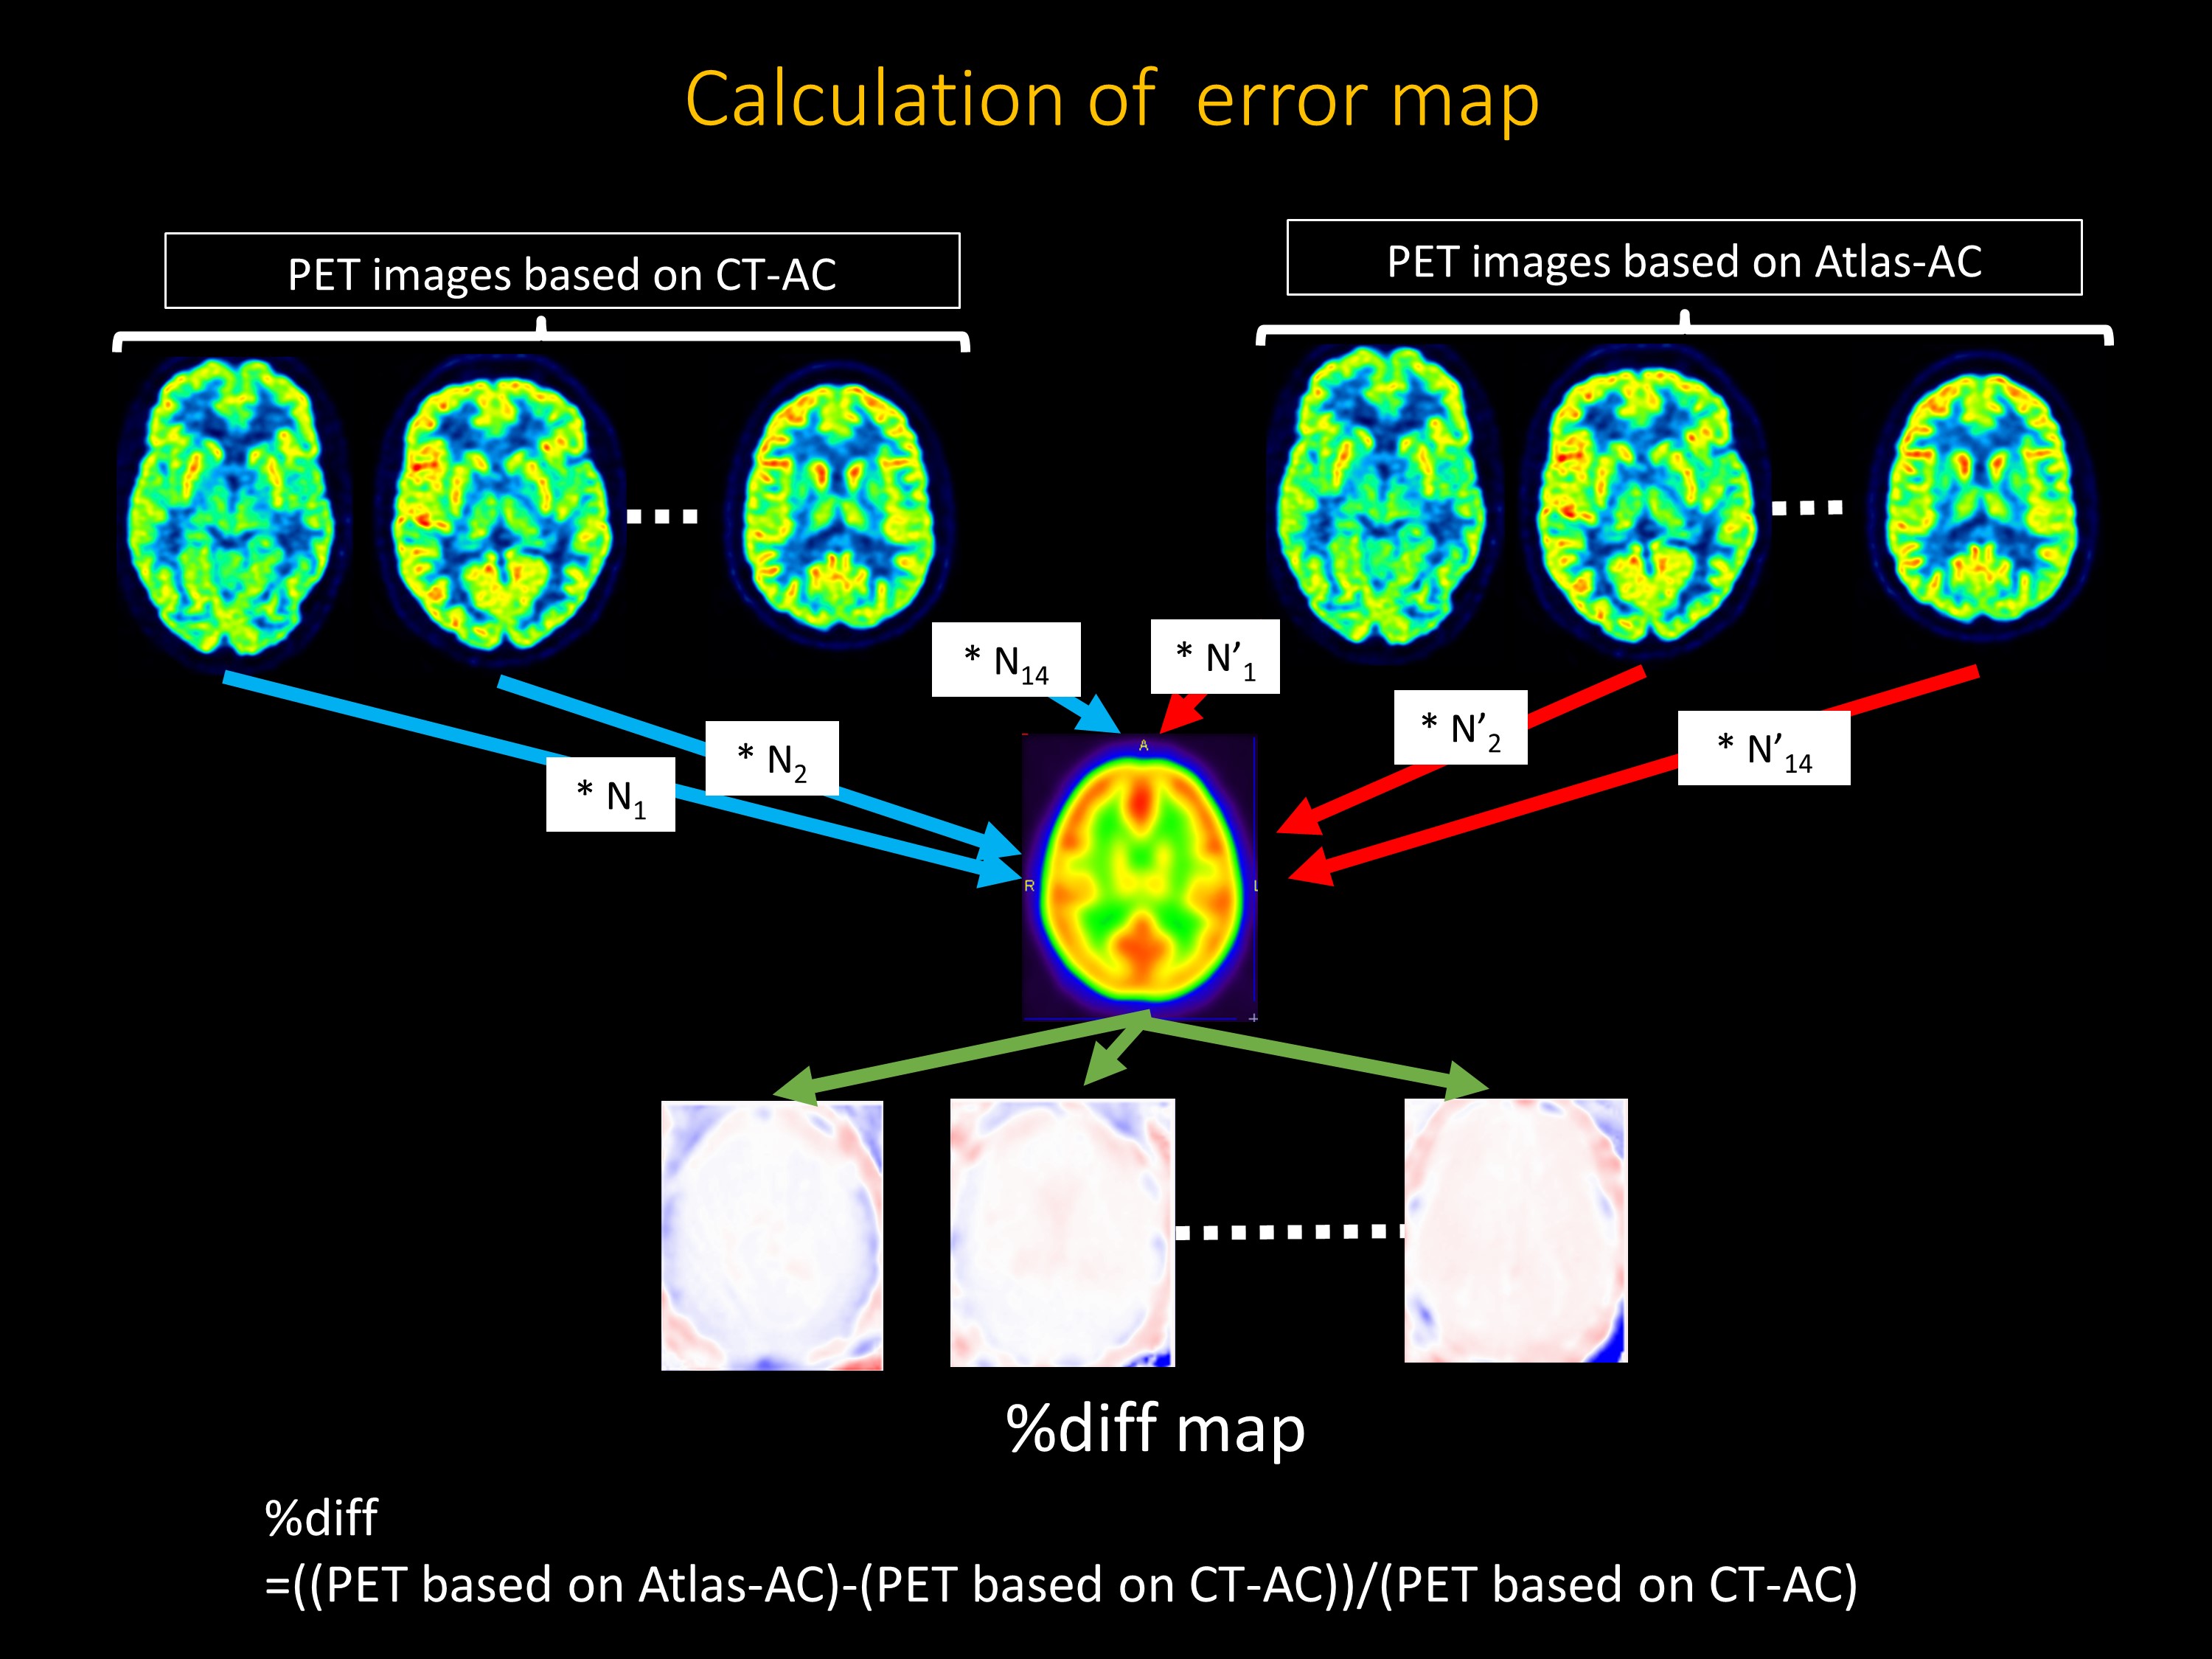
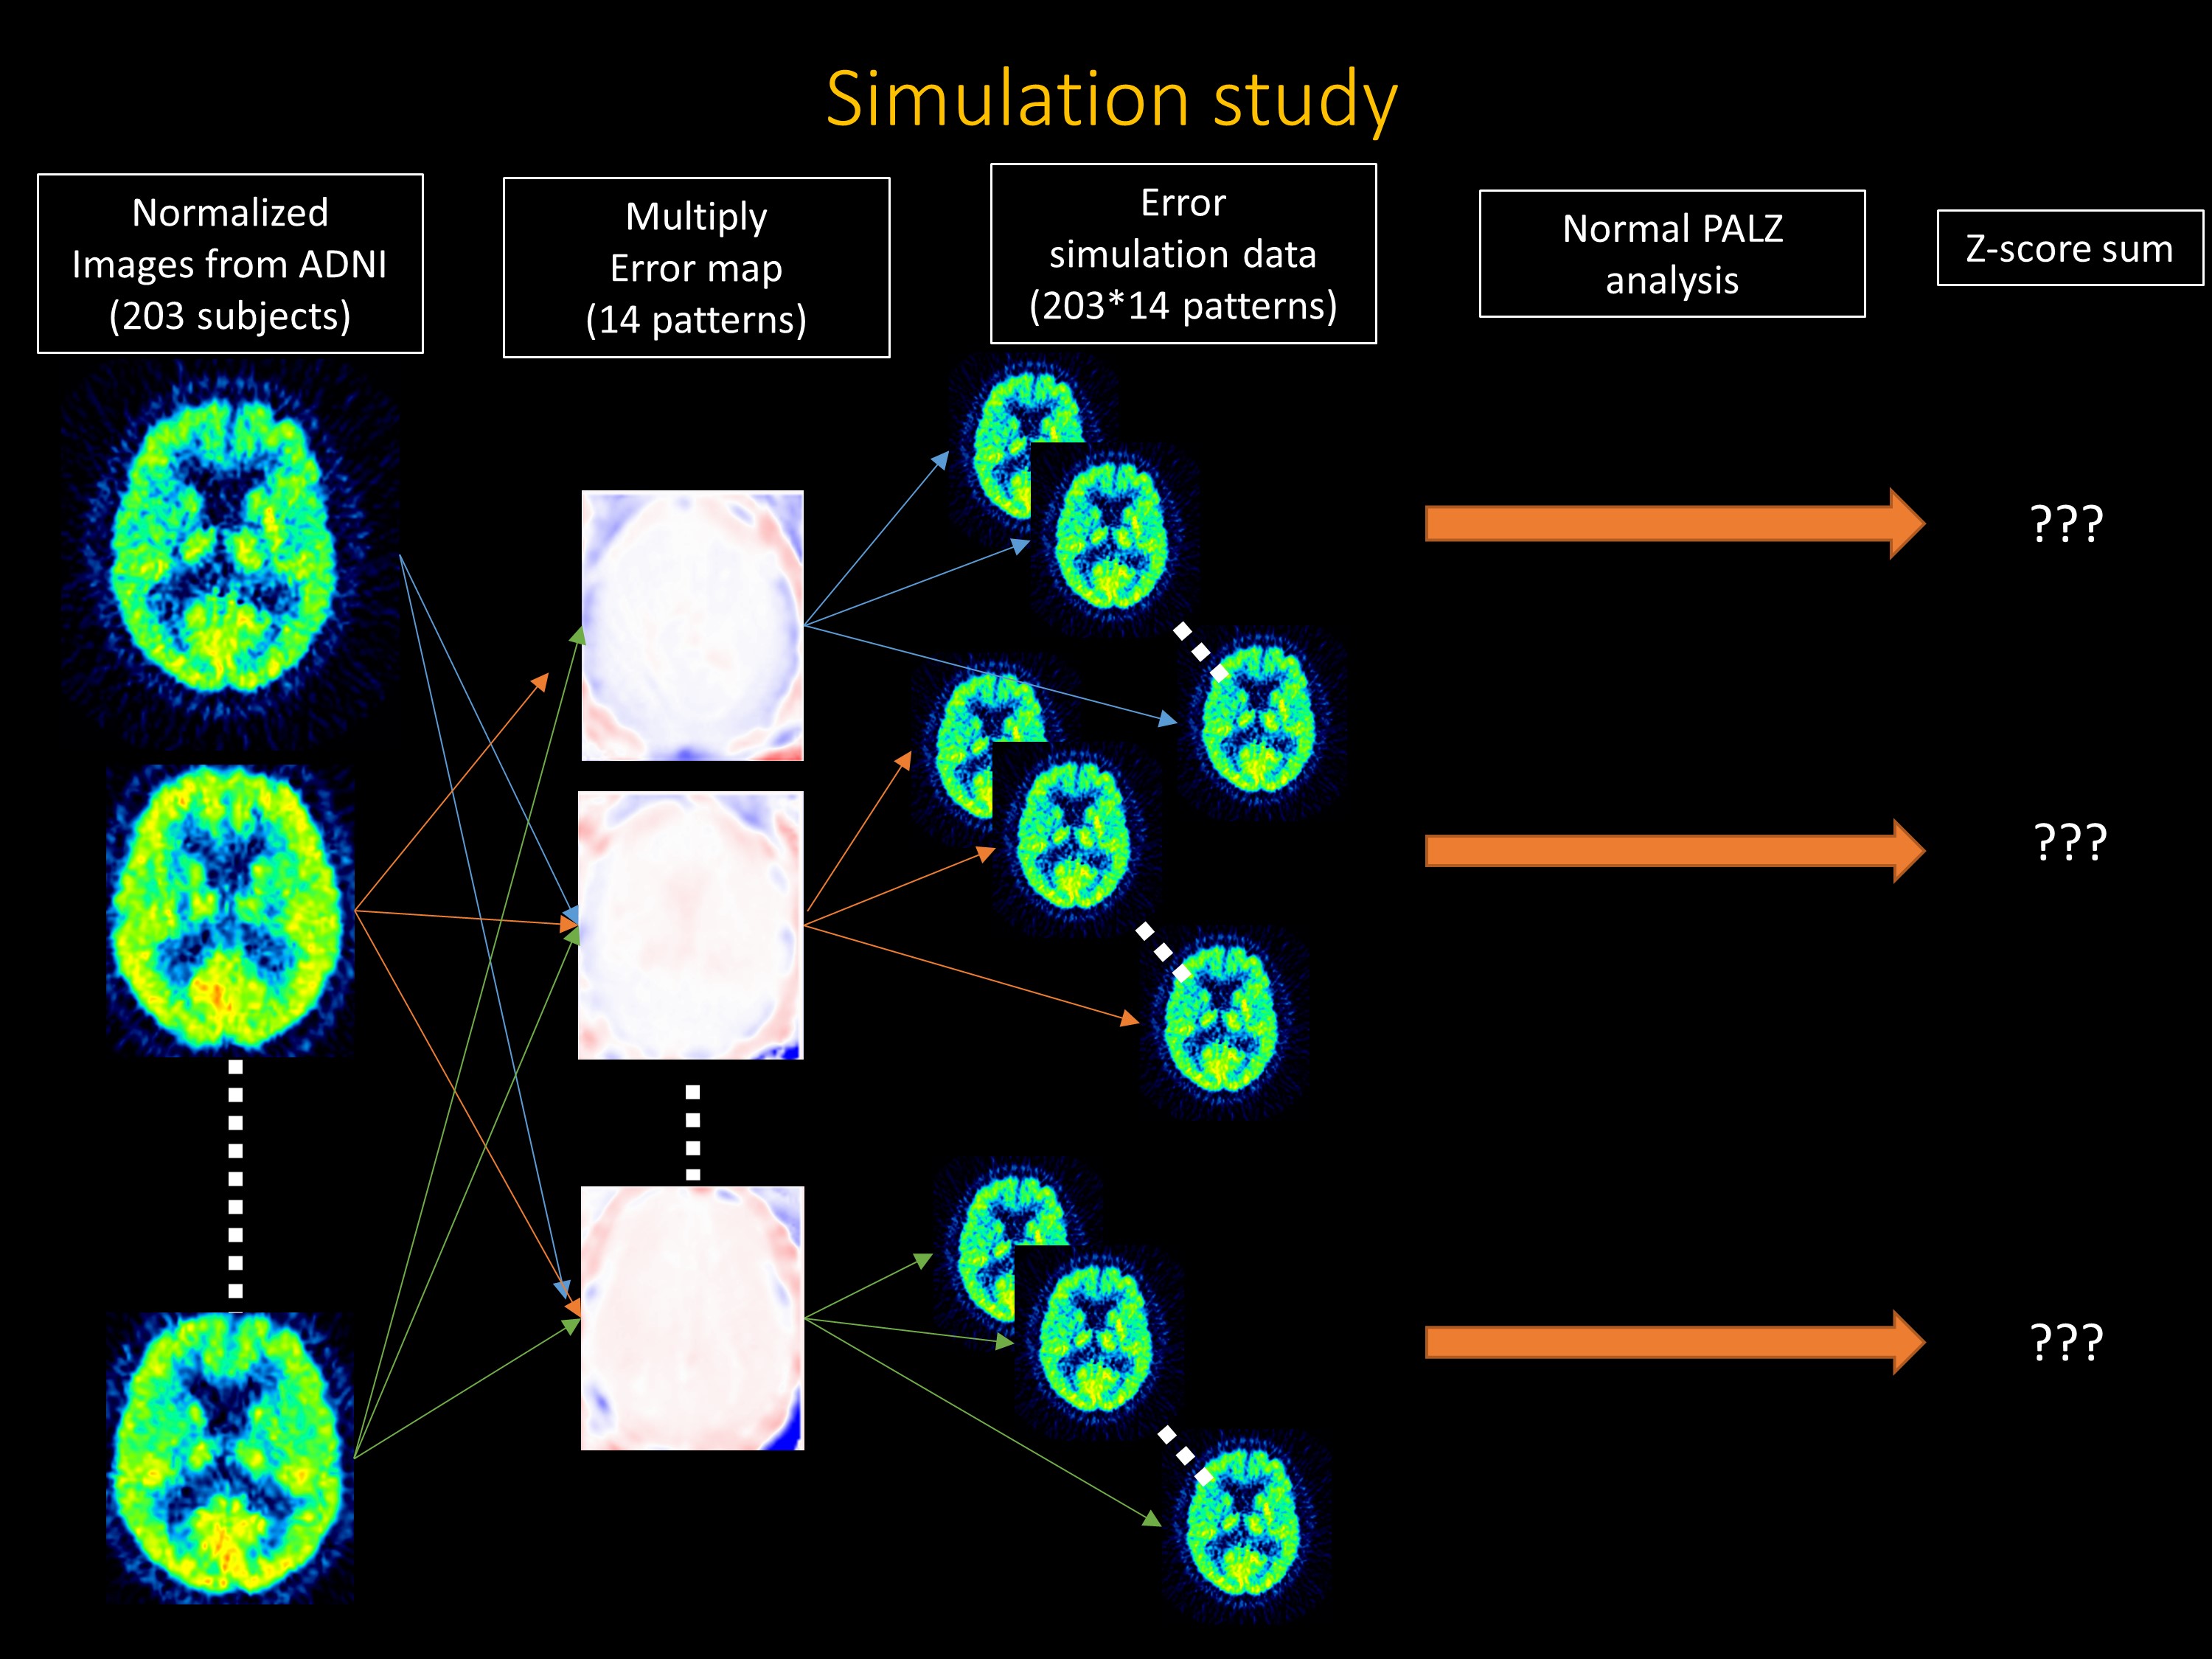
Evaluation; From the PET raw data on PET/MR, two FDG-PET data were generated based on MRAC (Atlas-based method) and CTAC. After the spatial normalization and smoothing for these PET images, in each patient, we calculated the error-map where PET based on MRAC was divided by that on CTAC. We multiplied these each 14 error map and each 203 ADNI data after the same normalization and smoothing, as a result we could acquire 14*203=2842 dataset. To clarify the statement of the discrimination of AD-patients from the normal control and predicting progression from MCI to AD, PET score was calculated by using PMOD Alzheimer’s Discrimination Tool (PALZ) (Pmod, Zurich, Switzerland) in all dataset.
*Atlas-based MRAC method (1); The Atlas-AC map was generated from the LAVA-Flex T1w images using a proprietary process that consists of 4 main steps. First, Hessian bone enhancement from LAVA-FLEX T1w images (TR ~ 4 msec, TE 2.23 msec, flip angle 12 degrees, slice thickness 5.2 mm with 2.6mm overlap, 120 slices, pixel size 1.95 × 1.95 mm2, partial Fourier 70.3%, acquisition time: 18 sec) is performed. Second, a pseudo-CT is generated by rigid and non-rigid B-spline elastic registration between the enhanced images and a CT-based head atlas. This atlas is provided by the manufacturer. Third, the attenuation map is generated from the pseudo-CT using the standard energy conversion and resampling. Finally, the MR hardware, coil and bed are added to the attenuation map. This entire procedure takes less than 30 sec and requires no user interaction.
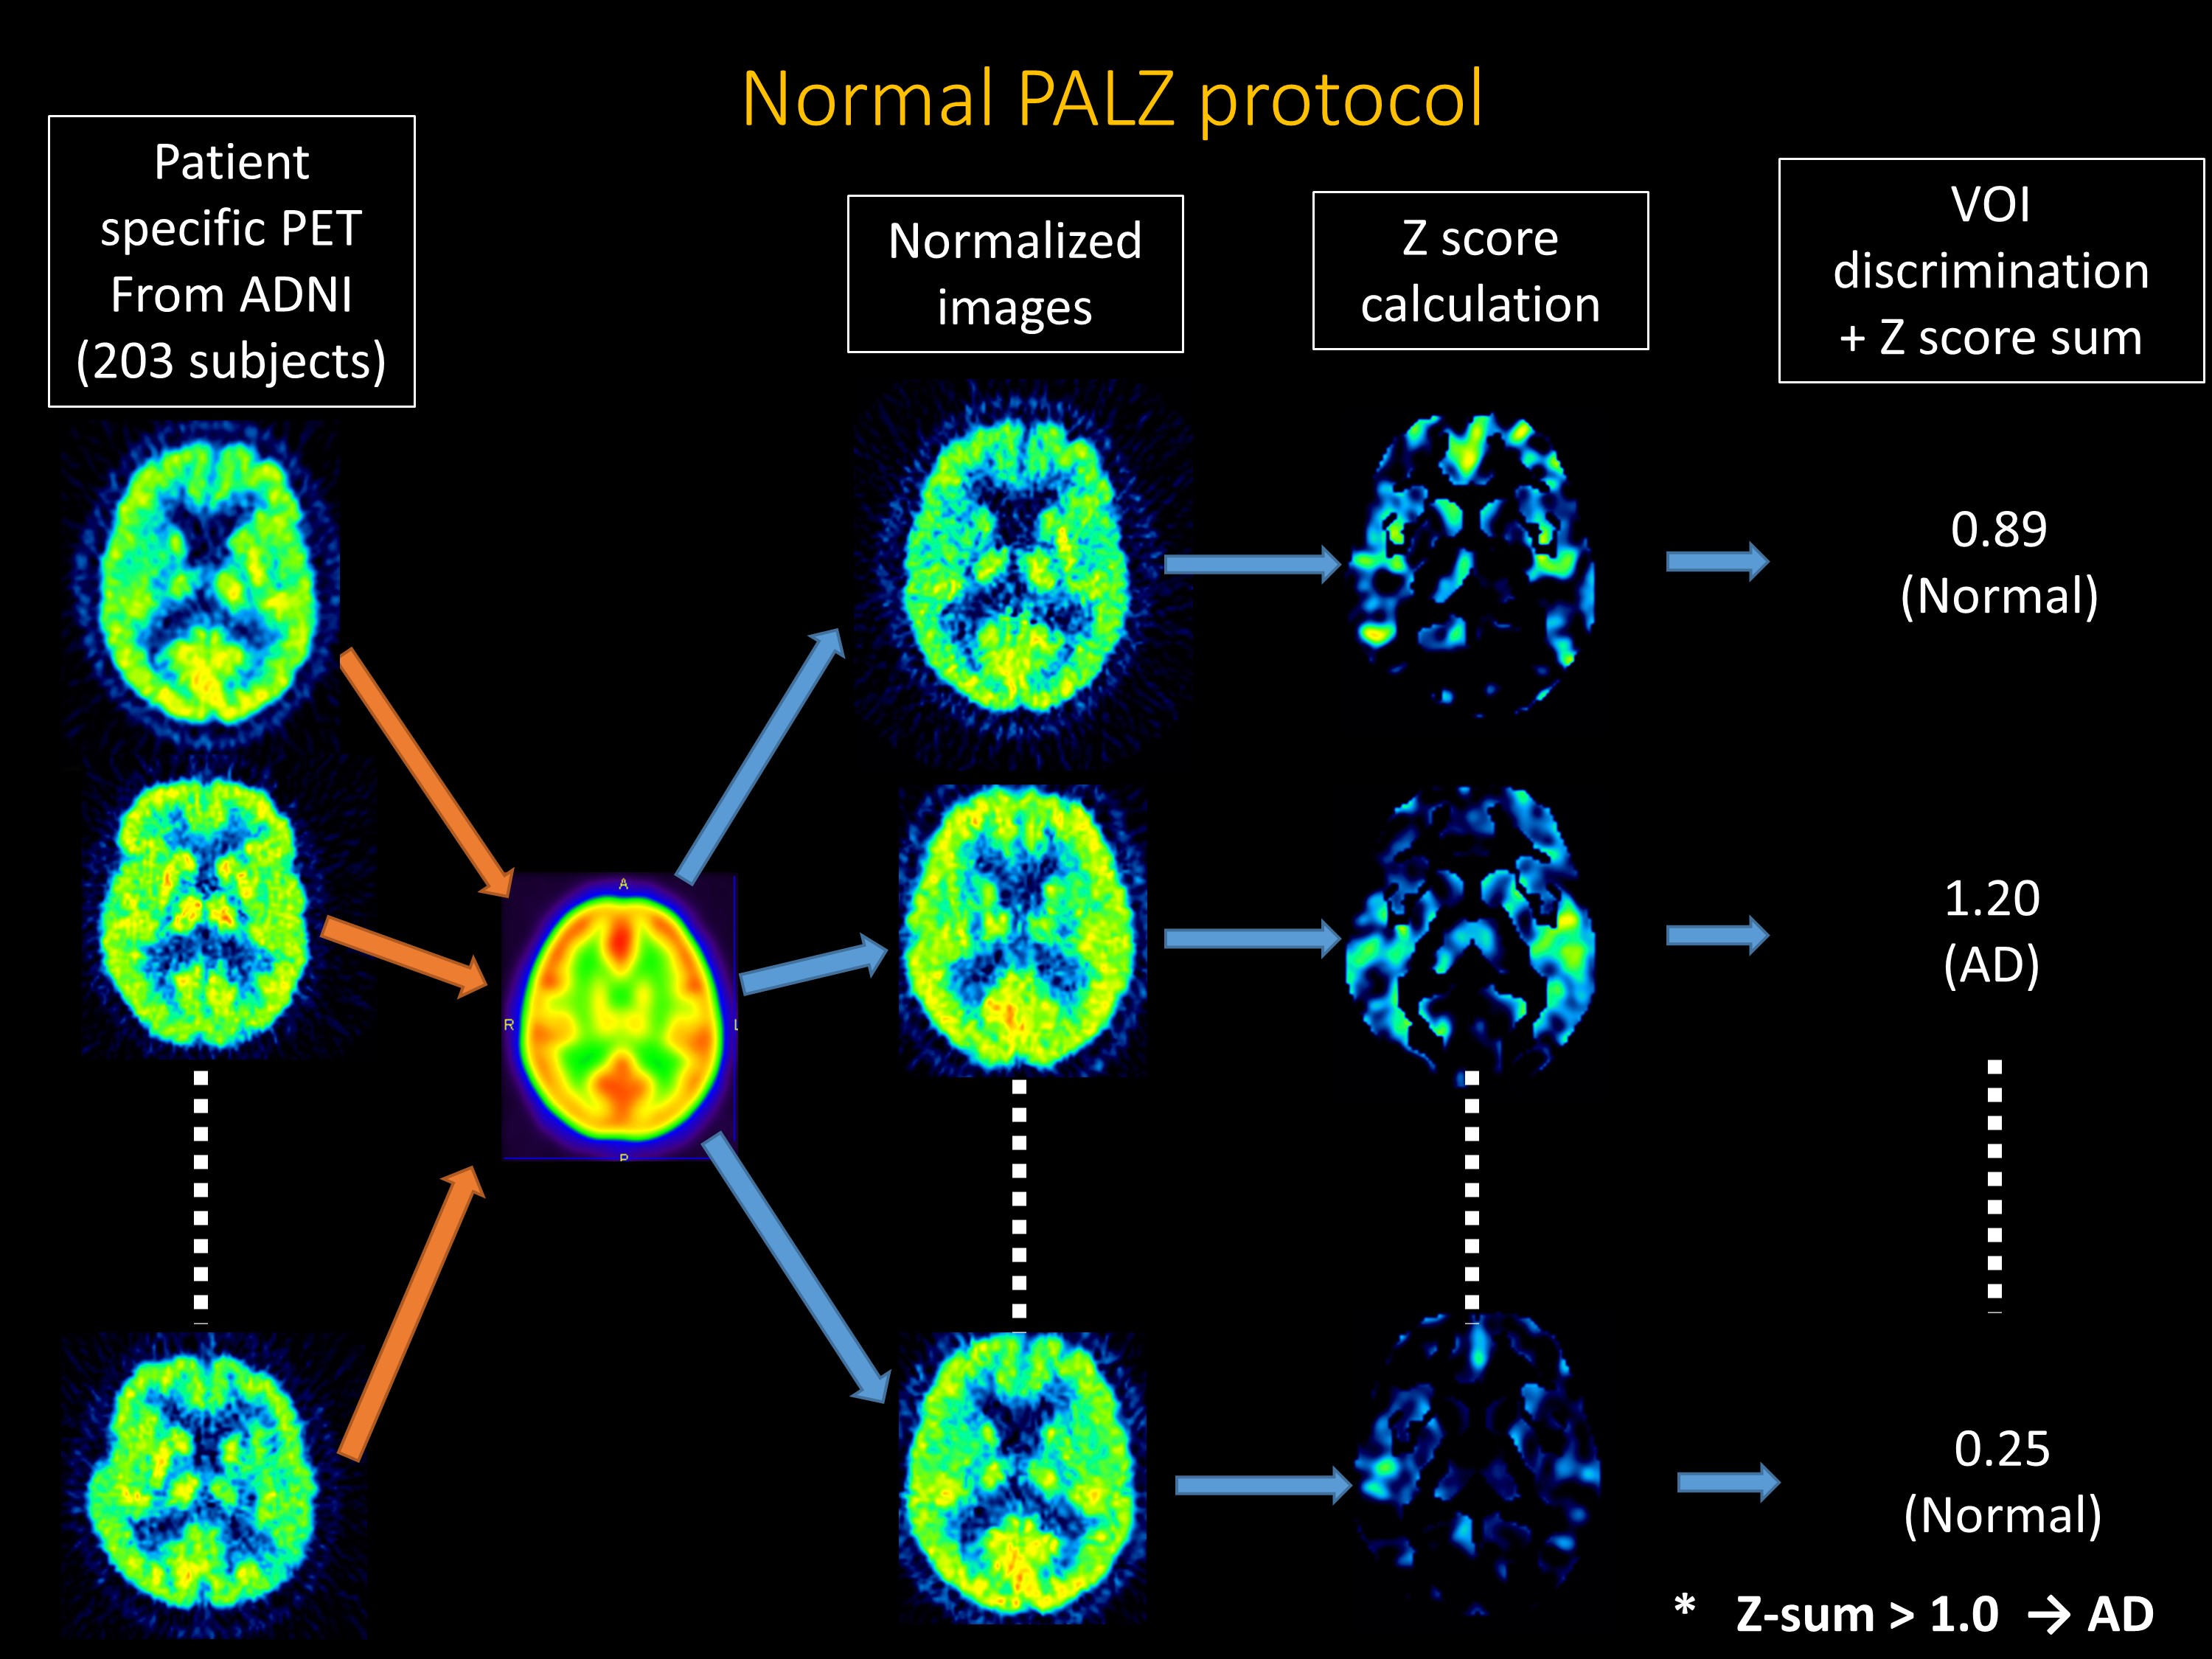
*PALZ analysis (2); PALZ was validated with multiple large cohort studies, e.g. ADNI and NEST-DD. it ran the following procedures in a fully automatic way. First, the spatial normalization was performed by transforming the original images to the standard PET template of SPM99, and then smoothed with a Gaussian filter of 12 mm. Second, the voxel value is normalized by dividing each image voxel value by the voxel mean value, averaged within a mask representing voxels with AD-preserved activity. Third, the expected activity in each voxel at patient’s age is calculated using pre-stored voxel-wise age regression parameters. Fourth, the difference of voxel value between the expected images and patient-specific ones is calculated into t-values. Fifth, the sum of t-value in predefined AD-related voxels are calculated, which is called AD t-sum. Sixth, to clarify the statement of prediction of AD, PET Score was calculated as log2 (AD t-sum/11089 +1), where 95% prediction limit (11089) of AD t-sum was established in the NEST-DD multi-center trial.
Results
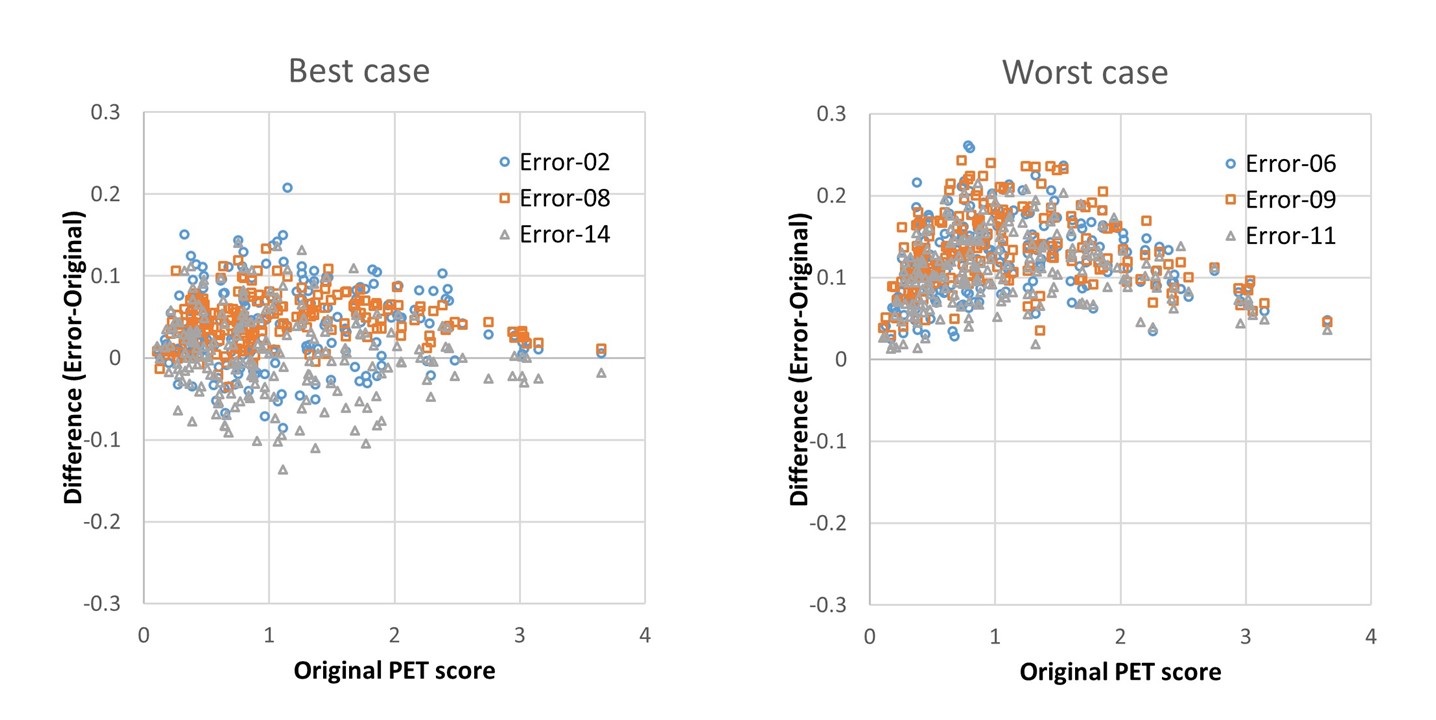
The accuracy, sensitivity and specificity for the discrimination of AD-patients from the normal control was not so impaired by MR-AC (Original vs. Error; 83.2% [CI 75.0%-89.0%], 83.3% [CI 74.2%-89.8%] and 83.1% [CI 75.6%-88.3%] vs. 81.3% [range 77.6-83.2], 82.6% [range 79.2-85.4%,] and 80.3% [range 71.2-86.4%]). The accuracy, sensitivity and specificity for predicting progression from MCI to AD during 2-year follow-up was not impaired by MR-AC, either (Original vs. Error; 63.5% [CI 54.1%-72.0%], 60.6% [CI 46.9%-72.9%] and 65.1% [CI 57.9%-71.5%] vs. 56.9% [range 54.2-59.8], 61.5% [range 54.5-72.7%,] and 64.5% [range 54.0-73.0%]). The worst 3 cases show the tendency of the overestimation of PET scores.Discussion
In the current study, we estimated the diagnostic accuracy of FDG-PET/MR for the evaluation of AD by the objective way with simulation study applying ADNI data. The result shows that the error from commercial MR-AC, GE Atlas-based method, impacts on the diagnosis accuracy slightly (less than 10% decrease of accuracy in any cases) with the trend of over-diagnosis due to the underestimation of FDG-uptake (corresponding to overestimation of t-value) closed to the skull base.Conclusion
Clinical FDG-PET/MR system using atlas-based MRAC is expected to discriminate AD-patients from the normal control and predict the progression from MCI to AD using the same manner and the same database for FDG-PET/CT.Acknowledgements
This work was supported by JSPS KAKENHI (Grant Number 17K18160), Kurata Grants from the Hitachi Global Foundation (Grant Number 1309) and research grants from Fukuda Foundation for Medical Technology.References
1, Sekine T, Buck A, Delso G, et al. Evaluation of atlas-based attenuation correction for integrated PET/MR in human brain: application of a head atlas and comparison to true CT-based attenuation correction. J Nucl Med. 2016;57:215-220.
2, Haense C, Herholz K, Jagust WJ, Heiss WD. Performance of FDG PET for detection of Alzheimer's disease in two independent multicentre samples (NEST-DD and ADNI). Dement Geriatr Cogn Disord. 2009;28:259-266.
Figures
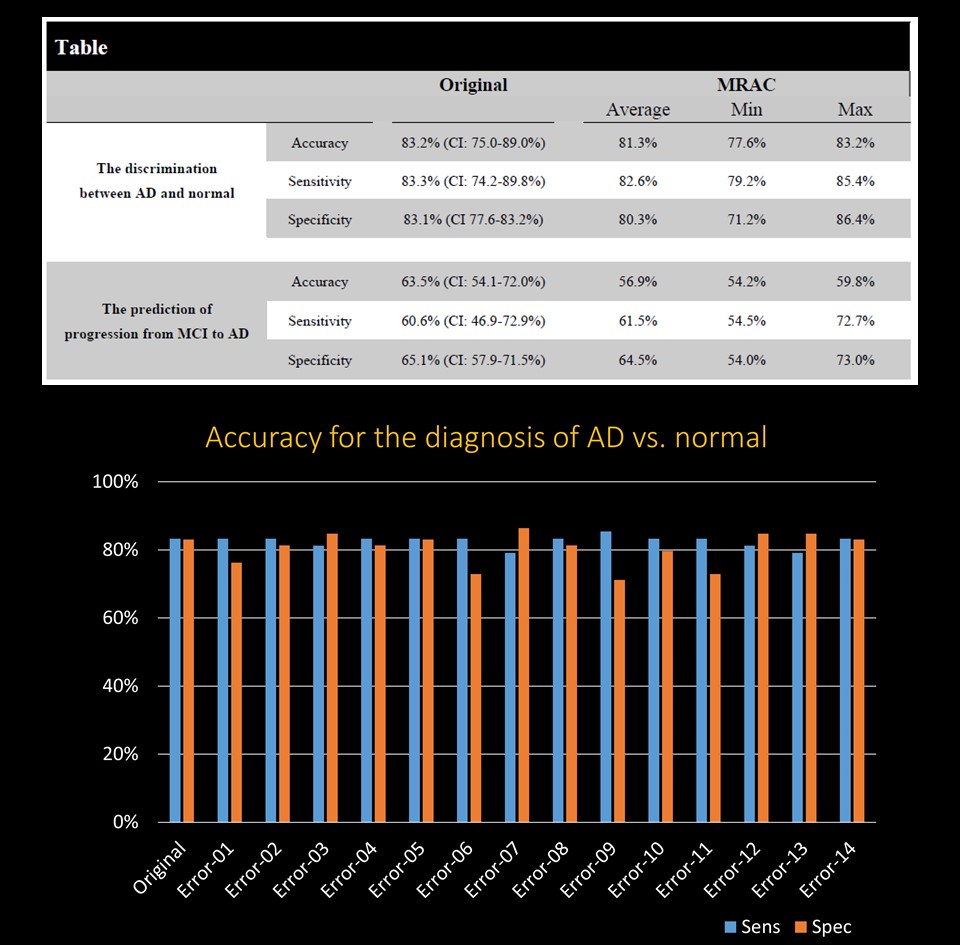
The table shows the summary of the accuracy, sensitivity and specificity of original and MRAC groups.
All the data is also shown in the bar chart.