3748
Oxygen extraction fraction is differentially affected in aging and Alzheimer’s disease: cross-sectional and longitudinal investigations in mice at 11.7T1Department of Radiology and Radiological Science, Johns Hopkins University, Baltimore, MD, United States, 2F.M. Kirby Research Center for Functional Brain Imaging, Kennedy Krieger Research Institute, Baltimore, MD, United States, 3Department of Electronic Science, Xiamen University, Baltimore, MD, United States, 4Department of Biomedical Engineering, Johns Hopkins University, Baltimore, MD, United States, 5Division of Biostatistics & Bioinformatics, Johns Hopkins University, Baltimore, MD, United States
Synopsis
Quantification of oxygen extraction fraction (OEF) is traditionally challenging and often requires the use of radiotracers or other invasive procedures, but has become feasible with recent advances in MR oximetry techniques. Here, we investigated the OEF in aging and Alzheimer’s disease (AD) with the T2-Relaxation-Under-Spin-Tagging (TRUST) technique. Based on the cross-sectional and longitudinal investigations, we demonstrated that normal aging and AD have different effects on brain OEF, which may reflect the dynamic nature of changes in brain energy homeostasis during these two processes. TRUST MRI may be a useful tool in elucidating physiological mechanisms of brain diseases in mouse models.
Purpose
Oxygen extraction fraction (OEF) indicates which fraction of oxygen carried by arterial blood is extracted by the brain, and is a measure of the balance between oxygen delivery and consumption. Quantification of OEF is traditionally challenging and often requires the use radiotracers or other invasive procedures, but has become feasible with recent advances in MR oximetry techniques. OEF in aging and Alzheimer’s disease (AD) has not been fully characterized. While both processes negatively impact cognitive function, their physiological underpinnings and therefore effects on OEF may be different. The present work first performed a cross-sectional investigation among young wild-type (WT), older WT, and older AD mice. To further characterize the time trajectory of these changes, we conducted a longitudinal study of WT and AD mice with serial OEF MRI.Method
The measurement of OEF in the mouse brain was based on a non-invasive technique, T2-Relaxation-Under-Spin-Tagging (TRUST) MRI. TRUST MRI measures venous blood oxygenation (Yv) based on a calibratible relationship between blood T2 and oxygenation, and has been described previously.1 Then, OEF can be estimated by Ya-Yv, where Ya is the arterial oxygenation and was assumed to be 99%. All experiments were performed on a Bruker 11.7T. In the cross-sectional study, three cohorts of mice (5 younger WT mice, 16~18 weeks; 5 older WT mice, 86~93 weeks; and 4 older AD mice, 86~98 weeks) were studied. In the longitudinal study, 5 APPSWE AD mice and 5 age-matched WT mice were studied. Each animal was scanned 5 times at an interval of ~4 weeks, within an age range of 13 to 30 weeks old. Imaging parameters for TRUST MRI were: TR/TE=3500/6.5ms, FOV=15×15mm2, matrix=128×128, post-labeling delay=1000 ms.2 Data analysis: For the cross-sectional data, t tests were used to compare OEF between young WT and older WT, and between older WT and older AD. For the longitudinal data, a linear mixed-effect model was applied on each group to examine the effect of time on OEF. Furthermore, data from the WT and AD groups underwent a multi-linear mixed-effect model, which allowed us to examine whether the initial OEF (e.g. at first time point) was different between groups and whether the rate of OEF change was different between groups.Results and Discussion
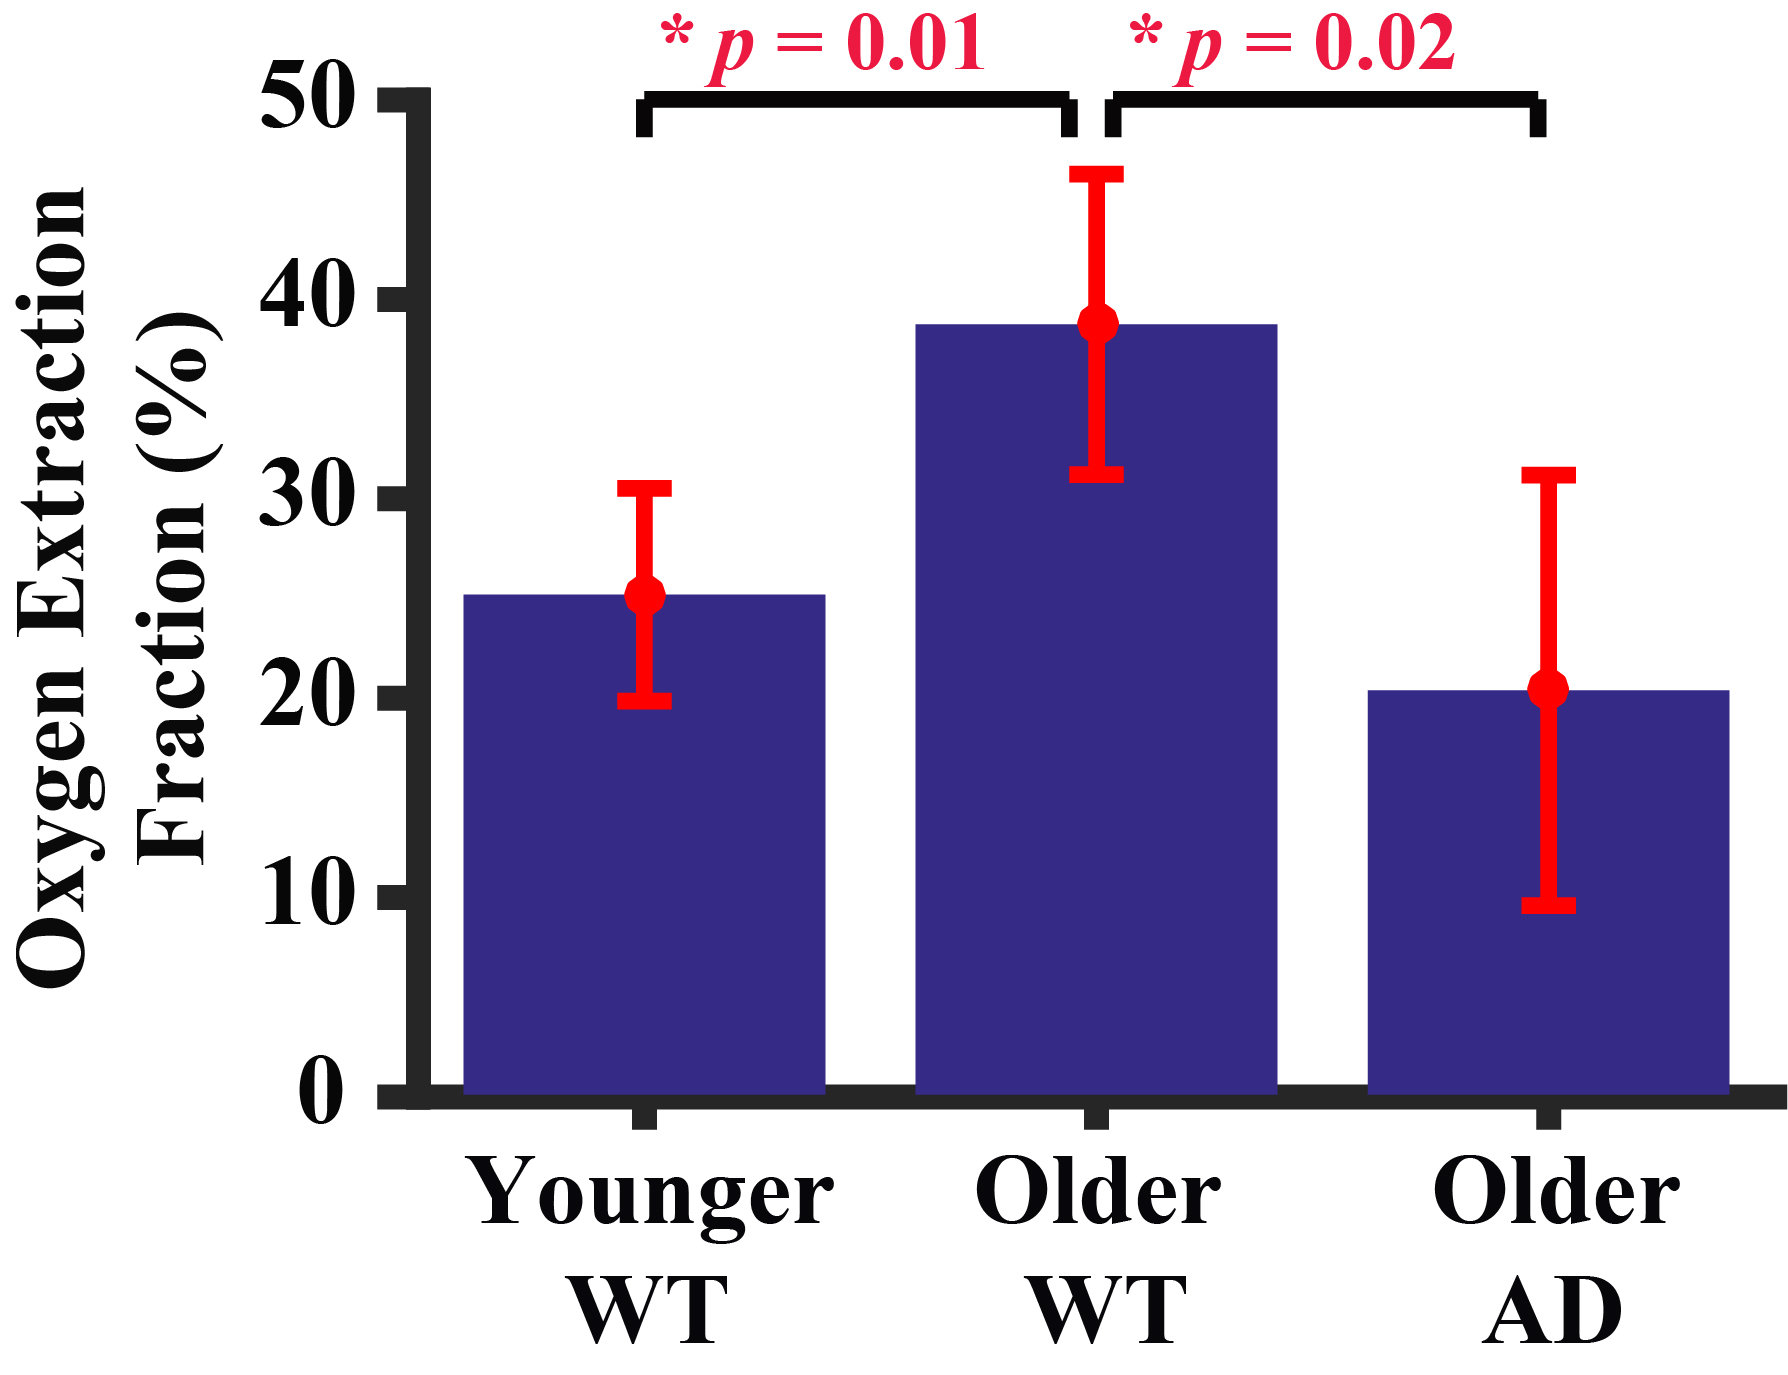
Figure 1 shows a representative dataset of TRUST MRI. Pair-wise subtraction between control and label images results in three difference images containing pure venous blood signals at different T2 weightings. A monoexponential fitting of the signal as a function of TE (Figure 1) yielded venous blood T2, which was further converted into Yv3 for estimation of OEF. Figure 2 summarizes the results of the cross-sectional study. A significant difference (p=0.01) was observed between the young and older WT mice. Older mice were found to have a higher OEF. This finding is consistent with those reported in human aging studies4 and was partly attributed to an age-related reduction in CBF (thereby oxygen delivery). Some reports also suggested that the brain’s oxygen consumption rate was elevated in normal aging, which would further increase OEF.5 Comparing the WT mice, the AD mice were found to have a lower OEF (p=0.02). The reduced OEF in AD mice may be attributed to a diminished brain metabolic rate following amyloid accumulation and, potentially, neurodegeneration.Figure 3 shows the longitudinal time-courses of OEF in each WT and AD mouse. In the WT group, a significant OEF increase with time (p<0.001) was observed, consistent with the age-effect seen in the cross-sectional study. In the AD group, there is also a trend of increase (p=0.07), but the slope was lower than that in WT group. A multi-linear analysis including both groups (WT and AD) revealed that, surprisingly, OEF at the first time point (at an age of 13 weeks) was different (p<0.001) between the groups. The AD mice manifested a higher OEF compared to WT mice. This appears to suggest that brain physiology of the AD mice is different from that of WT even at a young age, presumably attributed to either a lower oxygen supply or higher oxygen consumption. A trend (p=0.053) of interaction between group and time point was seen, suggesting that the WT group has a more rapid rate of OEF increase (with time) compared to the AD group (Figure 3).Conclusion
We demonstrated that normal aging and Alzheimer’s disease have different effects on brain OEF, which may reflect the dynamic nature of changes in brain energy homeostasis during these two processes. TRUST MRI may be a useful tool in elucidating physiological mechanisms of brain diseases in mouse models.Acknowledgements
No acknowledgement found.References
1. Lu H, Ge Y. Quantitative evaluation of oxygenation in venous vessels using T2-Relaxation-Under-Spin-Tagging MRI. Magn. Reson. Med. 2008; 60 (2): 357-363.
2. Wei Z, Xu J, Liu P, Chen L, Li W, van Zijl P, Lu H. Quantitative assessment of cerebral venous oxygenation in mouse using T2-Relaxation-Under-Spin-Tagging (TRUST) MRI at 11.7T. Proc. Intl. Soc. Mag. Reson. Med. 2017; 25:5232.
3. Lin A, Qin Q, Zhao X, Duong T. Blood longitudinal (T1) and transverse (T2) relaxation time constants at 11.7 Tesla. Magn. Reson. Mater. Phys. 2012; 25 (3): 245-249.
4. Peng S, Dumas J, Park D, et al. Age-related increase of resting metabolic rate in the human brain. NeuroImage 2014; 98:176-183.
5. Lu H, Xu F, Rodrigue K, et al. Alterations in cerebral metabolic rate and blood supply across the adult lifespan. Cereb. Cortex 2011; 21:1426-1434.
Figures