3747
Assessment of different molecular iron forms in the brain tissue of Alzheimer patients1Radiology Dept., Leiden University Medical Center, Leiden, Netherlands, 2Leiden Institute of Physics, Leiden, Netherlands, 3Biostatistics Dept., Leiden University Medical Center, Leiden, Netherlands, 4Human Genetics Dept., Leiden University Medical Center, Leiden, Netherlands
Synopsis
Magnetic Resonance Imaging (MRI) has the potential to measure iron accumulation in the brain of Alzheimer patients. However, current MRI techniques cannot differentiate between different molecular iron forms. We have recently developed a combination of MRI, EPR and SQUID magnetometry, to quantify specific molecular iron forms in brain tissue. In this current study of AD patients and
INTRODUCTION
In the context of Alzheimer’s disease (AD) the presence of iron is important since it can induce toxicity via the production of the hydroxyl radical1–3, when not properly stored in ferritin. Mineralized iron forms or weakly-bound iron (if highly concentrated) reduce the proton spin-spin relaxation times (T2 and T2*)4–6, and so can be detected by MRI7,8. Susceptibility-weighted imaging (SWI)9–11 and quantitative susceptibility mapping (QSM)12–14 are currently employed to indirectly visualize brain iron, but they cannot differentiate between the various molecular iron forms, which are thought to play different roles in AD. In order to provide a quantitative picture of different molecular iron forms in the brain, we recently developed analysis tools consisting of MRI, electron paramagnetic resonance (EPR) and Superconducting Quantum Interference Device (SQUID) magnetometry15. Here, we apply these techniques to the brain tissue of 22 AD patients and 14 controls.METHODS
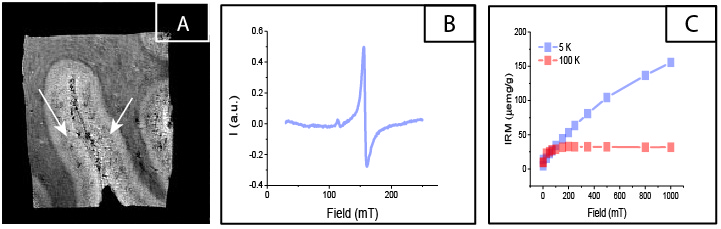
Formalin-fixed brain tissue (middle temporal lobe) was obtained from the Netherlands Brain Bank. High-spatial-resolution 7T-MRI scans were obtained with a three-dimensional T2*-weighted Multi-Gradient-Echo sequence. Repetition time TR = 75 ms, echo spacing TE = 12.5, 23.3, 33.9 and 44.6 ms, 100 µm isotropic resolution, flip angle = 15˚, 10 averages, 140 x 240 pixels. Guided by the MRI scan, a region of interest (ROI) was chosen in the grey matter where dark bands were observed (Fig. 1A). A tissue section in the ROI was dissected and studied by EPR. The concentration of Fe(III) was determined by EPR (Fig. 1B) for each patient. Subsequently, an adjacent tissue block was studied by SQUID magnetometry (Fig. 1C). Isothermal Residual Magnetization (IRM) curves were measured at 100 K and 5 K, and fitted to derive the concentration of magnetite and ferritin nanoparticles, together with their magnetic moment16–18. From the magnetic moment of ferritin, we obtained the ferritin loading ratio (FLR)19. Statistical analysis was performed using R studio.RESULTS
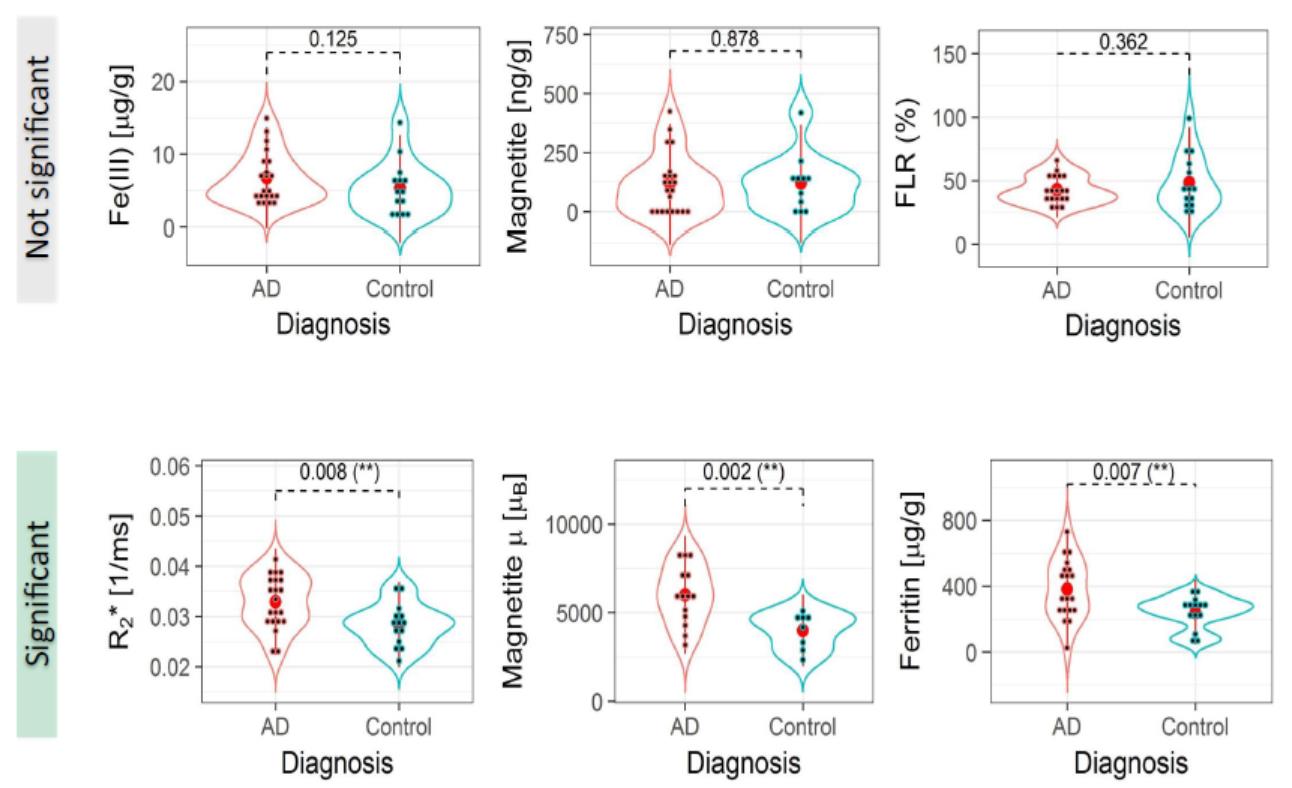
The value of R2*, obtained from the median of the ROI, was higher in the AD group vs the control group (Student's t-test, p = 0.008). The ferritin concentration was larger in the AD group (p = 0.007), while the FLR did not show a significant difference between the two groups (p = 0.362). Magnetite concentration was not different between the two groups (p = 0.878), although the magnetic moment of the particles was larger in the AD group (p = 0.002). Fe(III) concentration was not significantly different between the groups (p = 0.125). Fig. 2 summarizes the results.
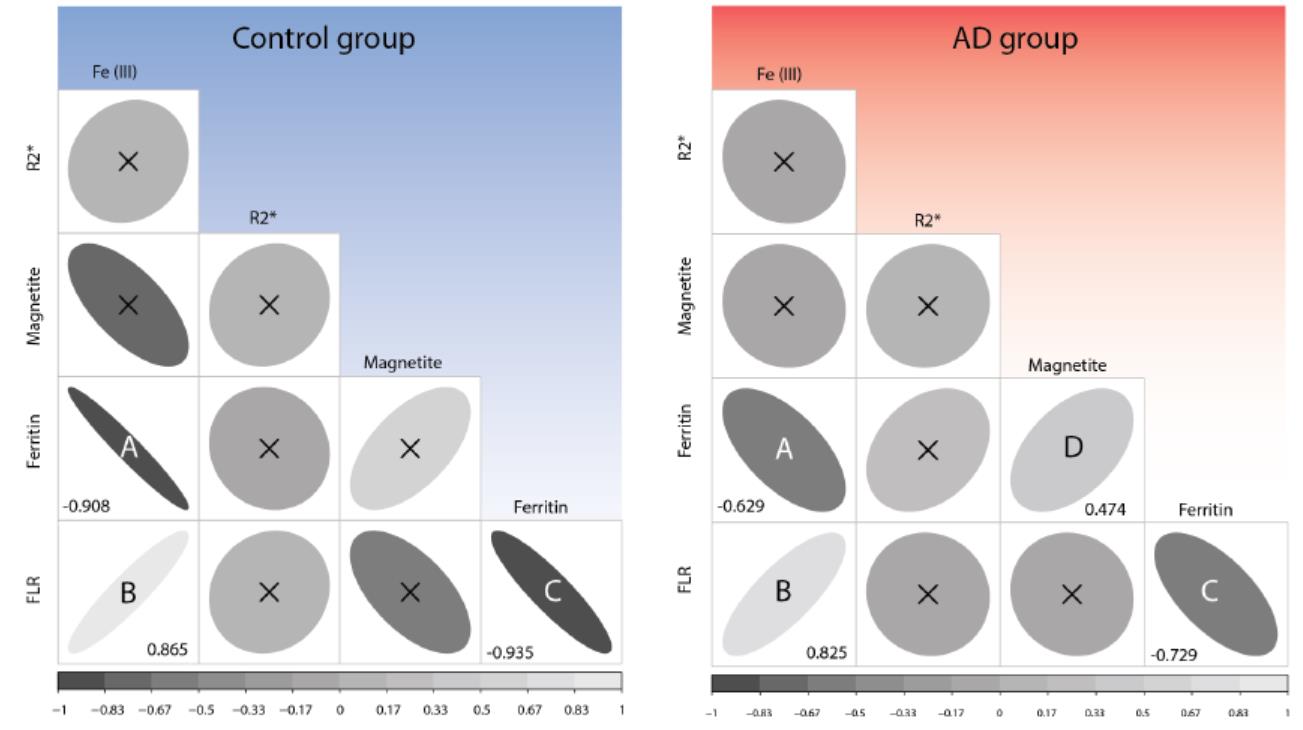
Additionally, we found that Fe(III) concentration positively associates with the FLR (Spearman’s r = 0.825, in AD patients, and 0.856 in controls). Ferritin concentration correlates negatively with the FLR (r = -0.729 in AD patients, and -0.935 for controls), whereas magnetite concentration associates positively with ferritin concentration (r = 0.474, in the AD group). See Fig. 3 for the correlogram (partial correlation not included).
DISCUSSION
Our results on ferritin and the FLR indicate that ferritin may be overexpressed in the AD brain. Recent work has shown that ferritin levels in the cerebrospinal fluid and in the plasma can be used as predictors of AD21,22. In contrast to previous reports23, our study does not find evidence for higher magnetite levels in the AD patients. However, the larger magnetic moment of magnetite observed in AD patients suggests that when magnetite particles are present in the tissue, the interaction with amyloid may affect their size. From the correlation study, we observed that Fe(III) is associated with the amount of iron stored in the ferritin core. The observed negative correlation between ferritin and FLR may be understood in a scenario in which ferritin over-expression is initiated as a protective mechanism20, when the cytoplasmic iron pool increases. This may lead to non-homogeneously and less-filled proteins. Finally, while R2* increases in the AD group, as already observed7,24, the same parameter does not correlate with any iron forms measured here. This may be due to the small dynamical range of iron concentration within the temporal cortex, or to a discrepancy in the resolution between the different techniques. Eventually, R2* increase may also originate from susceptibility changes occurring in tissue lesions, or myelin changes taking place in AD.CONCLUSIONS
For the first time, different molecular iron forms have been studied in the brain and compared with magnetic resonance R2* values. Our results show that ferritin concentration and the magnetic moment of magnetite are significantly higher in the brain of AD patients than controls. Given the large magnetic moment associated with those particles, this study suggests that MRI could be employed to selectively identify them.Acknowledgements
We are grateful to Marc Derieppe for helping with the Matlab code for the MRI data, L. van der Graaf, J. Aarts, N. Lebedev and C. Koeleman for technical assistance during ferritin freeze-drying and characterization. This work was supported by the Dutch Foundation for fundamental Research on Matter (FOM), by the Netherlands Organization for Scientific Research (NWO) through a VICI fellowship to T. H. O. One of us (M. B.) was supported by the FP7 European UnionMarie Curie IAPP Program, BRAINPATH, under grant number 612360. Partial funding was provided by European ResearchCouncil, Advanced Grant 670629 NOMA MRI.References
1. Ward, R. J., Zucca, F. A., Duyn, J. H., Crichton, R. R. & Zecc, L. The role of iron in brain ageing and neurodegenerative disorders. Lancet Neurol. 13, 1045–1060 (2014).
2. Duck, K. A. & Connor, J. R. Iron uptake and transport across physiological barriers. BioMetals 29, 573–591 (2016).
3. Núñez, M. T. et al. Iron toxicity in neurodegeneration. BioMetals 25, 761–776 (2012).
4. Haacke, E. M. et al. Imaging iron stores in the brain using magnetic resonance imaging. Magn. Reson. Imaging 23, 1–25 (2005).
5. Hocq, A. et al. Variable-field relaxometry of iron-containing human tissues: A preliminary study. Contrast Media Mol. Imaging 4, 157–164 (2009).
6. Gossuin, Y., Gillis, P., Hocq, A., Vuong, Q. L. & Roch, A. Magnetic resonance relaxation properties of superparamagnetic particles. Nanomedicine and nanobiotechnology 1, 299–310 (2009).
7. van Rooden, S. et al. 7T T2*-weighted magnetic resonance imaging reveals cortical phase differences between early- and late-onset Alzheimer’s disease. Neurobiol. Aging 36, 20–26 (2015).
8. Nabuurs, R. J. a et al. High-field MRI of single histological slices using an inductively coupled, self-resonant microcoil: application to ex vivo samples of patients with Alzheimer’s disease. NMR Biomed. 24, 351–7 (2011).
9. Yao, B. et al. Susceptibility contrast in high field MRI of human brain as a function of tissue iron content. Neuroimage 44, 1259–1266 (2009).
10. Brown, R. W., Cheng, Y.-C. N., Haacke, E. M., Thompson, M. R. & Venkatesan, R. Magnetic Resonance Imaging: Physical Principles and Sequence Design. (John Wiley & Sons, Inc., Hoboken, 2015). doi:10.1017/CBO9781107415324.004
11. Xu, X., Wang, Q. & Zhang, M. Age, gender, and hemispheric differences in iron deposition in the human brain: An in vivo MRI study. Neuroimage 40, 35–42 (2008).
12. Haacke, E. M. et al. Quantitative susceptibility mapping: Current status and future directions. Magn. Reson. Imaging 33, 1–25 (2015).
13. Acosta-Cabronero, J. et al. In vivo quantitative susceptibility mapping (QSM) in Alzheimer’s disease. PLoS One 8, (2013).
14. Acosta-Cabronero, J., Betts, M. J., Cardenas-Blanco, A., Yang, S. & Nestor, P. J. In Vivo MRI Mapping of Brain Iron Deposition across the Adult Lifespan. J. Neurosci. 36, 364–74 (2016).
15. Kumar, P. et al. A novel approach to quantify different iron forms in ex-vivo human brain tissue. Sci. Rep. 6, 1–13 (2016).
16. Goya, G. F., Berquó, T. S., Fonseca, F. C. & Morales, M. P. Static and dynamic magnetic properties of spherical magnetite nanoparticles. J. Appl. Phys. 94, 3520 (2003).
17. Dar, M. I. & Shivashankar, S. a. Single crystalline magnetite, maghemite, and hematite nanoparticles with rich coercivity. RSC Adv. 4, 4105–4113 (2014).
18. Makhlouf, S. a., Parker, F. T. & Berkowitz, a. E. Magnetic hysteresis anomalies in ferritin. Phys. Rev. B 55, R14717–R14720 (1997).
19. Harris, J. G. E., Grimaldi, J. E., Awschalom, D. D., Chiolero, a & Loss, D. Excess Spin and the Dynamics of Antiferromagnetic Ferritin. Phys. Rev. B 60, 4 (1999).
20. Wang, H. et al. Iron overload coordinately promotes ferritin expression and fat accumulation in Caenorhabditis Elegans. Genetics 203, 241–253 (2016).
21. Ayton, S. et al. Ferritin levels in the cerebrospinal fluid predict Alzheimer’s disease outcomes and are regulated by APOE. Nat. Commun. 6, 6760 (2015).
22. Goozee, K. et al. Elevated plasma ferritin in elderly individuals with high neocortical amyloid-β load. Mol. Psychiatry 1–6 (2017). doi:10.1038/mp.2017.146
23. Pankhurst, Q., Hautot, D., Khan, N. & Dobson, J. Increased levels of magnetic iron compounds in Alzheimer’s disease. J Alzheim Dis 13, 49–52 (2008).
24. Bulk, M. et al. Post-mortem MRI and histology demonstrate differential iron accumulation and cortical myelin organization in early and late onset Alzheimer’s disease. Neurobiol. Aging (2017). doi:10.1016/j.neurobiolaging.2017.10.017
Figures