3746
MRI based assessment of cerebrovascular pathology in Alzheimer’s disease1The Australian e-Health Research Centre, CSIRO Health and Biosecurity, Brisbane, Australia, 2Departments of Medicine and Neurology, The Royal Melbourne Hospital, Parkville, Australia, 3Florey Institute of Neuroscience and Mental Health Research, Parkville, Australia, 4Department of Radiology, The Royal Melbourne Hospital, University of Melbourne, Parkville, Australia, 5National Ageing Research Institute, Melbourne, Australia, 6Academic Unit for Psychiatry of Old Age, University of Melbourne, Melbourne, Australia, 7Cogstate, Melbourne, Australia, 8Centre of Excellence for Alzheimer’s Disease Research and Care, Edith Cowan University, Joondalup, Australia, 9Department of Medicine, Austin Health, University of Melbourne, Heidelberg, Australia, 10Department of Nuclear Medicine and Centre for PET, Austin Health, Heidelberg, Australia
Synopsis
Cerebrovascular disease often coexists with Alzheimer’s disease (AD) and its contribution to the development of AD remains unclear. This study assessed cerebrovascular pathology in terms of brain infarction and white matter hyperintensities (WMH) in the AIBL study, and investigated its impact on amyloid deposition. Our data revealed significantly greater WMH burden and higher prevalence of cerebrovascular pathology in AD patients. No correlation was found between amyloid load and WMH in either healthy controls, mild cognitive impairment or AD. Moreover, the presence of cerebrovascular pathology showed no association with amyloid deposition in subjects with or without AD.
Introduction
Alzheimer’s disease (AD) is the most common cause of dementia and one of its hallmarks is the presence of amyloid-β plaques in the cerebral cortex1. Imaging markers of cerebrovascular disease also commonly occur in the aging brain and can coexist with AD, having a synergic effect on cognitive decline2. Although some studies suggest that vascular risk factors increase the risk of AD, the contribution of cerebrovascular pathology to the development of AD still remains unclear. The aim of this study is to assess the prevalence of cerebrovascular pathology using MR images and to investigate its association with amyloid deposition in the Australian Imaging, Biomarkers and Lifestyle (AIBL) cohort.Methods
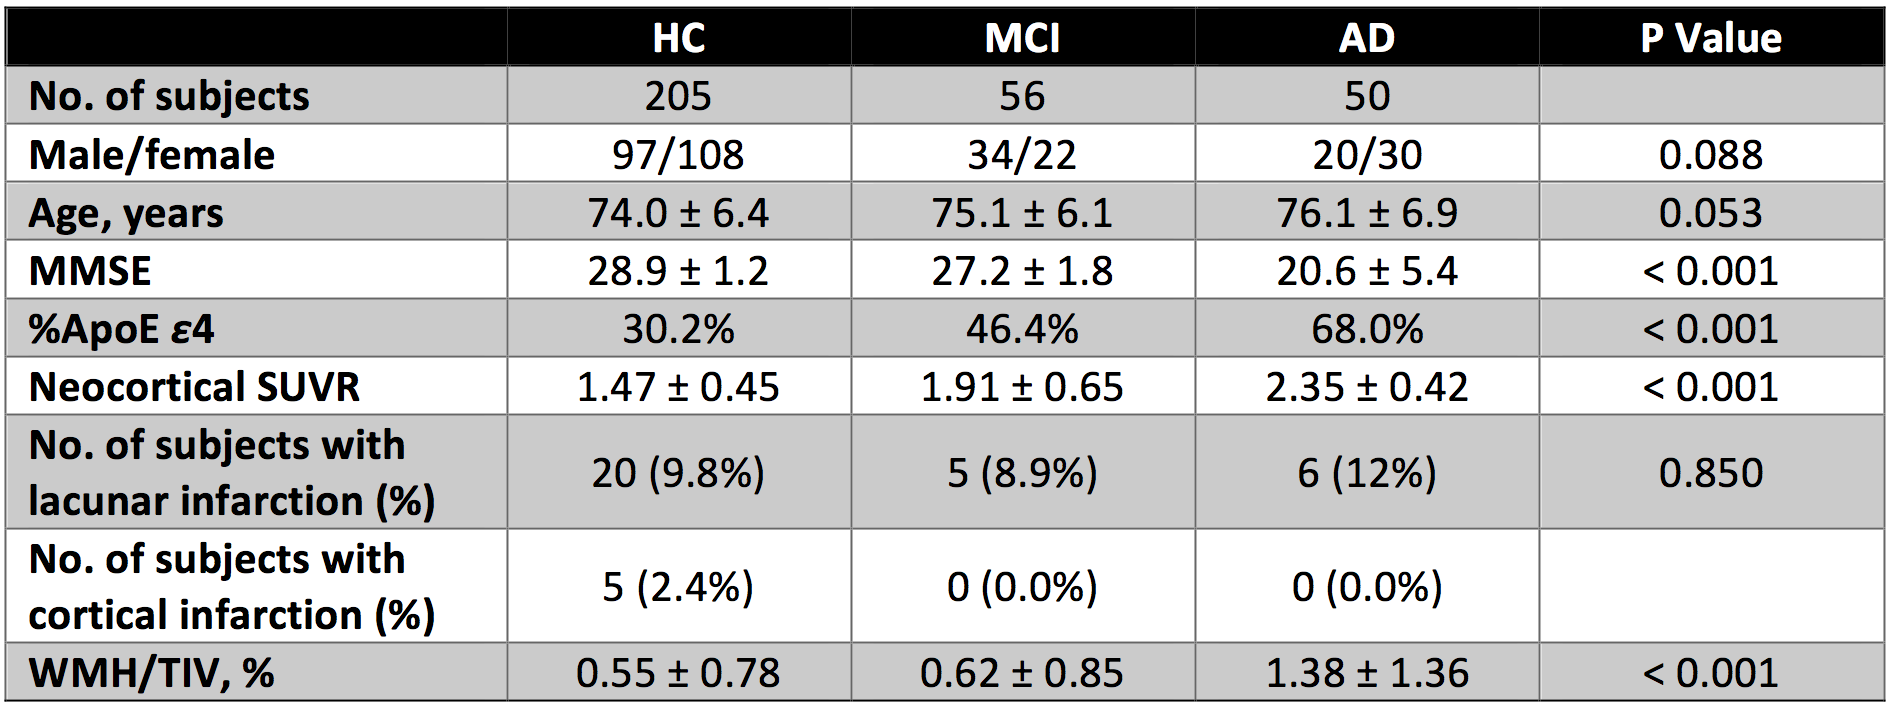
Participants Three hundred eleven participants (demographic information summarized in Table 1) that have been recruited into the AIBL study3 were included in this work.
Amyloid assessment was performed using CapAIBL4, which automatically estimated the neocortical standardised uptake value ratio (SUVR) from each PiB-PET image. A threshold was applied to separate participants with high versus low PiB retention, which are the amyloid-positive (A+) group (neocortical SUVR ≥ 1.4) and amyloid-negative (A-) group (neocortical SUVR < 1.4).
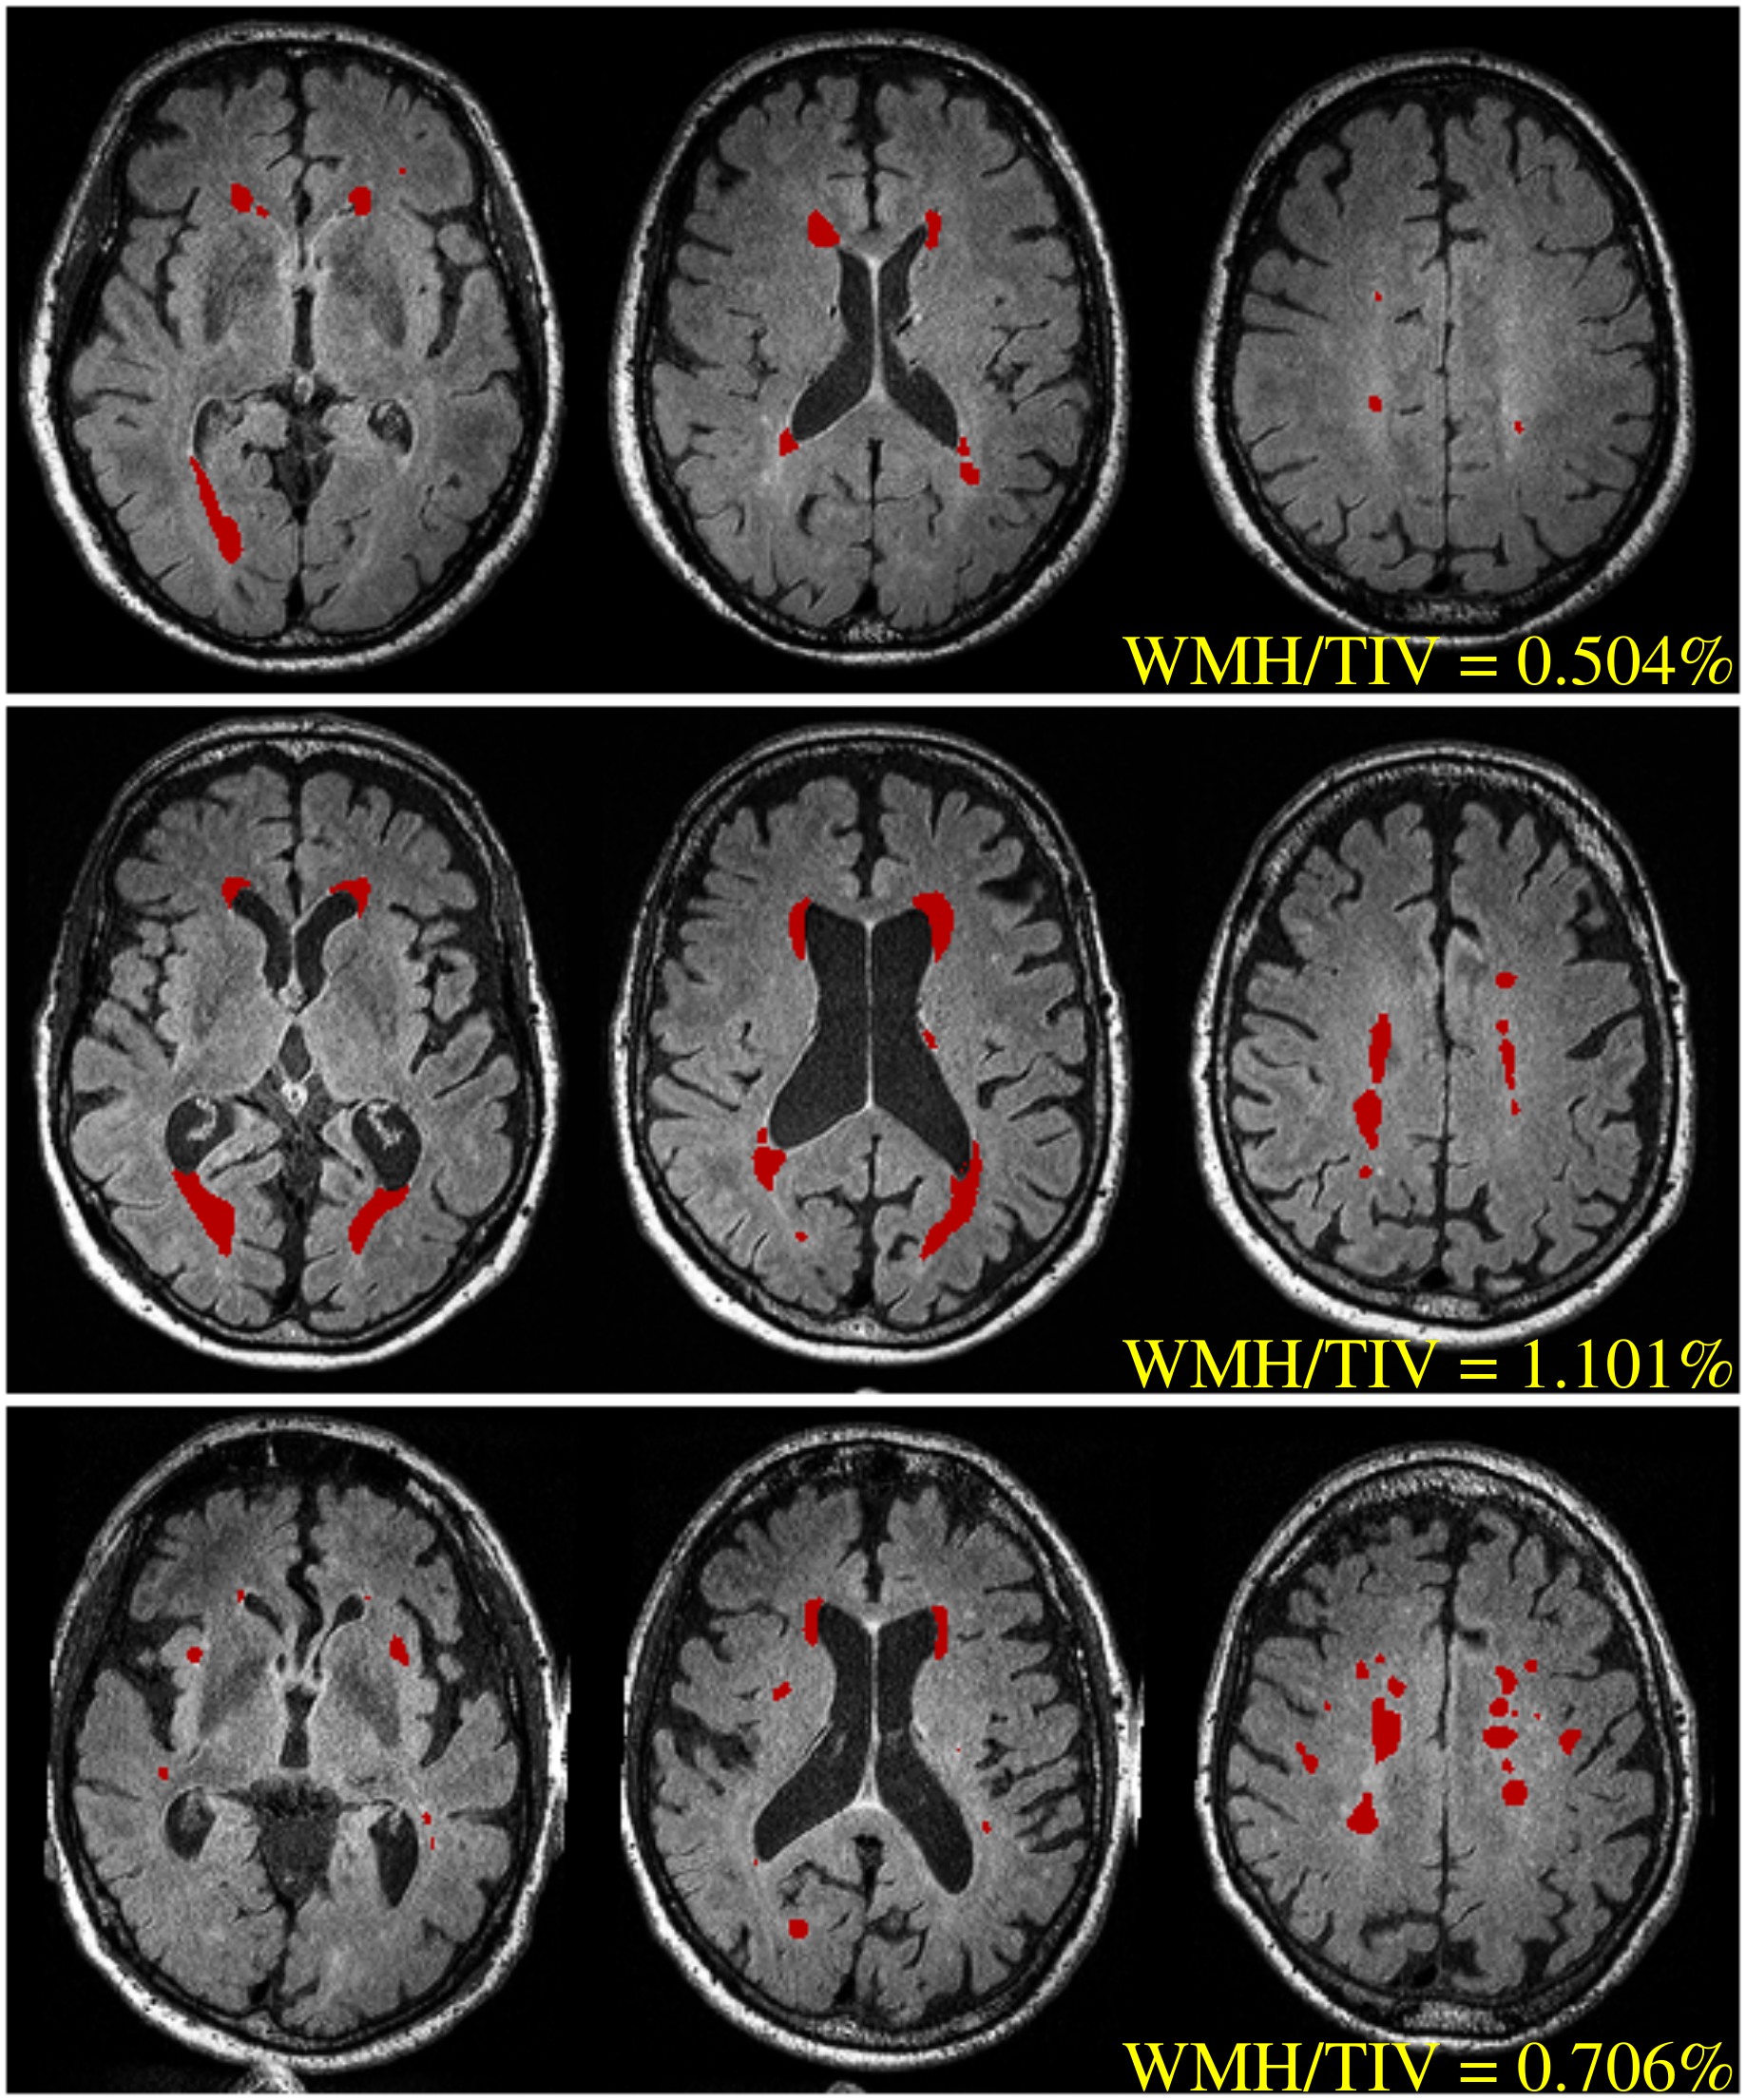
Cerebrovascular assessment was performed on 3D FLAIR images (0.98x0.98x0.9 mm3) to quantify brain infarction and white matter hyperintensity (WMH). Brain infarcts were screened by a stroke neurologist to identify lacunar infarcts and cortical infarcts (≥ 1 cm in largest diameter). WMH volumes were automatically quantified using the HyperIntensity Segmentation Tool (HIST) based on an ensemble of pre-trained neural network classifiers5. WMH volumes were normalised by the total intracranial volumes (TIV), i.e., WMH/TIV (%), and then adjusted for age and different MR scanner.
To determine the presence and absence of cerebrovascular pathology, a cut-off for WMH/TIV was estimated in a non-demented sample (N = 182, aged over 70) that matched previous work6 indicating that the prevalence of cerebrovascular disease in such an elderly population was around 33%. Accordingly, cerebrovascular positivity was determined using both assessment results, where the cerebrovascular-positive (V+) group was defined as subjects with a brain infarct and/or WMH/TIV above the cut-off.
Results
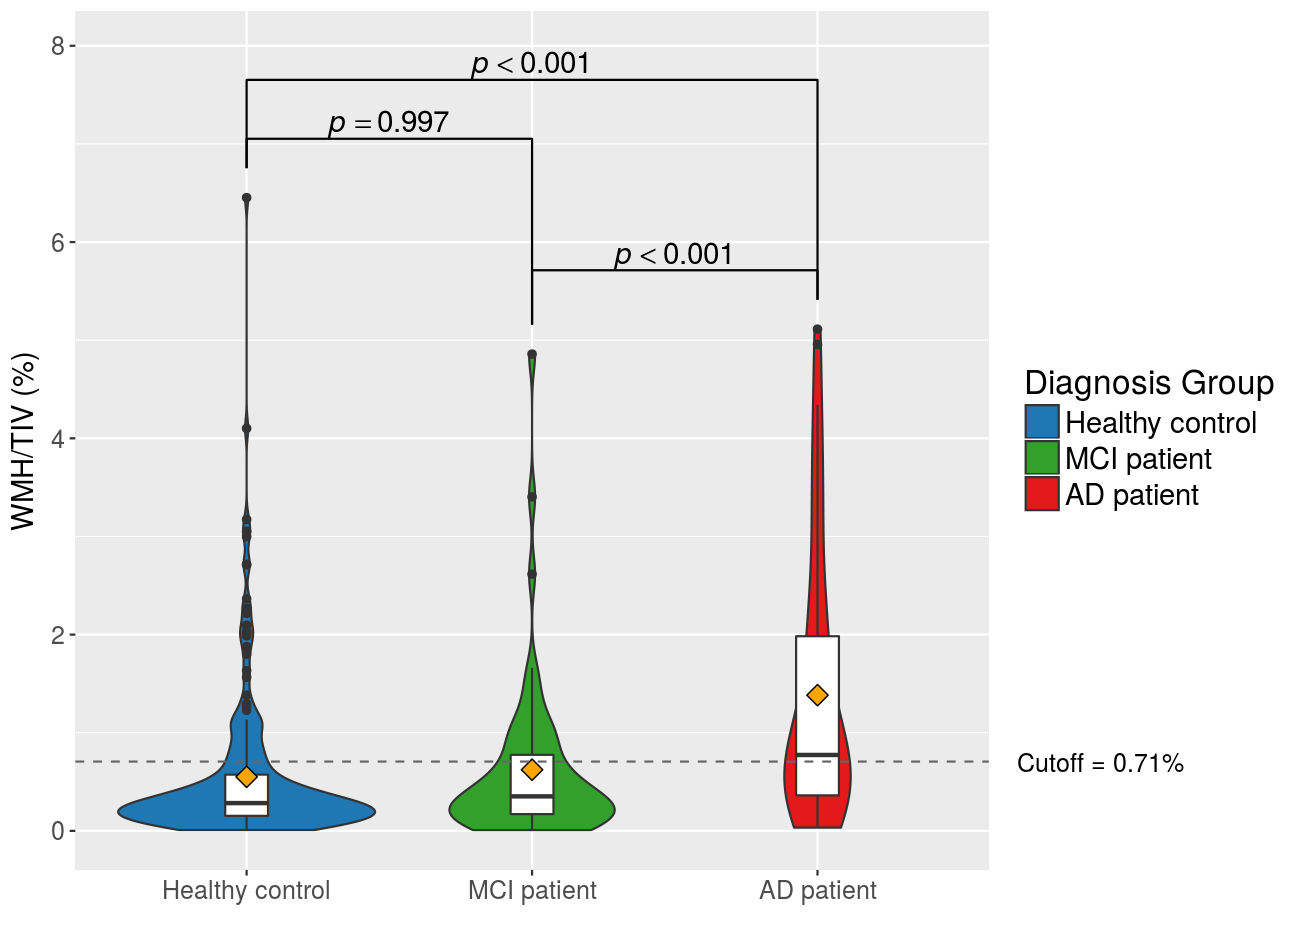
Significantly higher WMH measures were observed in the AD group, while there was no difference between the healthy control (HC) and mild cognitive impairment (MCI) groups (Figure 1). No significant difference was revealed in the prevalence of brain infarction between groups. According to the assumed prevalence of 33% in the non-demented sample from the AIBL study, the WMH cut-point was 0.71% for determining cerebrovascular positivity. This translated to a cerebrovascular pathology prevalence of 56% in AD group.
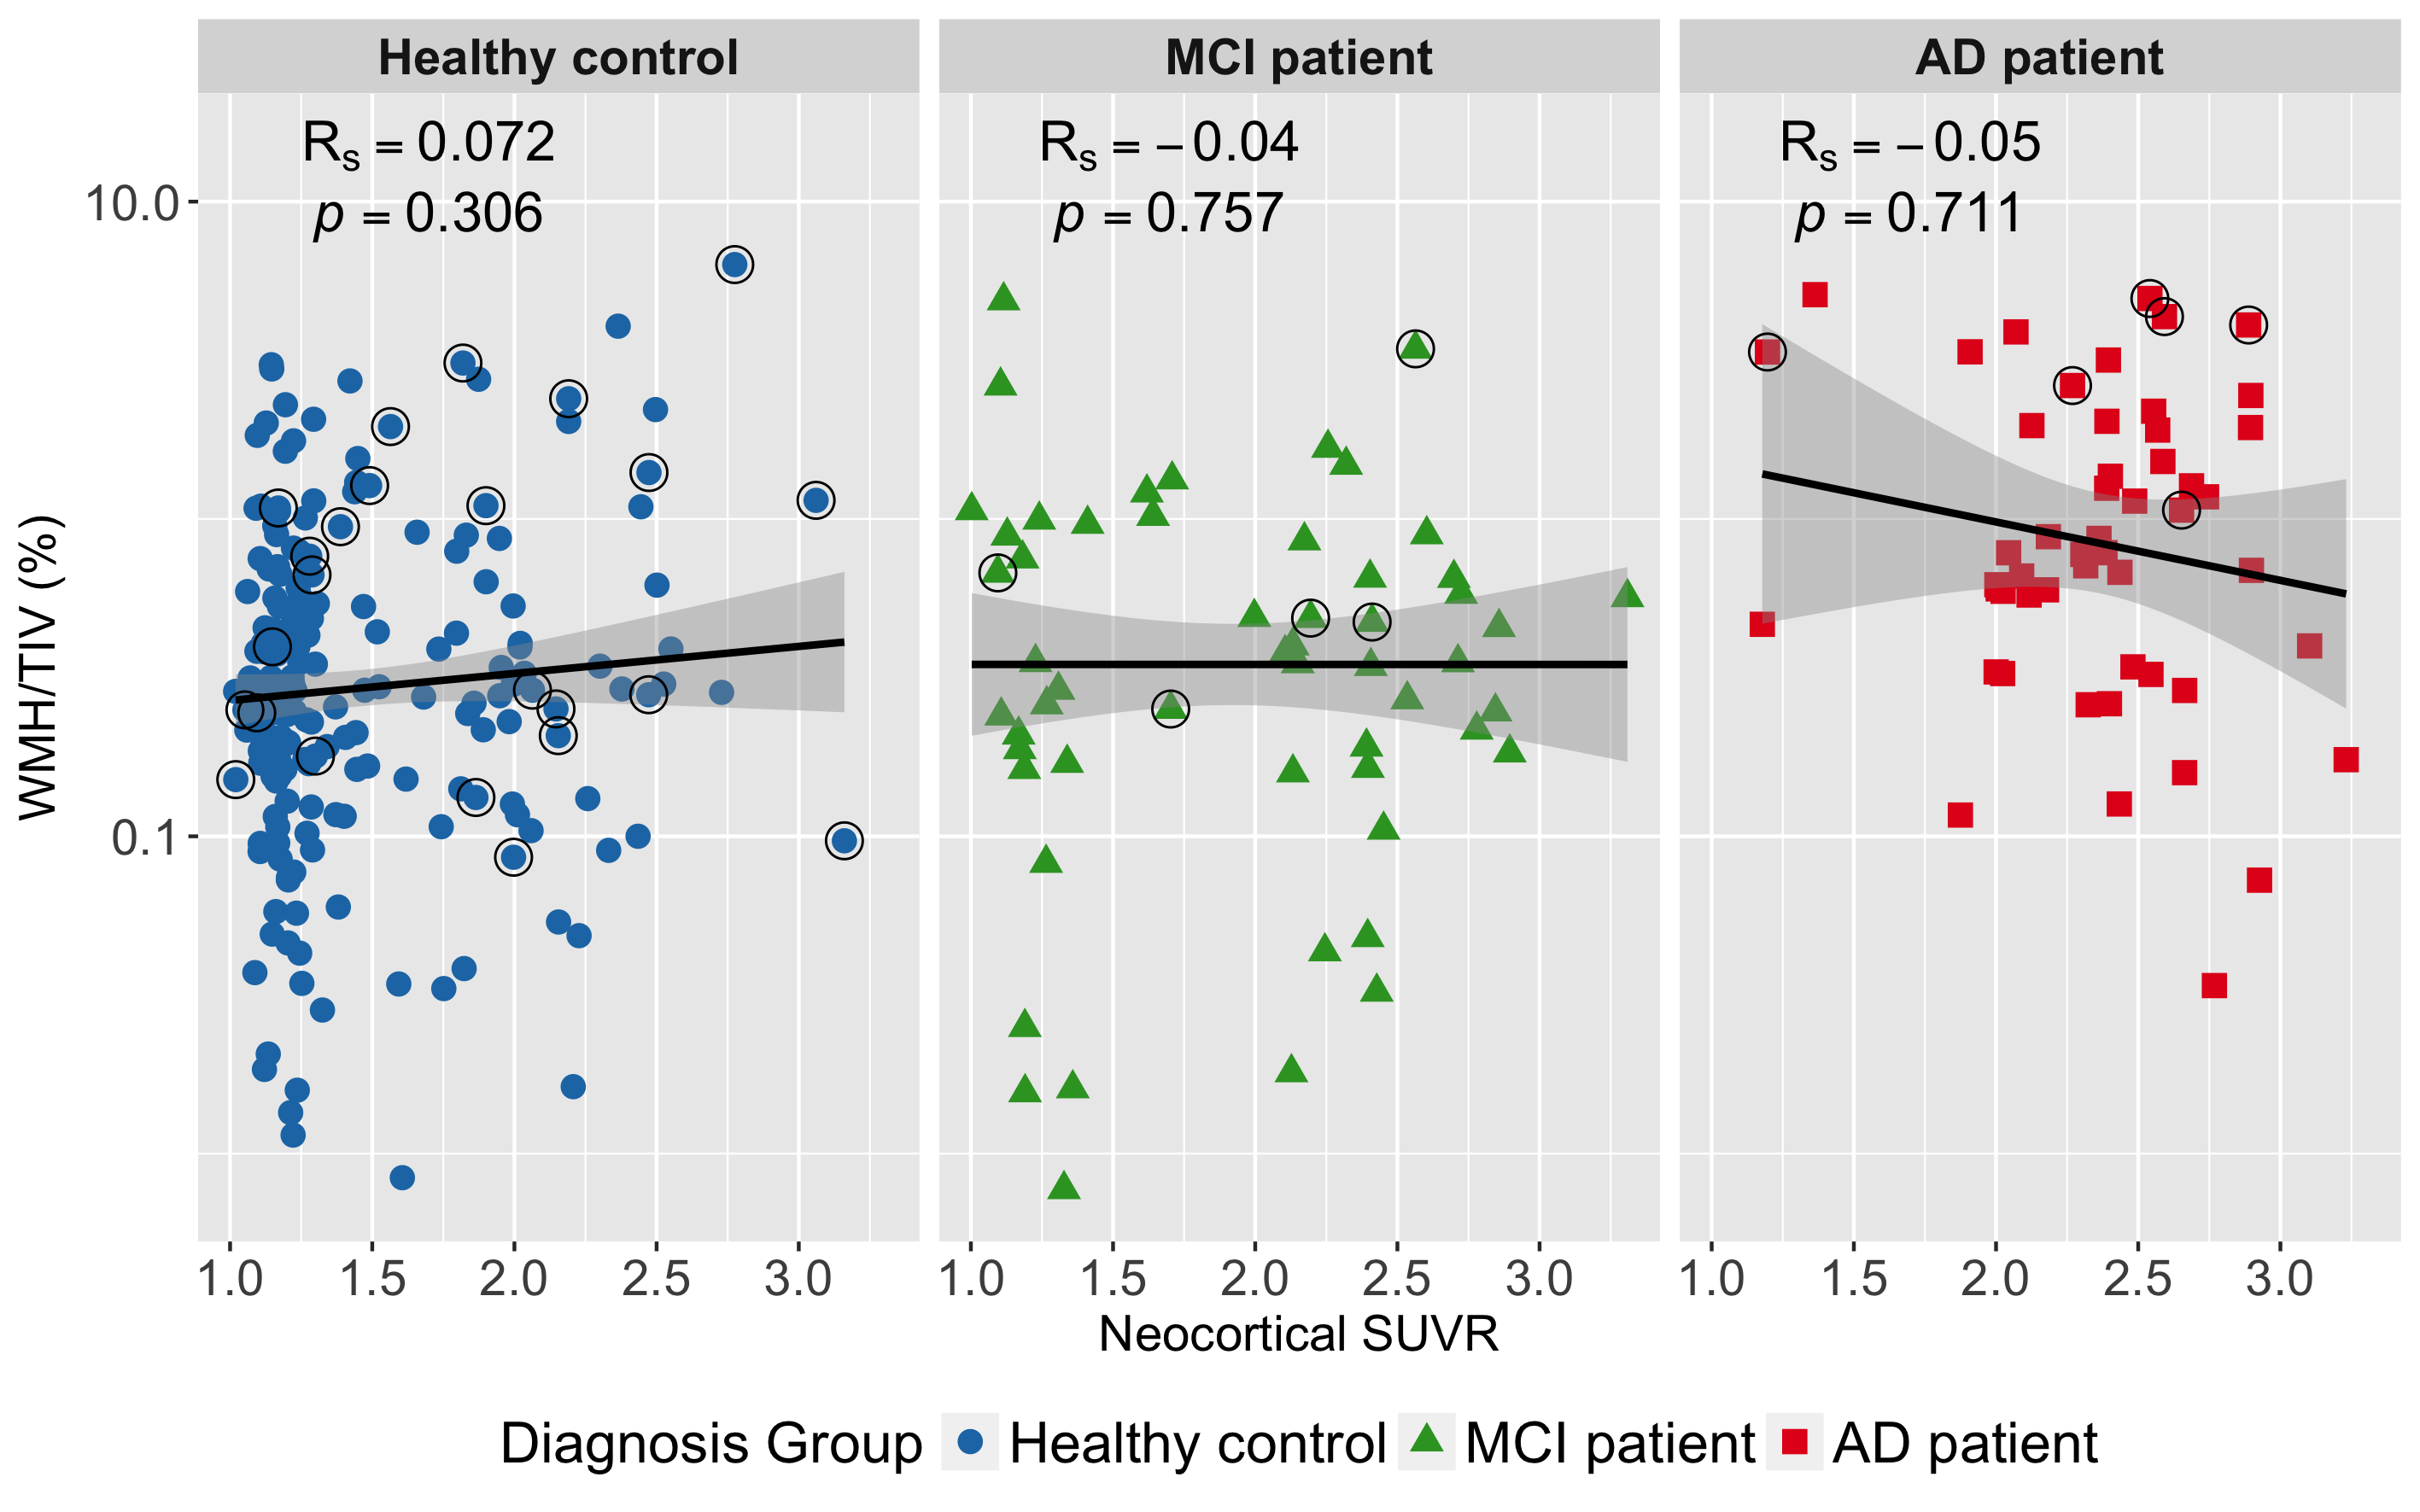
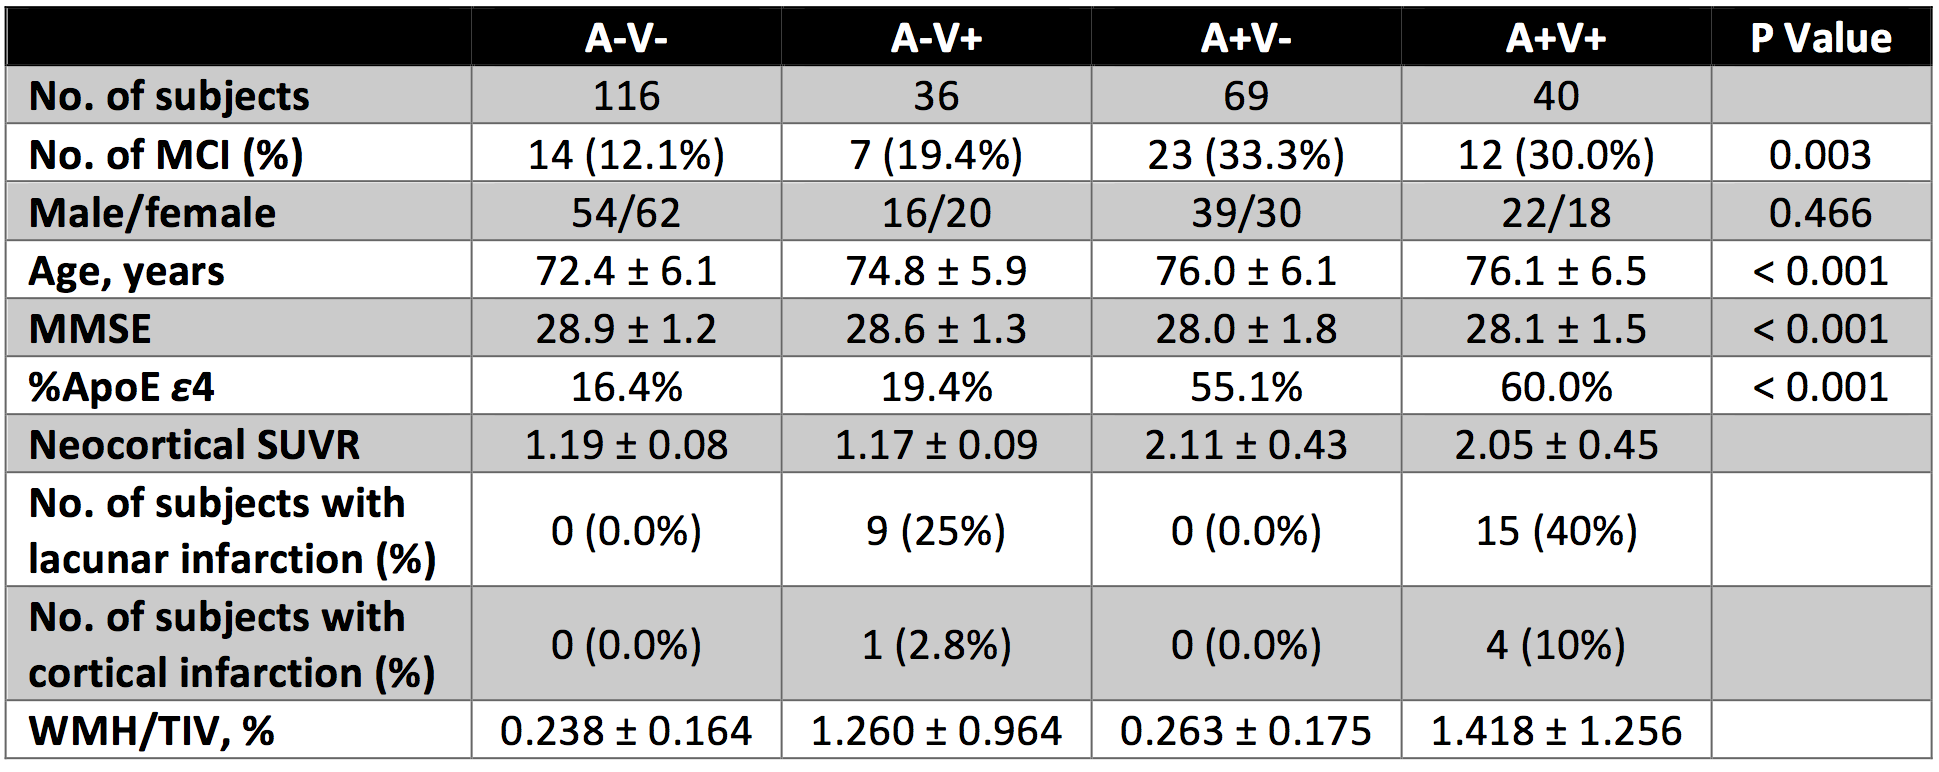
Figure 2 demonstrates no significant correlation between amyloid load and WMH in either HC, MCI or AD group. To further examine the interaction between cerebrovascular pathology on amyloid deposition, all AIBL participants were categorized into four subgroups based on amyloid and cerebrovascular positivity. Table 2 summarises parameters between subgroups in non-demented participants, which shows differences in MMSE and ε4 status between A- and A+ groups but not within subgroups of A-V- and A-V+ as well as subgroups of A+V- and A+V+. Furthermore, the neocortical SUVR values did not vary with the presence (V+) or absence (V-) of cerebrovascular pathology in either A- (p = 0.220) or A+ (p = 0.498) group of non-demented participants as well as A+ (p = 0.441) group of AD patients.
Discussion
In this work, significantly heavier WMH burden in AD patients has been confirmed in our AIBL cohort. The cut-off of WMH/TIV measures defining cerebrovascular positivity was found to be 0.71% from the subset of non-demented sample, which is higher than the previously used threshold of 0.5%7,8, but lower than the threshold of 1.11 % reported in another recent study6. This may be caused by differences in the recruitment mechanism and specific inclusion/exclusion criteria of the AIBL cohort compared. Nevertheless, using this estimated cut-off of WMH/TIV, the prevalence of cerebrovascular pathology in AD patients was examined to be much more frequent than that in non-demented participants (56% vs 33%), consistent with published findings2.
Regression analyses found that no significant correlation between WMH and amyloid load (Figure 2). Also, there was no observed difference in amyloid burden between subjects with or without cerebrovascular pathology for either the A- or A+ group in non-demented participants as well as A+ group in AD patients. These all provided cross-sectional evidence suggesting an independence of the association between amyloid load and the presence of cerebrovascular pathology. To confirm these findings, future longitudinal studies are needed.
Acknowledgements
No acknowledgement found.References
1. Klunk, W. E. et al. Imaging brain amyloid in Alzheimer’s disease with Pittsburgh Compound-B. Ann. Neurol. 55, 306–319 (2004).
2. Jellinger, K. A. & Attems, J. Prevalence and impact of cerebrovascular pathology in Alzheimer’s disease and parkinsonism. Acta Neurol. Scand. 114, 38–46 (2006).
3. Ellis, K. A. et al. The Australian Imaging, Biomarkers and Lifestyle (AIBL) study of aging: methodology and baseline characteristics of 1112 individuals recruited for a longitudinal study of Alzheimer’s disease. Int. Psychogeriatr. 21, 672–687 (2009).
4. Bourgeat, P. et al. Comparison of MR-less PiB SUVR quantification methods. Neurobiol. Aging. 36, Supplement 1, S159–S166 (2015).
5. Manjón, J. V. et al. HIST: HyperIntensity Segmentation Tool. in Patch-Based Techniques in Medical Imaging (eds. Wu, G., Coupé, P., Zhan, Y., Munsell, B. C. & Rueckert, D.) 92–99 (Springer International Publishing, 2016).
6. Vemuri, P. et al. Vascular and amyloid pathologies are independent predictors of cognitive decline in normal elderly. Brain 138, 761-771 (2015).
7. DeCarli, C. et al. The effect of white matter hyperintensity volume on brain structure, cognitive performance, and cerebral metabolism of glucose in 51 healthy adults. Neurology 45, 2077–2084 (1995).
8. Marchant, N. L. et al. Cerebrovascular disease, beta-amyloid, and cognition in aging. Neurobiol. Aging 33, 1006.e25 (2012).
Figures