3738
Multi-parametric MRI of the Proximal and Distal Nerves of the Leg: Longitudinal Findings in Patients with Inherited NeuropathiesMichael Pridmore1, Richard Dortch2, and Jun Li3
1Institute of Imaging Science, Vanderbilt University, Nashville, TN, United States, 2Radiology and Radiological Sciences, Vanderbilt Medical Center, Nashville, TN, United States, 3Neurology, Vanderbilt Medical Center, Nashville, TN, United States
Synopsis
This project proposes a multi-parametric set of MRI tools for assaying human inherited neuropathies in vivo, with the longer-term goal of establishing biomarkers of disease progression for future clinical trials. Previous research shows magnetization transfer ratio (MTR) values, which assay myelin content changes from demyelination and axonal loss, relate to disability in neuropathy patients. Here, we proposed additional fat-water (Dixon) imaging to assay fat replacement following deinnervation. MTR/Dixon data were collected in the sciatic/tibial nerves in patients with primary dysmyelinating inherited neuropathies. Longitudinal results showed lower that MTR/Dixon were responsive to disease progression.
Purpose
Promising treatments are on the horizon for a number of inherited neuropathies. However, the evaluation of therapies in human trails is hindered by lack of responsive biomarkers. The CMT neuropathy score (CMTNS) is a composite disability score proposed as a biomarker of CMT progression [4]. Unfortunately, the CTMNS was previously unable to detect progression over a two-year period. More recently, assay of muscle denervation via fat-water MRI has shown promise as a responsive biomarker [5]. This work hypothesizes that direct assay of nerve pathology via nerve MRI will yield biomarkers that are more sensitive to disease progression. To test this, we develop a multi-parametric set of MRI tools for assaying human inherited neuropathies in vivo. Magnetization transfer ratio (MTR) MRI provides information on myelin content changes from both demyelination and axonal loss [1]; and we previously demonstrated that MTR in proximal nerves relates to disability in patients with inherited neuropathies [2]. Here, we extend our protocol to the distal nerves of the leg to characterize the length-dependent (i.e., dying back) nature of certain neuropathies. More specifically, we scanned individuals with Hereditary Neuropathy with Liabilities to Pressure Palsies (HNPP), a primary dysmyelinating neuropathy with secondary axonal loss. Both the proximal (sciatic) and distal nerves (tibial) of the leg were scanned longitudinally to assess the ability of MTR to detect change over time. We additionally performed fat-water (Dixon) MRI for comparison.Methods
MTR/Dixon values were measured in four HNPP individuals (36–65 y.o.) proximal to the knee (sciatic nerve) and ankle (tibial nerve) at two timepoints (12.2 months apart). Age/gender-matched controls were scanned for comparison. Data acquisition: MTR data were acquired via a 3D, multi-shot EPI sequence acquired with and without application of an MT-prepulse (1000° nominal flip angle, 1.5 kHz off-resonance) and the following: resolution=0.8×0.8×6 mm3, TR/TE=60/11 ms, water-selective excitation pulse (10°), k-space lines per shot=5, SENSE factor=1, NEX=2, and total scan time ≈6 min. The RF transmit field (B1) was estimated using the actual flip angle imaging approach, and MTR values were corrected for B1 variations as previously described [1]. Finally, Dixon fat-water data were acquired via a six-echo gradient echo sequence (resolution=0.75×0.75×3 mm3, TR/first TE/echo spacing=300/13/18 ms, and total scan time ≈2 min). B1-corrected MTR maps were estimated using our previously published method [1], and mean slice-wise MTR values were calculated for sciatic/tibial nerves. For MTR, ROIs were manually selected for the sciatic/tibial nerves and mean slice-wise MTR parameters were estimated. For Dixon, the entire muscle was segmented and the median fat percentage (Fper) tabulated [3].Results
Figure 1 shows the anatomical proton density (PD), MTR, and Dixon maps in the thigh (sciatic nerve) for a representative patient and control subject. Likewise, Figure 2 shows the anatomical proton density (PD), MTR, and Dixon maps in the ankle (tibial nerve) for a representative patient and control subject. Summary results for MTR and Dixon values each timepoint and cohort (control/HNPP) are reported in Table 1. For HNPP individuals at the first scan, mean (±SD) MTR values demonstrated a length-dependent effect, with higher values in the sciatic nerve (39.24±2.93%) relative to the tibial nerve (36.20±1.97%). In the second session, this length-dependent effect was reduced in the thigh (36.01±1.66%) compared to the ankle (35.15±2.03%) in individuals with HNPP. Furthermore, sciatic nerve MTR values showed a trend toward a decrease within this small cohort (p=0.08). Fat percentage (Fper) values also detected a trend toward a change over time in the thigh (session1/2=8.76/7.01%, p=0.11) and ankle (8.87/7.34%, p=0.11). Significant differences between patients and matched controls for MTR/Dixon in the thigh were observed in timepoint 2 (MTR:p=0.02, Fper:p=0.04) but not in timepoint 1 or across ankle data, which may be indicative of the mild impairment in the HNPP cohort and/or the small sample size of both our patient and control groups.Discussion and Conclusions
Multi-parametric MRI may detect length-dependent pathological changes in the proximal and distal nerves of the leg of individuals with inherited neuropathies. Future directions include enrolling a larger cohort of patients and controls to: 1) quantitatively compare the responsiveness of each measure to disease progression and 2) correlate findings with clinical neuropathy scores. If successful, these studies will provide responsive biomarkers of CMT progression.Acknowledgements
NIH/NIBIB K25-EB13659 and T32 EB014841-05 for funding.References
[1] Dortch, et al. Neurology 83:1545–1553 (2014). [2] Schmierer, et al. Ann Neurology 56(3):407-415 (2004). [3] Smith et al. 20th Scientific Meeting of ISMRM Abstract #2413 (2012). [4] Shy, et al. Neurology 64:1209-1214 (2005). [5] Morrow, et al. The Lancet Neurology 15:65-77 (2016).Figures
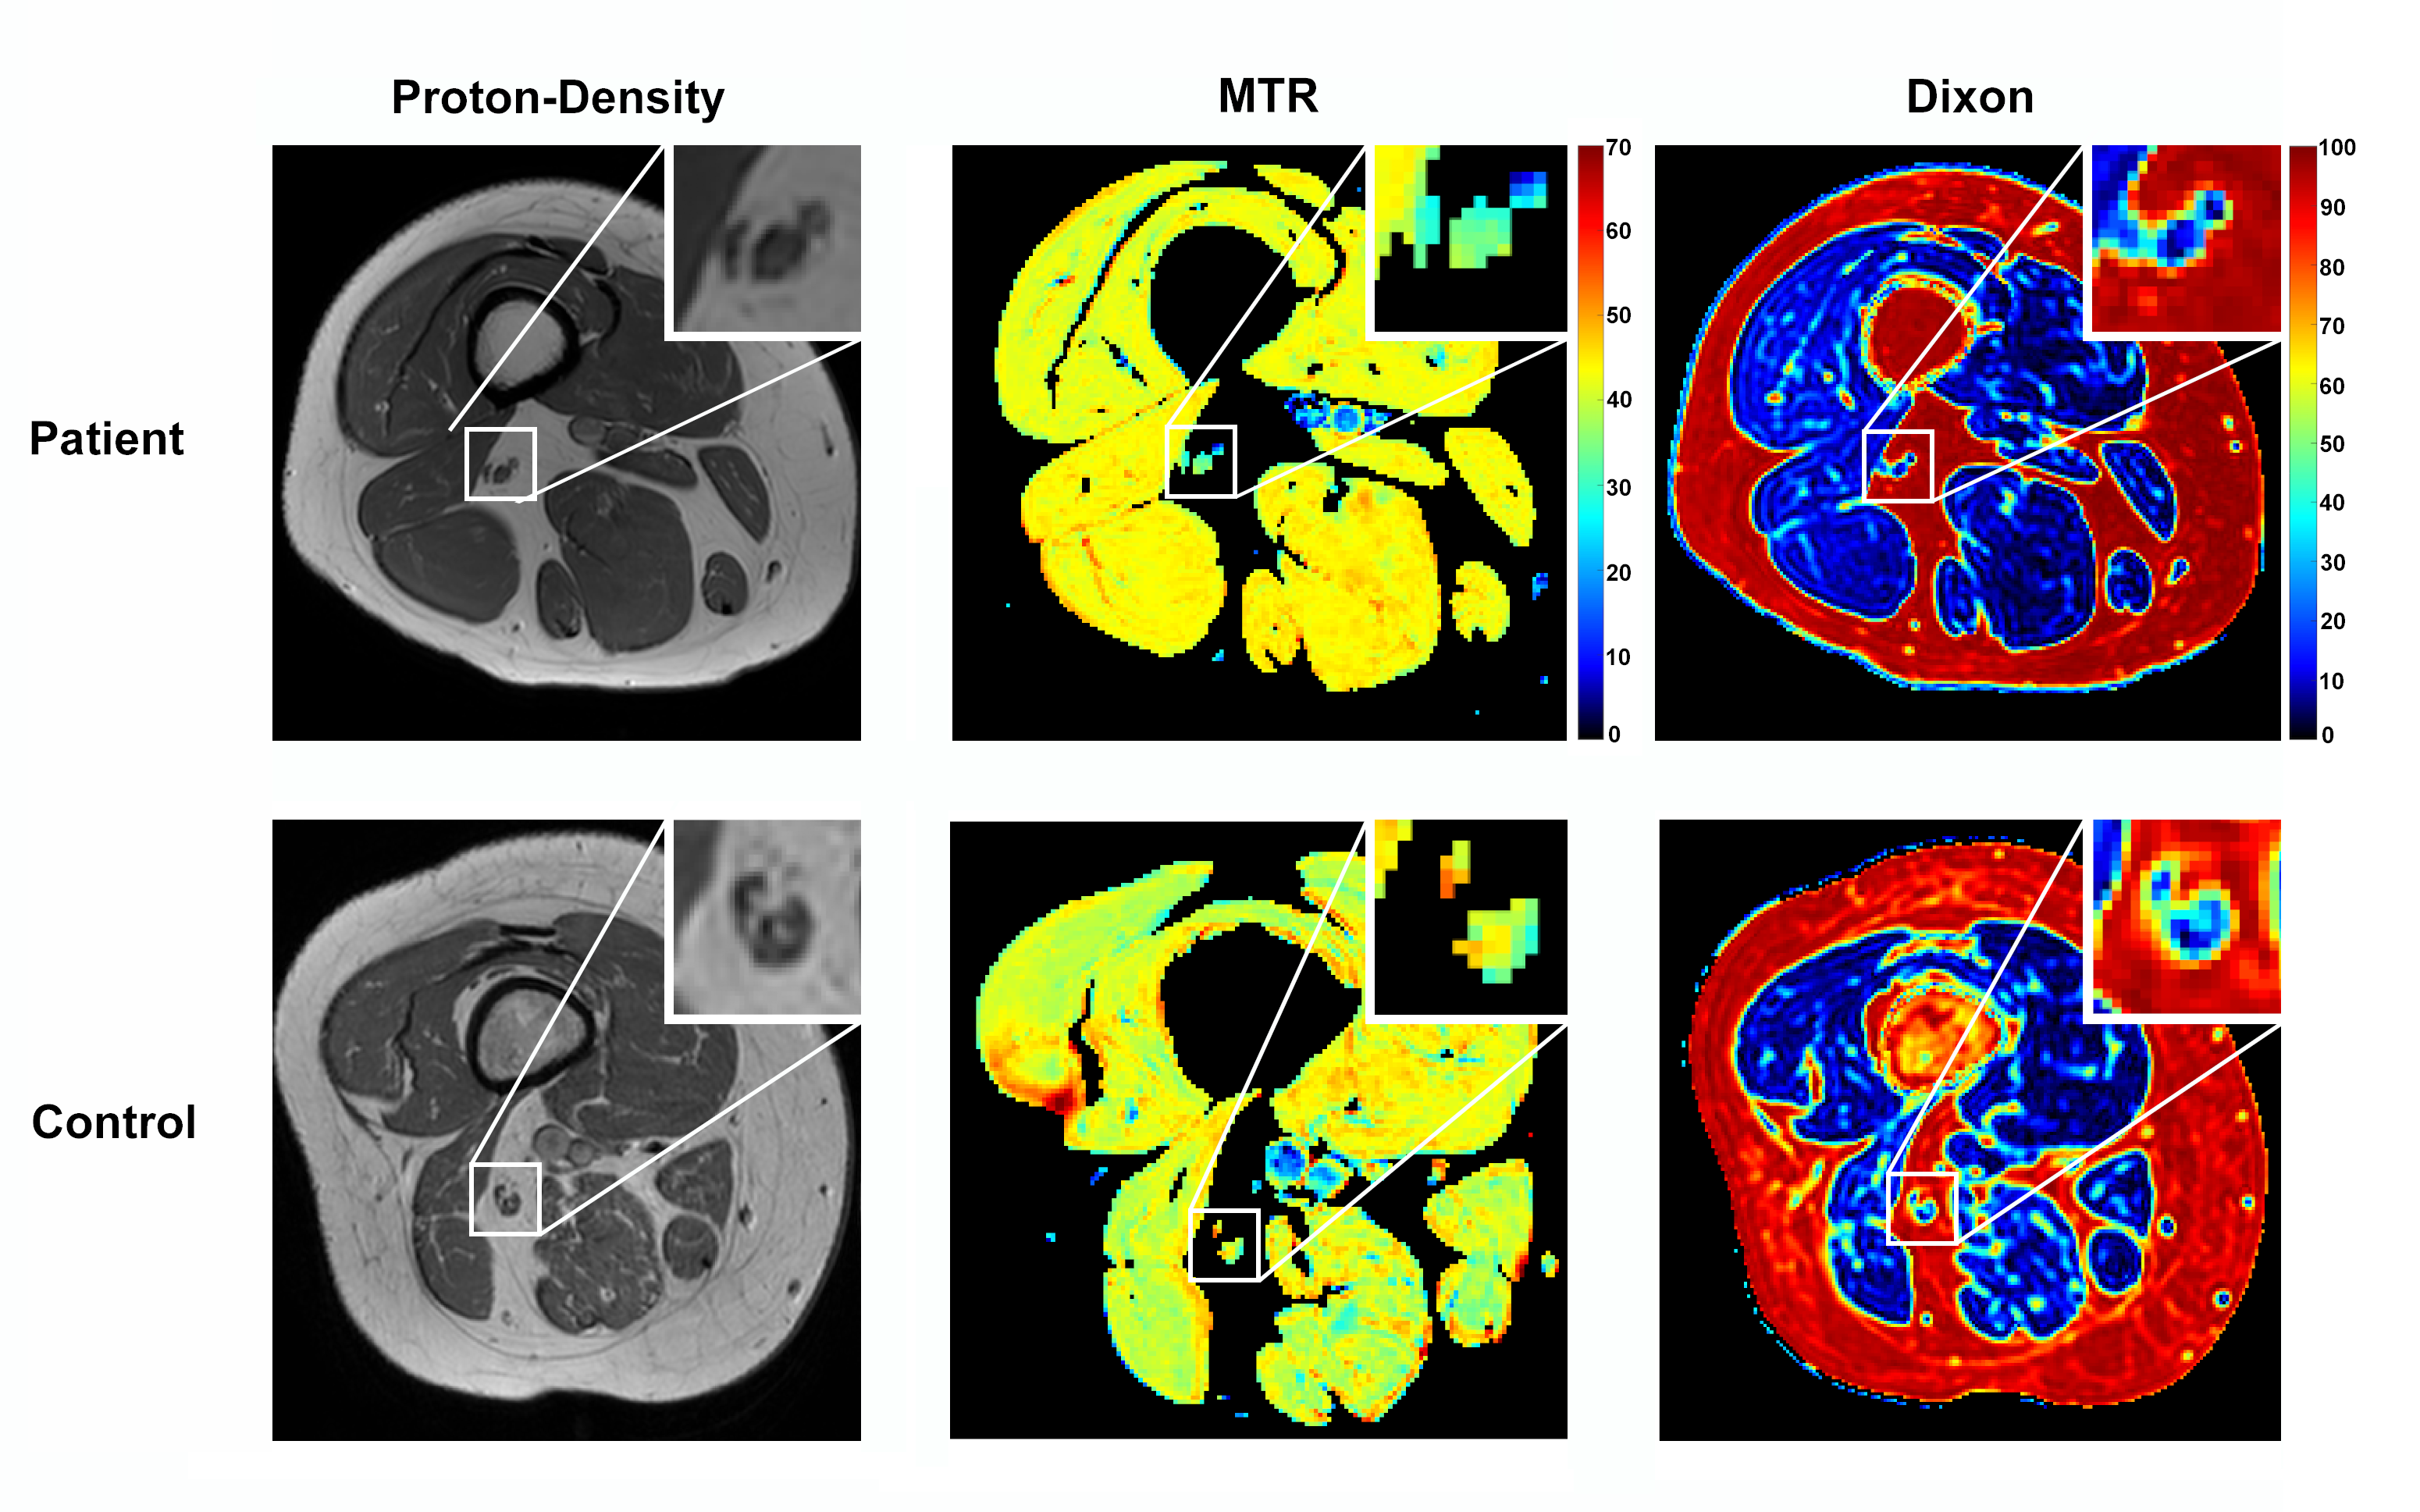
Figure 1: Sample results of proton-density,
magnetization transfer ratio (MTR), and fat-water (Dixon) imaging in proximal
leg (thigh) for a representative patient (top row) and control subject (bottom
row). Each imaging result includes a zoomed-in detail (top-right) showing the location
of the sciatic nerve.
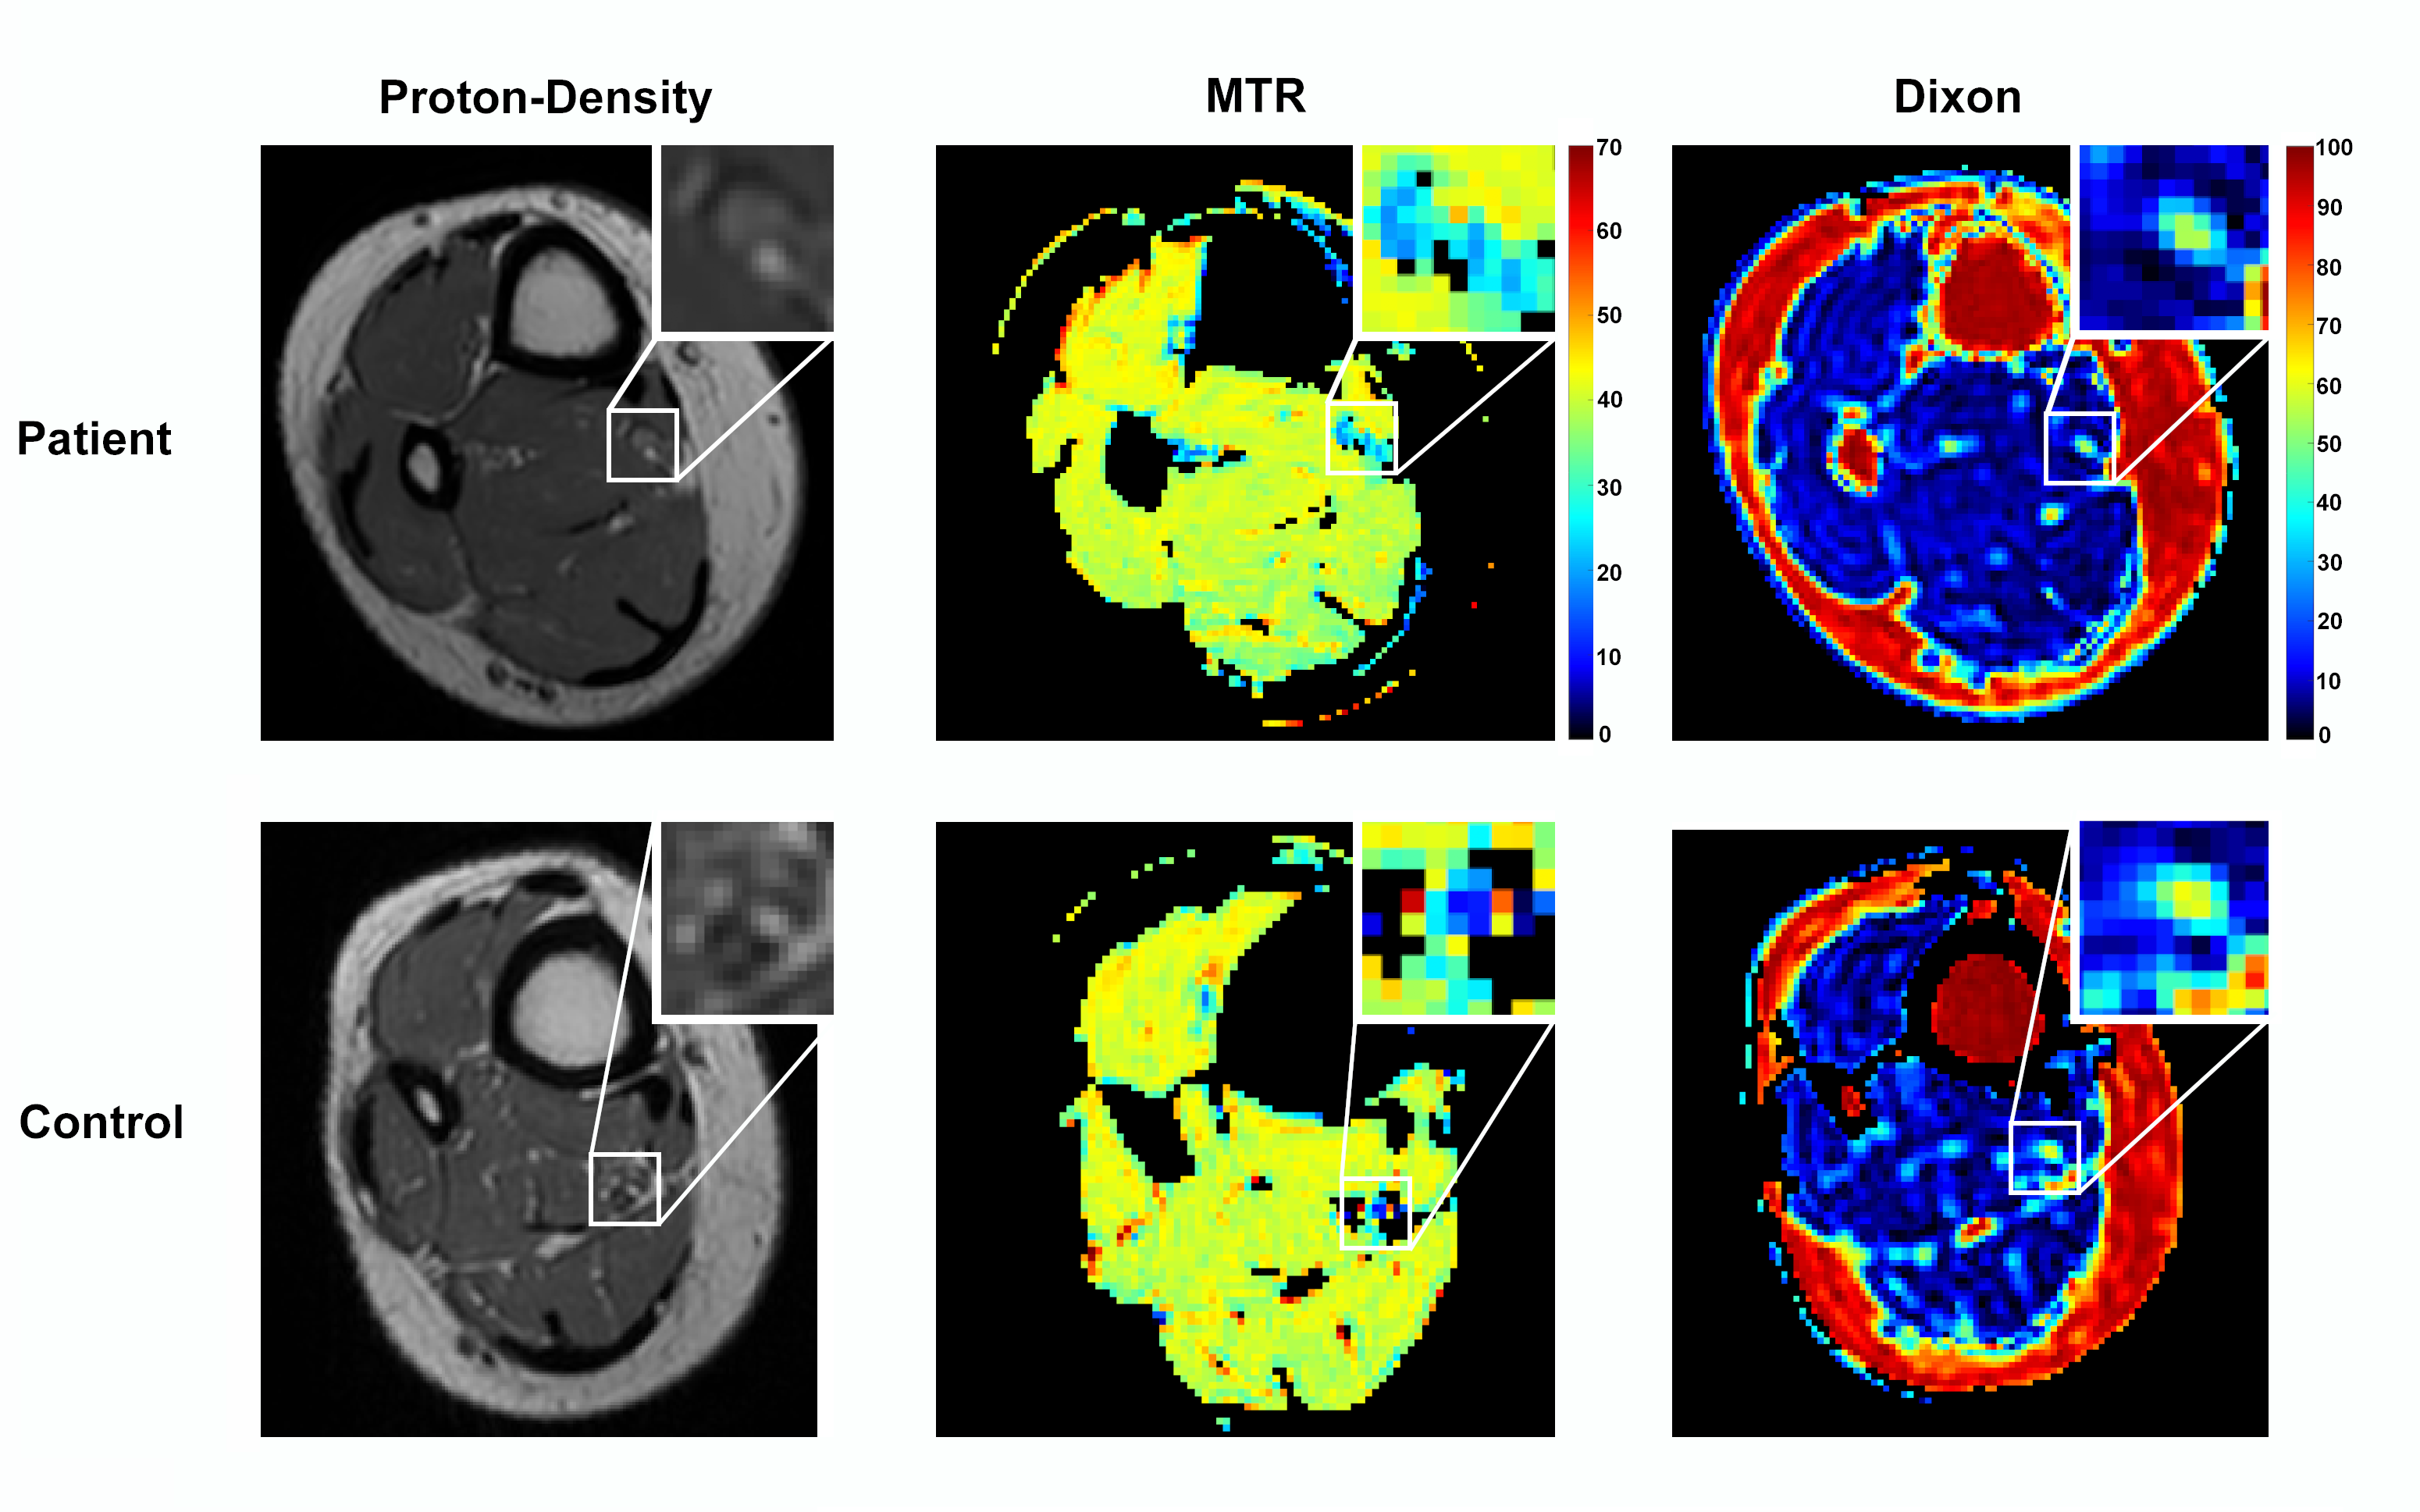
Figure 2: Sample results of proton-density,
magnetization transfer ratio (MTR), and fat-water (Dixon) imaging in distal leg
(ankle) for a representative patient (top row) and control subject (bottom
row). Each imaging result includes a zoomed-in detail (top-right) showing the
location of the tibial nerve.
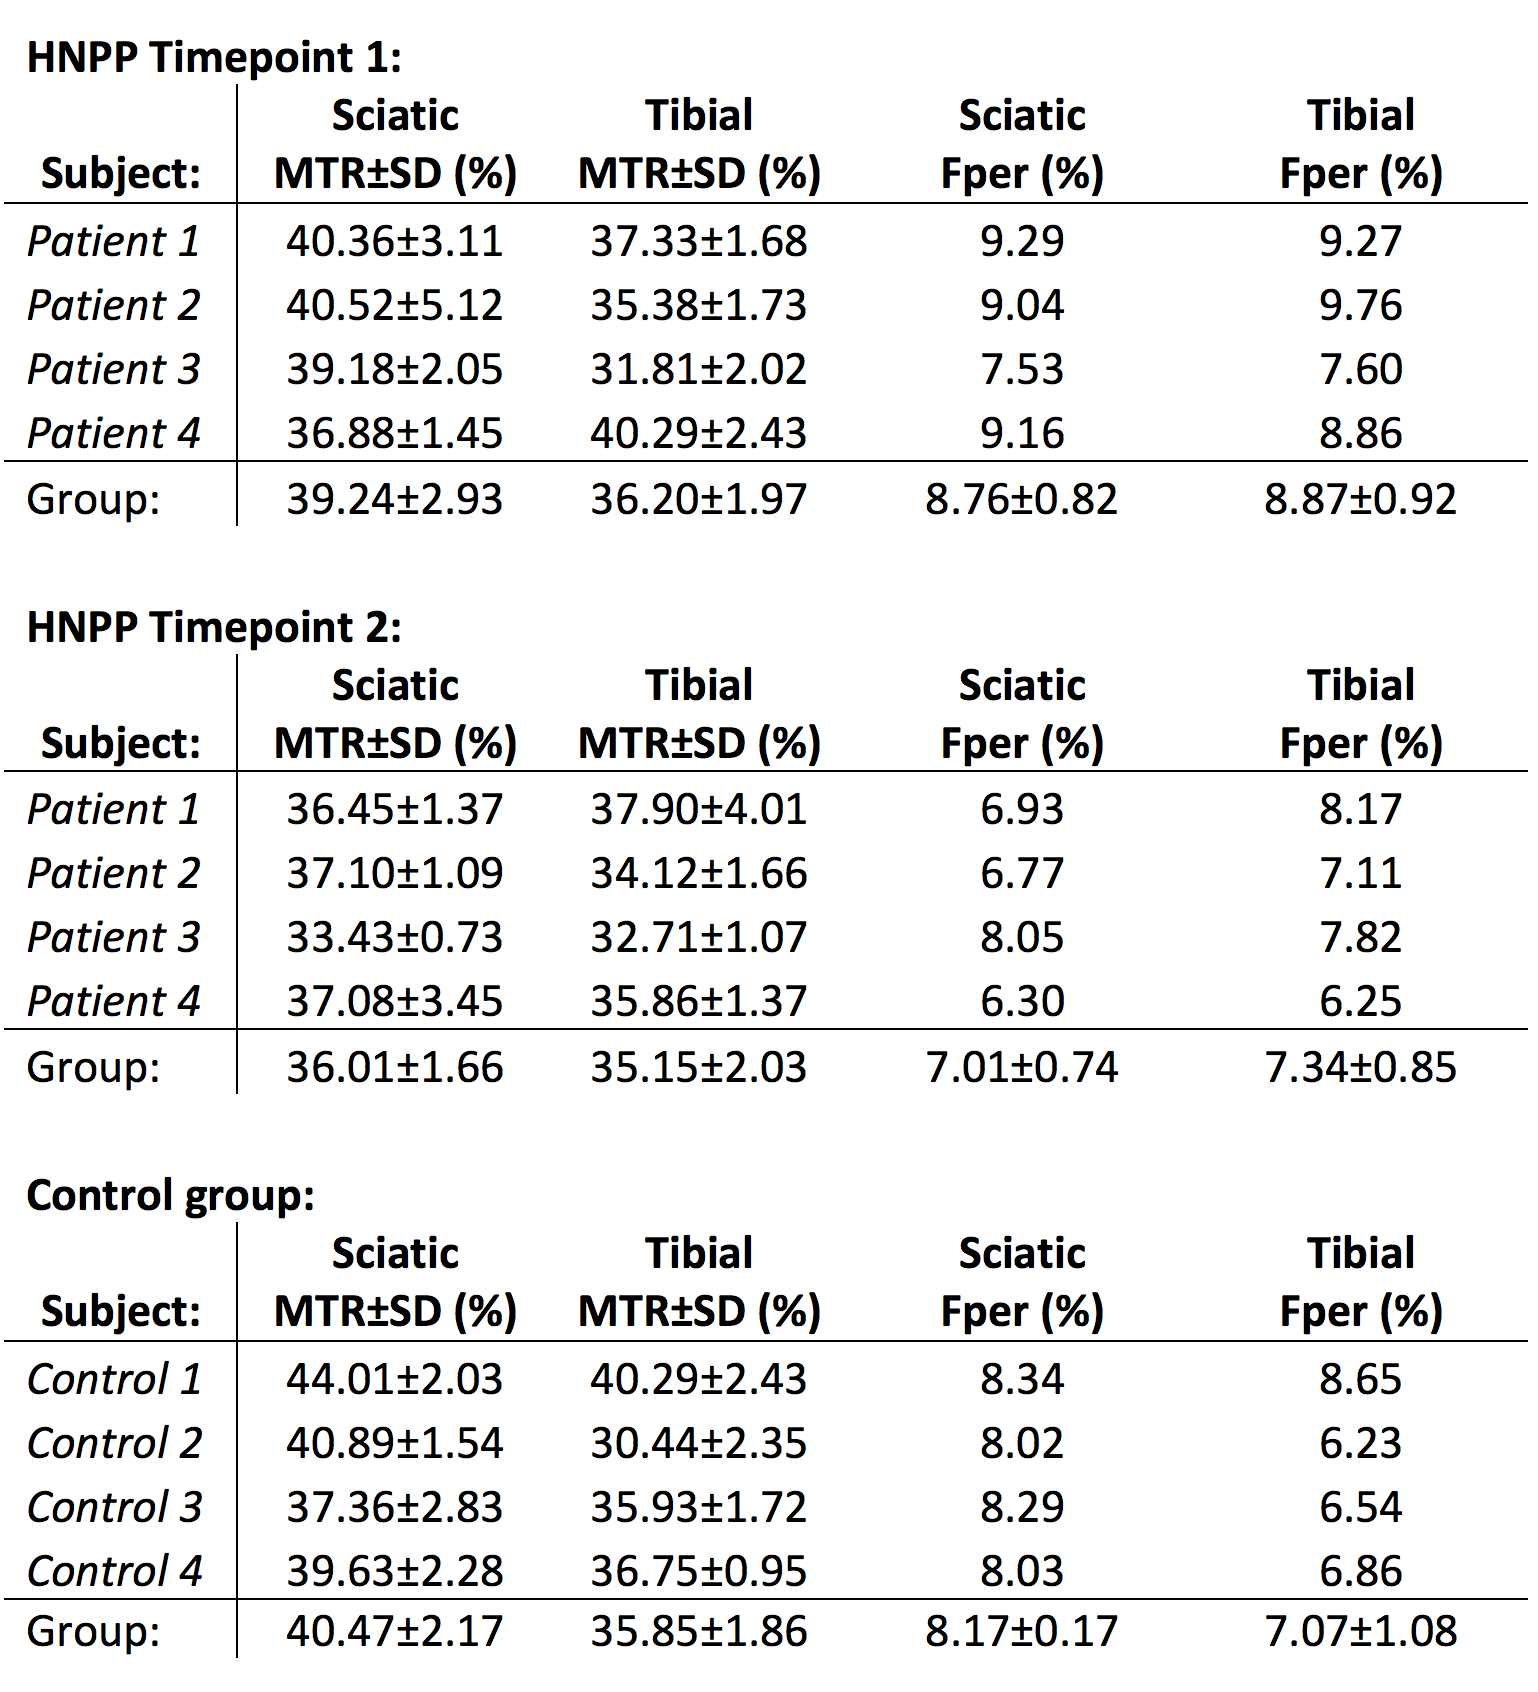
Table 1: Multi-parametric results for patient
(timepoints 1 and 2) and control MTR and Dixon data. Mean MTR ± standard
deviation values tabulated from regions of interest (ROIs) of the sciatic and
tibial nerve. Median Fat percentage (Fper) values derived from segmented muscle
on Dixon images. Note that only the median Fper value is reported for each
patient due to the large heterogeneity in Fper across the entire muscle
volume.