3731
Magnetic susceptibility of the dentate in a longitudinal study of Friedreich ataxia1Monash Biomedical Imaging, Monash University, Melbourne, Australia, 2Monash Institute of Cognitive and Clinical Neurosciences, Monash University, Melbourne, Australia, 3Centre of Excellence for Integrative Brain Function, Australian Research Council, Melbourne, Australia, 4The Australian eHealth Research Centre, CSIRO Health and Biosecurity, Herston, Australia, 5Bruce Lefroy Centre for Genetic Health Research, Murdoch Childrens Research Institute, Melbourne, Australia, 6Department of Paediatrics, University of Melbourne, Parkville, Australia, 7Victorian Clinical Genetics Service, Parkville, Australia, 8Department of Medicine, Monash University, Melbourne, Australia
Synopsis
We performed in-vivo measurements of the magnetic susceptibility in the dentate nucleus in individuals with Friedreich ataxia and healthy controls over a two-year longitudinal study using quantitative susceptibility mapping. The results show a significant susceptibility difference between individuals with Friedreich ataxia and control subjects, and a strong correlation with disease severity in the Friedreich ataxia cohort. These findings may lead to the development of a sensitive biomarker of disease severity and progression in Friedreich ataxia.
Introduction
Friedreich ataxia (FRDA) is a recessively inherited, progressive neurological disease characterised by impaired mitochondrial iron metabolism. Histology studies have shown targeted atrophy and the redistribution of iron, copper and zinc in the brain, particularly in the dentate nuclei of the cerebellum1. However, in vivo biomarkers of disease progression and treatment efficacy are lacking.
A recent advance in MRI, quantitative susceptibility mapping (QSM), allows for the in vivo measurement of magnetic susceptibility and provides an indirect assessment of iron, copper and zinc in the brain. In this abstract, we report our preliminary 2-year longitudinal QSM findings in the dentate nuclei of individuals with FRDA relative to healthy controls, and the correlation of susceptibility changes with markers of disease severity. The results of the baseline cross-sectional analysis have previously been reported2. In this work, we report our preliminary longitudinal findings and the cross-sectional relationships at the two year follow-up.
Methods
MRI images were acquired at two time points, approximately two years apart, on a 3T Siemens Skyra. At baseline, 31 individuals with genetically-confirmed FRDA and 33 healthy controls were scanned. At follow-up two years later, 19 individuals with FRDA and 18 healthy controls were scanned a second time. Disease severity was quantified using the Friedreich Ataxia Rating Scale (FARS). Longitudinal analysis was performed using those volunteers who were scanned at both time points.
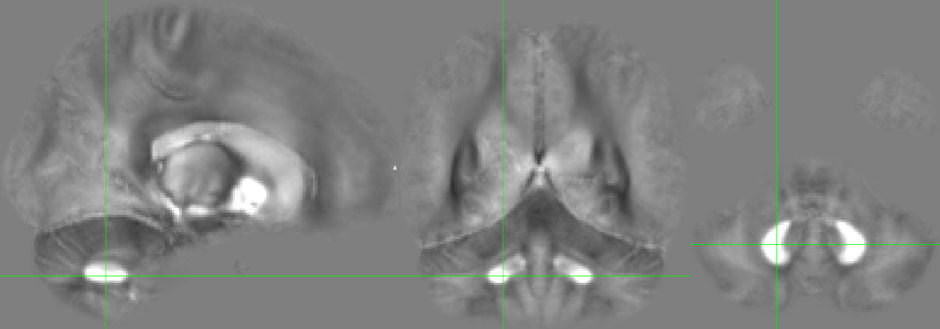
Structural and functional MRI scans were acquired, including a dual-echo GRE (TR=30ms, TE=7.38,22.14ms, FA=15, FOV=230x230mm, 160 axial slices, 0.9x0.9x0.9mm3 voxels, TA=11.5mins). k-space data for the GRE was stored and retrospectively reconstructed offline. Individual coil images were offset corrected using the Hermitian inner product and combined using a magnitude-weighted sum. Phase was processed using Laplacian unwrapping3 and VSHARP4. QSM images were reconstructed using the iLSQR algorithm5. A cohort average QSM image is provided in Figure 1.
The dentate nuclei were traced manually from QSM images by experienced raters at baseline, and interpolated for follow-up scans using rigid registration6. Interpolated masks were inspected and approximately 50% required additional manual editing. QSM values were calculated as the mean in each region (left dentate nucleus and right dentate nucleus). Intensities were referenced to the whole brain mean susceptibility value.
Results
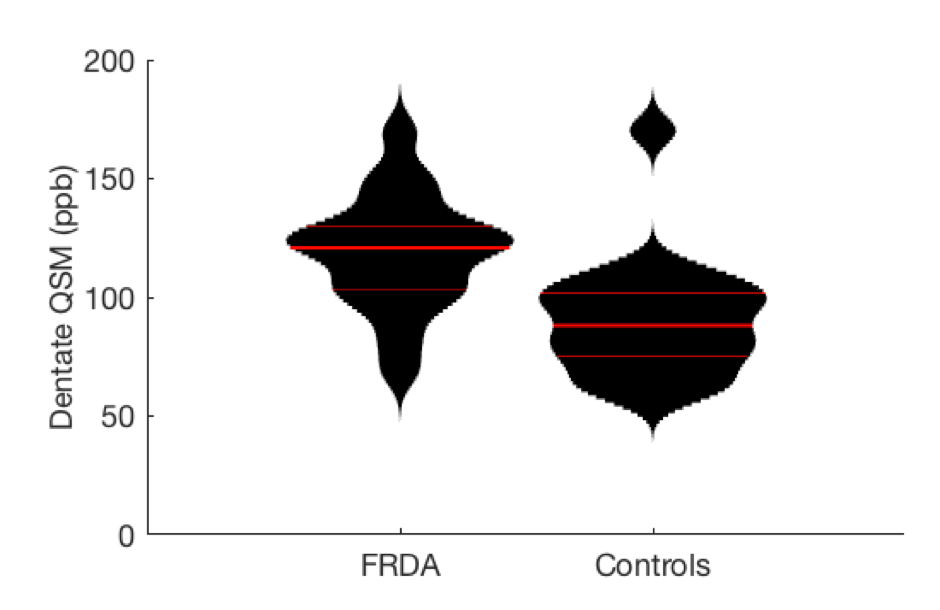
QSM values in the dentate nuclei of individuals with FRDA were significantly higher than controls in the cross-sectional analysis at follow-up (FRDA=119ppb, controls=91ppb, mean difference = 28ppb, Wilcoxon rank sum p<10-4) (Figure 2). As no significant difference was observed between values in the left and right nuclei (p=0.40 in controls and p=0.61 in FRDA) the mean score of the two nuclei is reported.
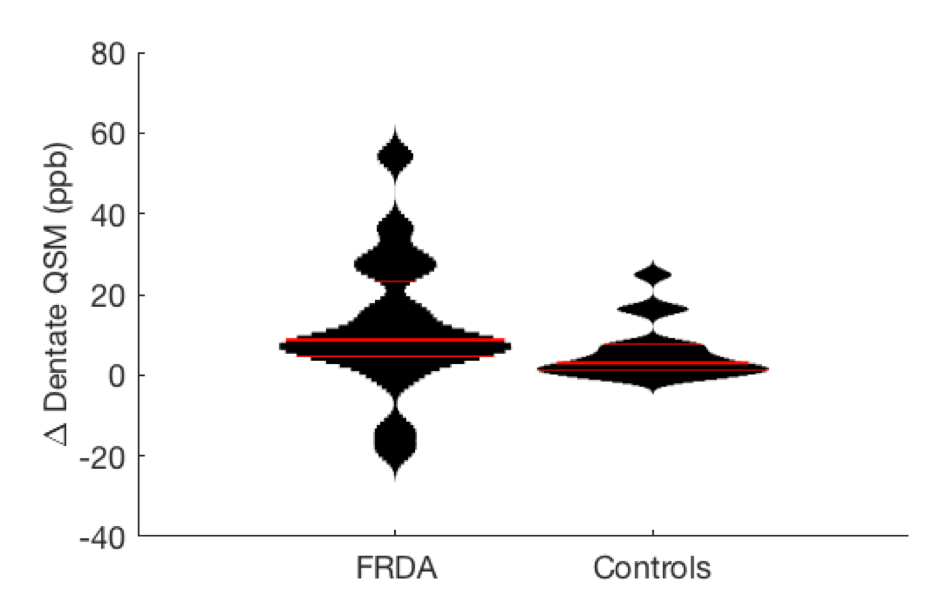
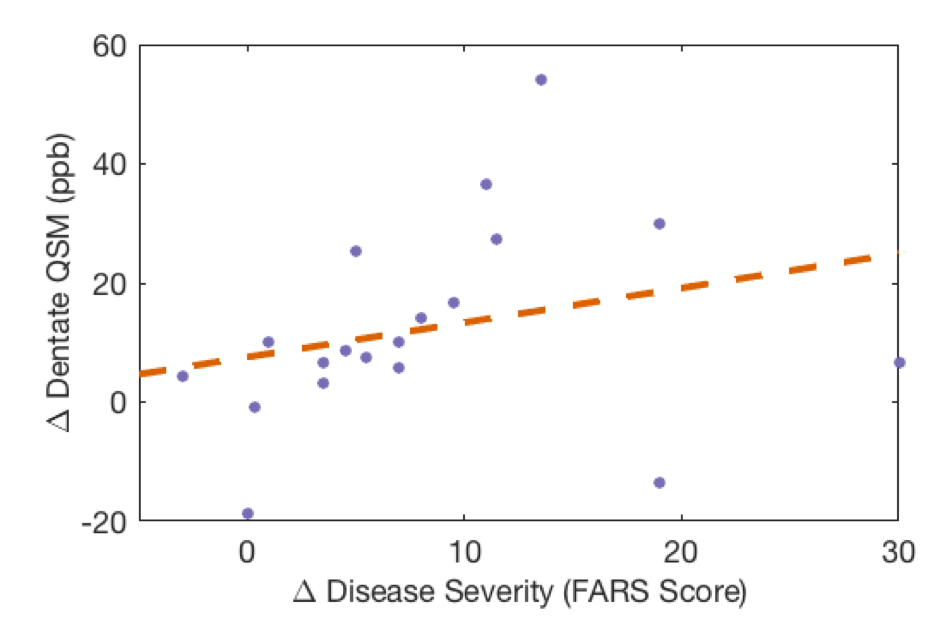
A longitudinal difference was also observed in dentate nuclei QSM values between the two groups (mean longitudinal change FRDA=12.3ppb, controls=5.6ppb, Wilcoxon rank sum p=0.043) (Figure 3). The longitudinal change in disease severity (FARS) was found to correlate with the change in dentate nuclei QSM (Spearmans rho=0.53, p=0.021) (Figure 4).
Discussion
This study employed QSM to non-invasively measure magnetic susceptibility in the dentate nuclei of individuals with FRDA and healthy controls. The cross-sectional analysis at follow-up was employed as a test-retest measure to compare with the analysis performed at baseline. The cohort difference and the statistical significance of the effect were similar despite minor changes in the QSM processing methods since the baseline analysis was performed.
The longitudinal change in QSM values was significantly different in the FRDA cohort, and was found to correlate with the disease progression (change in FARS score). The change in QSM may be iron accumulation, increased iron concentration due to atrophy, or decreased myelin due to neuronal loss. Irrespective of the origin of the change in susceptibility, QSM in the dentate nucleus appears to be a sensitive biomarker of FRDA and disease progression.
Our current and future work will be to examine the predictive value of QSM for assessing responses to therapeutic intervention and staging of the disease.
Conclusion
The consistency between the results of baseline and two year cross-sectional analyses of QSM as a biomarker in FRDA has been demonstrated. The significant change observed in the QSM values during a two year period highlights the important advantage of QSM as a sensitive longitudinal staging tool. Motion in individuals with FRDA and progressive atrophy of the dentate nuclei are expected but hinder automated image analysis approaches. More accurate segmentation of key brain structures including the dentate nuclei, the basal ganglia and mid-brain structures will improve the accuracy and sensitivity of longitudinal assessments and allow measurements of atrophy to be reported.Acknowledgements
Funding was received from the National Health and Medical Research Council to support this work (Project Grant 1046037). LC receives funding from the Friedreich Ataxia Research Alliance (USA) and the Friedreich Ataxia Research Association (Australasia).References
- Koeppen, A. H. et al. Friedreich’s Ataxia Causes Redistribution of Iron, Copper, and Zinc in the Dentate Nucleus. The Cerebellum 11, 845–860 (2012).
- Harding, I. H. et al. Tissue atrophy and elevated iron concentration in the extrapyramidal motor system in Friedreich ataxia: the IMAGE-FRDA study. J Neurol Neurosurg Psychiatry jnnp-2015-312665 (2016). doi:10.1136/jnnp-2015-312665
- Li, W., Wu, B. & Liu, C. Quantitative susceptibility mapping of human brain reflects spatial variation in tissue composition. NeuroImage 55, 1645–1656 (2011).
- Wu, B., Li, W., Guidon, A. & Liu, C. Whole brain susceptibility mapping using compressed sensing. Magn. Reson. Med. 67, 137–147 (2012).
- Li, W. et al. A method for estimating and removing streaking artifacts in quantitative susceptibility mapping. NeuroImage 108, 111–122 (2015).
- Jenkinson, M., Beckmann, C. F.,
Behrens, T. E. J., Woolrich, M. W. & Smith, S. M. FSL. NeuroImage 62,
782–790 (2012).
Figures