3729
Radiological Imaging of Brain Iron Deposits and T1 quantification feasibility using 3D UTE Cones.1Radiology and Nuclear Medicine, Erasmus MC, Rotterdam, Netherlands, 2Porphyria Center Rotterdam, Center for lysosomal and metabolic disease, Erasmus MC, Rotterdam, Netherlands, 3Neurology, Erasmus MC, Rotterdam, Netherlands
Synopsis
In this work, we demonstrate that 3D UTE cones
Introduction
Iron accumulation in the brain is a common cause of neurodegeneration and it is also involved in normal ageing1. Some neurodegenerative diseases and neurological impairments, as aceruplasminemia2, an iron metabolic disorder, can be characterized by the exacerbated accumulation of iron in the brain even in young adults. Figure 1 shows different brain regions with iron deposits. T2* mapping with multi-echo gradient echo and QSM (quantitative susceptibility mapping) are techniques currently used in order to quantify iron in tissue. However, iron quantification can be challenging when considerable amounts of iron are present. The signal decay can be so fast that these conventional techniques are not able to provide reliable quantitative iron measurements. Ultrashort TE (UTE) sequences can be used as an alternative for these shortest T2* species. Recently, a relaxometry study mapping R1 and R2* has been published using phantoms with increasing concentrations of iron-oxide nanoparticles (IONP) to determine the utility of UTE in extreme cases3 . However, the study did not provide any validation on patients. The purpose of this work is to explore the feasibility of radiological imaging and T1 quantification in diseases with a high iron burden.
Methods
Four patients with massive brain iron accumulation were investigated (4 males, range 27-65); three of them were diagnosed with aceruloplasminemia. For MRI, a 3T MR scanner (GE healthcare, Discovery MR750) with an 8 channel head coil was used. A standard MRI protocol was supplemented by T2, T2* and T1 relaxometry measurements covering the entire brain and cerebellum.
Relaxometry: For T2 mapping an 8-echo 2D CPMG sequence (FSE, TR = 4000 ms, 8 echoes, TE range = 10 – 80 ms, voxel size 0.9x1.5x2.0 mm3) was used. T2* maps were generated with 2 additional acquisitions. The first considered a standard 16-echo 3D rf spoiled GRE (SPGR) scan (TR = 27. 6ms, flip angle – FA= 13°,TE range = 1.8 - 24.8 ms, readout BW = 125 KHz , voxel size 1.0x1.0x1.0 mm3). Given the higher iron deposition expected in these patients, an additional T2* map was generated using a 6-echo based 3D UTE (cones trajectory, TR = 14.9ms, FA = 8°, TE range = 0.032 – 10.0 ms, readout BW = 125 KHz, voxel size 1.1x1.1x2.0 mm3). To produce two T1 maps using 3D UTE scanning in places with higher iron deposition, 5 additional measurements were performed using a variable TR and a variable flip angle scheme (geared for a 3-point fitting). For variable TR mapping, 2 TRs were additionally chosen (with TR = 5.0 ms and TR = 10.0, TE = 0.0032 ms, respectively). For variable flip angle mapping, TR was fixed at TR = 5.0 ms and FL = 4° and FL = 16°. All relaxometry scans covered the same volume and were orientation matched. Relaxation maps were then calculated using MATLAB. Selected ROIs in different regions in the brain were placed dictated by the iron deposition signature provided by the 16-echo 3D SPGR scan, which had the highest voxel resolution from all the scans in the relaxometry series. ROIs were also placed in regions with higher signal intensity than surrounding white matter on the T1-weighted 3D UTE scans.
Results
Figure 2 illustrates this work with the images from the youngest participant in the study. Different colored arrows are used to depict the main iron-content regions. White arrows show the main bilateral deposits of iron. Red arrows show the second main iron deposit. Hypo-intensity is mainly present in striatum regions revealing a large iron distribution . Figure 2.c shows the shortest echo of 3D UTE cones. It enables enhanced signals for iron containing regions. Figure 2.d, T2 mapping allows to detect the whole region with iron deposition. Figure 1.e Susceptibility weighted image allows to confirm 2 different iron-content regions in the striatum. Table 1 shows the T1 measurements in the same subject showed in figure 2.
Discussion
As can be observed in figure 2, 3D UTE cones provides T1 contrast in iron deposits. Subtle iron depositions that correlate with hyper-intense regions in 3D UTE can be depicted. Table 1 demonstrate the feasibility of quantitative measurements with T1 relaxometry. Other conventional techniques such as susceptibility weighted and T2 mapping only allow to detect iron regions but they are not capable of quantifying it.
Conclusion
3D UTE cones sequence enables a new biomarker based on T1 quantification for the study of neurodegenerative diseases, neurological disorders and ageing when iron metabolism plays an important role. This study is now ongoing, future analyses will include expansion of the patient cohort investigating the correlation of these deposits with symptoms and prognosis. The longitudinal effectiveness of drugs dealing with iron deposits could be also evaluated using these technique.
Acknowledgements
Patients and relatives supporting this research.References
- McNeill, A., Birchall, D., Hayflick, S. J., Gregory, A., Schenk, J. F., Zimmerman, E. A.,et al. (2008). T2* and FSE MRI distinguishes four subtypes of neurodegeneration with brain iron accumulation. Neurology, 70(18), 1614-1619.
Miyajima, H. (2015). Aceruloplasminemia. Neuropathology, 35(1), 83-90.
Wen Hong, Qun He, Shujuan Fan, Michael Carl, Hongda Shao, Jun Chen, Eric Y Chang and Jiang Du. Imaging and quantification of iron-oxide nanoparticles (IONP) using MP-RAGE and UTE based sequences. Magnetic Resonance in Medicine. Volume 78, Issue 1, July 2017, Pages: 226–232,
Figures
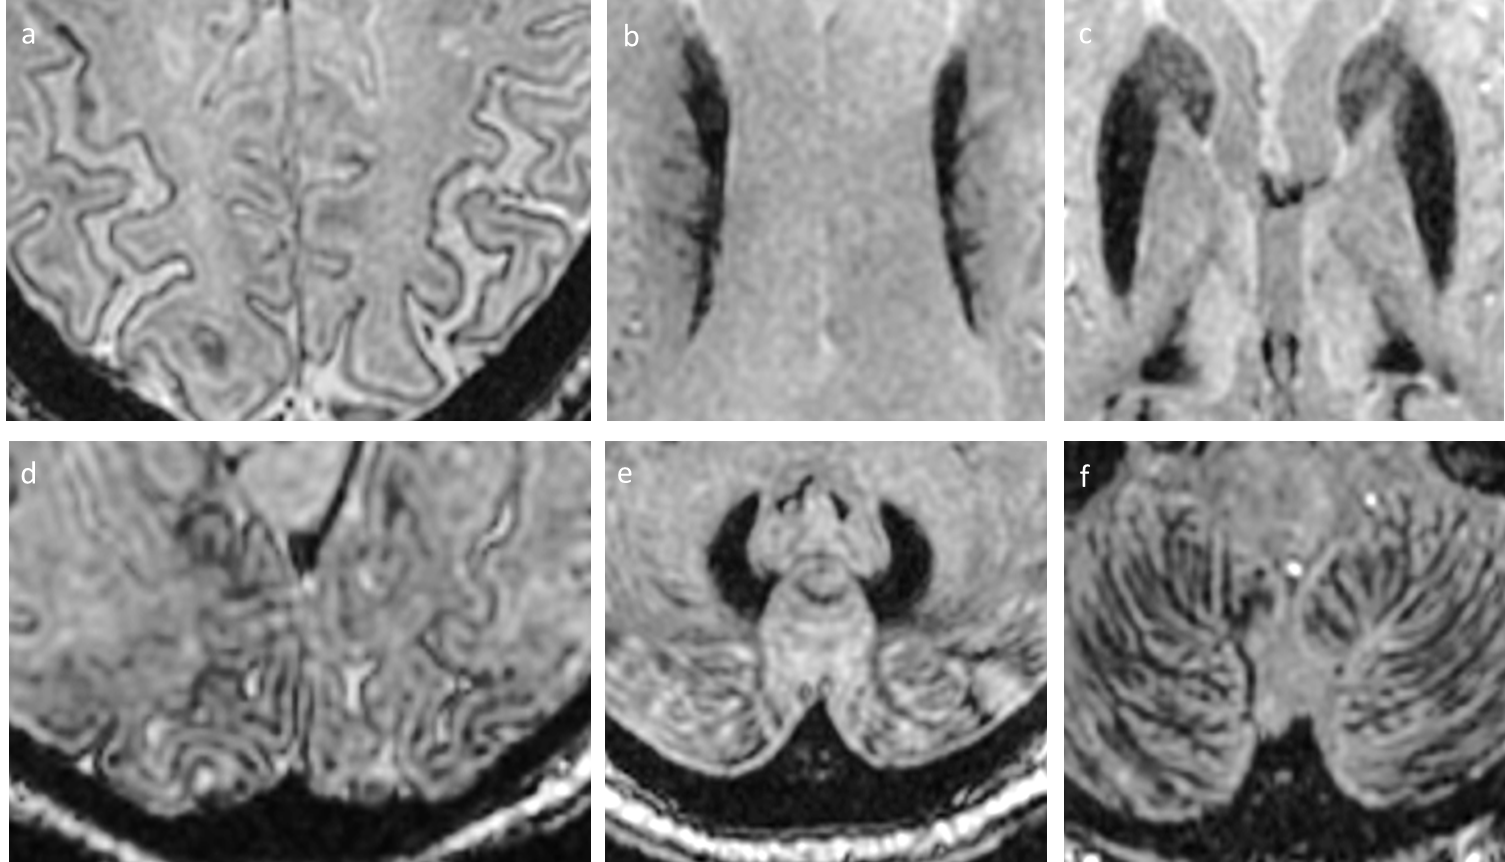
Figure 1: Patient with a massive iron load in the brain (male, 27 yo). Different T2* weightings from the high-resolution 3D 16-echo T2* SPGR mapping sequence in the upper brain (a), corpus callosum (b), basal ganglia (c), occipital region (d), dentate nucleus (e) and lower cerebellum (f).
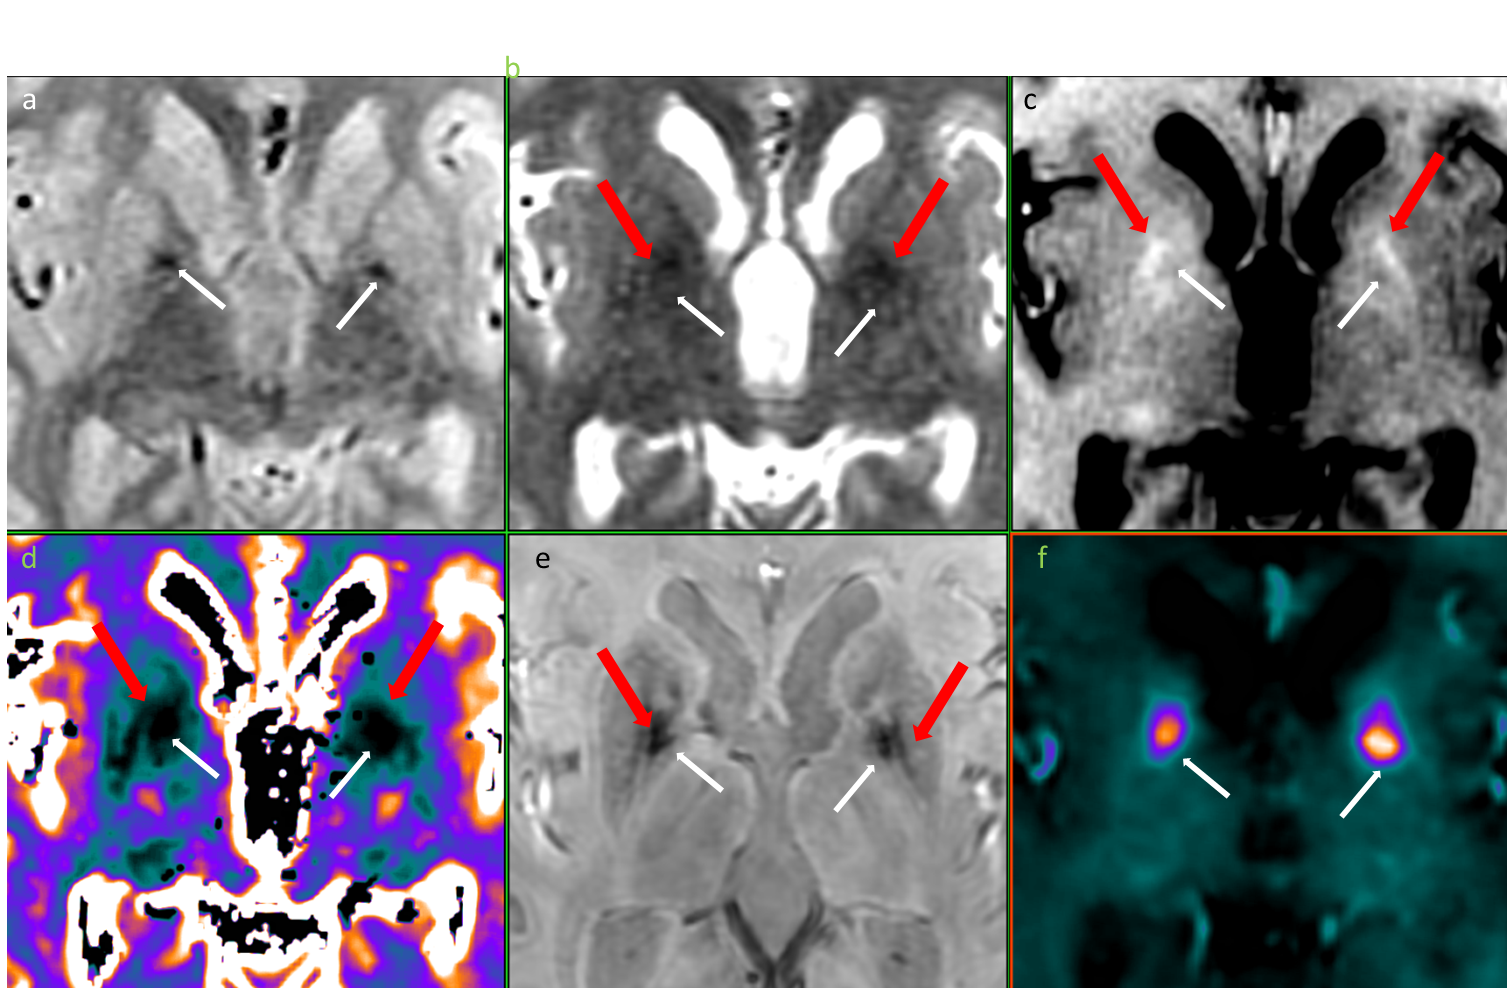
Figure 2. Patient with a massive iron load in the brain (male, 27 yo). White arrows show the main bilateral deposits of iron. Red arrows show the secondary iron deposit. First row: (a) T2 mapping. 1st echo image, ; (b) T2 mapping. 8th echo image, hypo-intensity also affects striatum revealing iron accumulation in a larger region ; (c) 3D UTE cones (TR = 14.9, FA =8o, TE = 0.032) depicts different T1 contrast for putamen and globus pallidus. Second row: (d) T2 map allows to detect the whole region with iron deposition; (e) Susceptibility weighted image allows to differentiate 2 different iron-content regions; (f) R2* map.
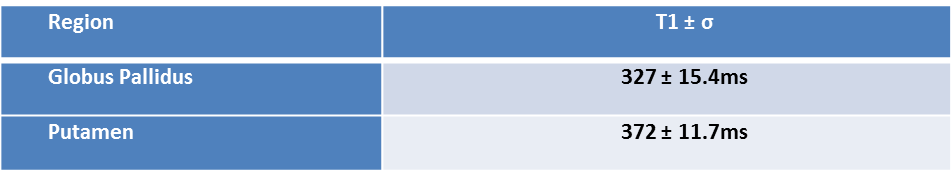
Table 1. T1 quantification with 3D UTE Cones in striatum for 2 different iron content regions. ROIs were manually selected in regions pointed by the arrows (Putamen ventral boundary, red arrows; Globus Pallidus, white arrows)