3728
Developmental alteration of mean diffusivity in striatum of transgenic Huntington’s disease monkey1Yerkes Imaging Center, Yerkes National Primate Research Center, Emory University, Atlanta, GA, United States, 2Department of Psychology, Emory University School of Medicine, Atlanta, GA, United States, 3Division of Developmental and Cognitive Neuroscience, Yerkes National Primate Research Center, Emory University, Atlanta, GA, United States, 4Department of Human Genetics, Emory University School of Medicine, Atlanta, GA, United States, 5Division of Neuropharmacology and Neurologic Diseases, Yerkes National Primate Research Center, Emory University, Atlanta, GA, United States
Synopsis
Huntington Disease (HD) is a neurodegenerative disorder with a primary etiology of striatal pathology. Abnormal mean diffusivity changes have been seen previously in HD patients. However, it remains not fully understood how the diffusivity property of striatum evolves during the development of the disease. This study examined the progressive changes of striatum of rhesus monkey brains with HD gene mutation using diffusion tensor imaging (DTI), and it was found that there was significant MD difference from the control animals in striatum at very early age.
PURPOSE
To evaluate the progressive changes of diffusivity property of striatum in the developing brain of Huntington’s disease.METHODS
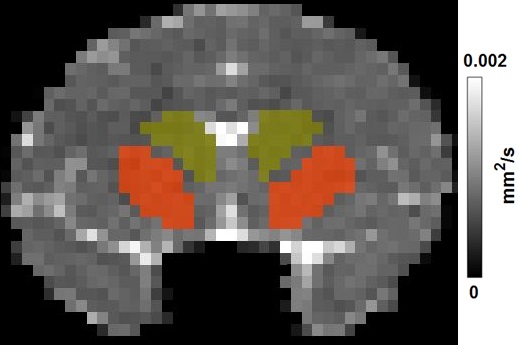
Three HD rhesus monkeys (male) were generated by lentiviral-mediated transgenesis as previously described 1. Four age-matched wild-type non-transgenic rhesus macaques (2 males and 2 females) were used as control. The animals were scanned at the age of 6 months, and then repeated every 6 months. Animals were anesthetized with ~1.0% isoflurane mixed with 100% O2. Diffusion weighted images were acquired with a Siemens 8-channel phased-array volume coil and an echo planar imaging (EPI) sequence with TE = 89 ms, TR = 5700 ms, voxel size = 1.3 mm × 1.3 mm × 1.3 mm, and a single b-value of 1000 s/mm2 with 30 diffusion encoding directions. Mean diffusivity (MD) maps were calculated with TBSS toolbox (FMRIB, Oxford). Striatal areas (caudate and putamen) were determined from the MD map of the animals (see Figure 1). A two-way ANOVA with group as the between-subject factor and age as the within-subject factor followed by post hoc analysis with p < 0.05 as the significant threshold, was used to determine the MD difference between groups at different ages.RESULTS
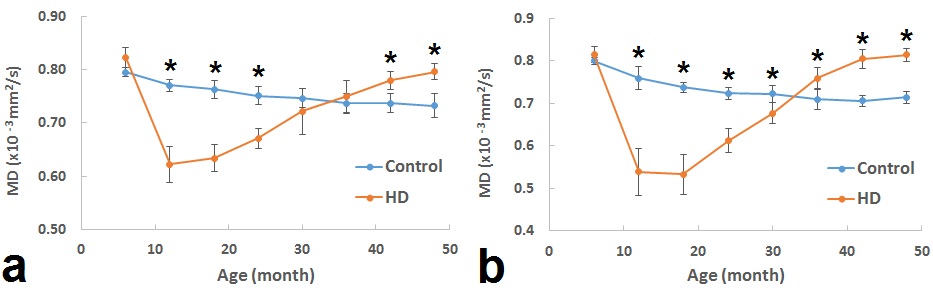
As shown in Figure 2, MD of the control animals had decreasing trends with ages in both caudate and putamen areas. In contrast, MD of striatum in the HD animals initially decreased at around 12 months and gradually increased during the development of the brain, demonstrating very different trajectory from the control animals (Fig 2a and 2b). Compared to control animals, significant MD reduction/increase in caudate and/or putamen was seen at age of 12 months and older.DISCUSSIONS
Striatal atrophy has been demonstrated previously in HD patients and animal models 2-4. Abnormal mean diffusivity changes in striatum have been seen in HD patients 5. It is of interest to evaluate the progressive changes of striatum from very early stage of the disease. The non-human primates mimic most aspects of human and provide an excellent model of HD comparable to those seen in human patients. As seen in the present study, longitudinal changes of striatal diffusivity property of the transgenic HD model of rhesus monkeys demonstrated abnormal development trajectory from as early as 12 months old. Also, HD animals have increased diffusivity compared to the control animals after 42 months ages, which is consistent with the increasing diffusivity found in caudate nuclei and putamen in adult patients 6,7. The MD decrease/increase in HD animals during development may be due to decrease/increase in water content, astrocytosis and/or microglia remodelling in the gray matter brain structures 8. Compared to the age when there was an arrest in white matter development around 23 months 9 and later cognitive deficit and motor impairment 2 in the same model, the striatal diffusivity decrease took place very early (~12 months age), indicating it may be a robust biomarker to detect the early disease progress in premanifest patients.Acknowledgements
The Yerkes National Primate Research Center is supported by the Office of Research Infrastructure Programs / OD P51OD011132. This study and the Transgenic Huntington’s Disease Monkey Resources are supported by a grant awarded by the ORIP/NIH (OD010930) to AWSC.References
1. Yang SH, Cheng PH, Banta H, et al. Towards a transgenic model of Huntington's disease in a non-human primate. Nature. 2008; 453(7197):921-24.
2. Chan AW, Jiang J, Chen Y, et al. Progressive cognitive deficit, motor impairment and striatal pathology in a transgenic Huntington disease monkey model from infancy to adulthood. PLoS One. 2015;10(5): e0122335.
3. Hobbs NZ, Barnes J, Frost C, et al. Onset and Progression of Pathologic Atrophy in Huntington Disease. AJNR Am J Neuroradiol. 2010;31(6):1036-41.
4. Peggy C. Nopoulos. Huntington disease: a single-gene degenerative disorder of the striatum. Dialogues Clin Neurosci. 2016; 18(1): 91–98.
5. Vincent A. Magnotta, Jinsuh Kim, Tim Koscik, et al. Diffusion tensor imaging in preclinical Huntington’s disease. Brain Imaging Behav. 2009; 3(1): 77–84.
6. Mascalchi M, Lolli F, Della Nave R, et al. Huntington disease: volumetric, diffusion-weighted, and magnetization transfer MR imaging of brain. Radiology. 2004;232(3):867-73.
7. Seppi K, Schocke MF, Mair KJ, et al. Diffusion-weighted imaging in Huntington's disease. Mov Disord. 2006;21(7):1043-7.
8. Osuka S, Matsushita A, Ishikawa E, et al. Elevated diffusion anisotropy in gray matter and the degree of brain compression. J Neurosurg. 2012;117(2):363–71.
9. Meng Y, Jiang J, Bachevalier J, et al. Developmental whole brain white matter alterations in transgenic Huntington’s disease monkey. Sci Rep. 2017;7(1):379.
Figures